Korean Circulation Journal
Introduction
Thrombospondin 1 (TSP-1) was initially discovered in platelets as a thrombin-sensitive protein
1)and is a matricellular protein that re- gulates cell-cell and cell-matrix interactions.
2)3)Functional studies in TSP-1
-/-mice have shown that TSP-1 inhibits angiogenesis,
4)promo- tes the healing of excision wounds,
5)and limits inflammatory respon-
Print ISSN 1738-5520 • On-line ISSN 1738-5555
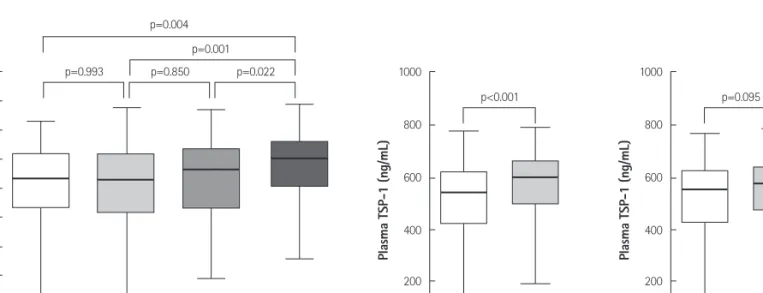
Higher Plasma Thrombospondin-1 Levels in Patients With Coronary Artery Disease and Diabetes Mellitus
Kyu-Young Choi, MD 1 , Dong-Bin Kim, MD 1 , Myung-Jun Kim, MD 2 , Bum-June Kwon, MD 1 , Seo-Yoon Chang, MS 2 , Sung-Won Jang, MD 1 , Eun-Joo Cho, MD 1 , Tai-Ho Rho, MD 1 , and Jae-Hyung Kim, MD 1
1