초분광영상 이용 오이 및 수박 묘의 수분함량 추정
김성헌1· 강정균1· 유찬석1· 강예성1· Tapash Kumar Sarkar1· 강동현2* · 구양규3· 김동억4
1경상대학교 바이오시스템공학과(농업생명과학연구원), 2국립농업과학원 농업공학부
3원광대학교 원예산업학과(생명자원과학연구소), 4한국농수산대학 교양공통과
Estimation of Moisture Content in Cucumber and Watermelon Seedlings Using Hyperspectral Imagery
Seong-Heon Kim1, Jeong-Gyun Kang1, Chan-Seok Ryu1, Ye-Seong Kang1, Tapash Kumar Sarkar1, Dong Hyeon Kang2*, Yang-Gyu Ku3, and Dong-Eok Kim4
1Department of Bio-Systems Engineering, College of Agriculture and Life Science, Gyeongsang National University(Institute of Agriculture and Life Science), Jinju, 52828, Republic of Korea
2Department of Agricultural Engineering, National Institute of Agricultural Sciences, RDA, Jeonju, 54875, Republic of Korea
3Department of Horticulture Industry, College of Life Science and Resource, Wonkwang University, Iksan, 54538, Republic of Korea
4Department of General Education, Korea National College of Agriculture and Fisheries, Jeonju, 54874, Republic of Korea
Abstract. This research was conducted to estimate moisture content in cucurbitaceae seedlings, such as cucumber and watermelon, using hyperspectral imagery. Using a hyperspectral image acquisition system, the reflectance of leaf area of cucumber and watermelon seedlings was calculated after providing water stress. Then, moisture content in each seedling was measured by using a dry oven. Finally, using reflectance and moisture content, the moisture con- tent estimation models were developed by PLSR analysis. After developing the estimation models, performance of the cucumber showed 0.73 of R2, 1.45% of RMSE, and 1.58% of RE. Performance of the watermelon showed 0.66 of R2, 1.06% of RMSE, and 1.14% of RE. The model performed slightly better after removing one sample from cucumber seedlings as outlier and unnecessary. Hence, the performance of new model for cucumber seedlings showed 0.79 of R2, 1.10% of RMSE, and 1.20% of RE. The model performance combined with all samples showed 0.67 of R2, 1.26% of RMSE, and 1.36% of RE. The model of cucumber showed better performance than the model of watermelon. This is because variables of cucumber are consisted of widely distributed variation, and it affected the performance. Further, accuracy and precision of the cucumber model were increased when an insignificant sample was eliminated from the dataset. Finally, it is considered that both models can be significantly used to estimate mois- ture content, as gradients of trend line are almost same and intersected. It is considered that the accuracy and preci- sion of the estimating models possibly can be improved, if the models are constructed by using variables with widely distributed variation. The improved models will be utilized as the basis for developing low-priced sensors.
Additional key words : Image processing, Non-destructive analysis, PLS-Regression model, Seedling quality
서 론
박과 작물 중 대표적인 작물인 오이는 수분함량이 매 우 높고 설탕, 포도당, 과당, 마니톨의 형태로 존재하고 있으며, 말산, 미네랄과 비타민이 풍부한 것으로 알려져 있고(Lee 등, 2010), 수박은 칼륨, 인, 마그네슘, 칼슘, 나 트륨, 철분, 과당, 포도당, 자당 등 다량의 무기성분으로
구성되어 있고, 수분함량이 높은 작물이다(Hong 등, 2008). 이러한 풍부한 기능성 물질을 포함하고 있어 오 이와 수박은 꾸준한 소비증가에 따라 재배면적 또한 증 가하고 있다. 소비와 재배면적이 증가함에 따라 묘를 공 급하는 육묘장에서는 단순히 묘를 생산 것이 아니라 수 확량 증대 및 내병성을 가진 우량묘 생산을 통한 경쟁 력 확보가 중요하다(Byun 등, 2012).
작물은 온도나 수분 등 환경스트레스를 받게 되면 생 리적 또는 생화학적으로 장애를 받게 되고 특히 활성산 소종은 산화적 스트레스를 유기시켜 생육과정에서 피해 를 입는 것으로 알려져 있다(Kang 등, 2007). 또한 육묘
*Corresponding author: [email protected]
*Received September 28, 2017; Revised January 13, 2018;
*Accepted January 23, 2018
성을 찾기 어렵기 때문에 최근에는 비파괴적인 방법인 분 광, 형광, 열영상 등 영상을 이용하여 모종의 스트레스를 분석하는 기술이 적용되고 있다. 이러한 비파괴적인 방법 을 적용하여 수행한 연구는 열화상 카메라를 이용하여 시 설온실 내에서 재배되고 있는 작물에 대해 이상온도에 따 른 수분스트레스 측정을 통해 환경조절시스템과 연계하는 방법 연구(Kim 등, 1999), RGB영상을 이용하여 고추의 한발 및 온도스트레스에 관한 연구를 수행하는 등 많은 부분에 영상 기술이 적용되고 있다(Kim 등, 2016). 특히 최근에는 초분광 단파적외선 영상 기술을 이용한 고추의 수분스트레스 측정 기술 개발(Park and Cho, 2014), 상추 종자의 발아 상태를 비파괴로 판별(Ahn 등, 2012), 방울토 마토 내부품질 인자 예측(Kim 등, 2011) 및 미즈나 (Mizuna)의 주요성분 추정(Ryu 등, 2014)등 초분광 영상 기술을 이용한 다양한 기술이 연구되고 있다.
따라서, 본 연구는 모종의 수분 스트레스를 측정하기 위하여 박과의 대표적인 품종인 오이 및 수박에 대해 인공적으로 수분관리 되는 환경에서 모종에 대한 초분광
실험에 사용한 묘는 오이(Cucumis sativus L., Ipchunakhab, Nongwoo bio Co. Ltd, Korea)와 수박 (Citrullus vulgaris, Gumbo, Nongwoo bio Co. Ltd, Korea)로 전남 정읍 육묘장에서 구입하였다. 오이 및 수 박묘는 파종 후 각각 18일 및 27일동안 육묘된 모종을 이용하였고, 영상촬영 시 상호간에 잎이 중첩되지 않도 록 각 45주를 5개의 50공 트레이에 9주씩 배치하였다.
2. 실험 방법
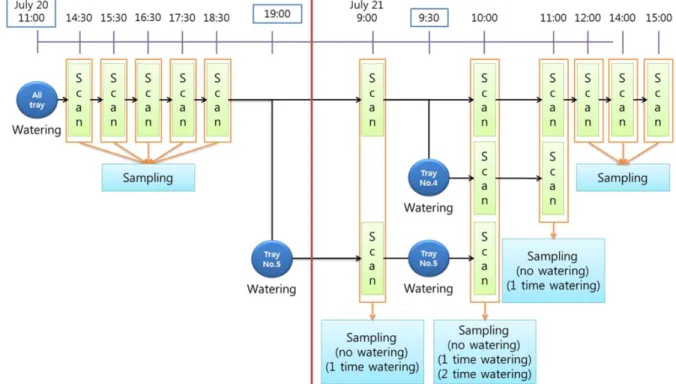
실험은 원광대학교 시험포장 내 플라스틱온실에서 Fig.
1과 같이 2016년 7월 20일(1 day) 11시에서 7월 21일(2 day) 15시까지 이틀 동안 진행하였다. 온실 내부 온도는 데이터 로거(TH Type Micrologger, HortPlus Co., New Zealand)를 이용하여 30분 간격으로 측정하였다.
모든 모종의 근권 수분함량을 균일하게 하기 위하여 실험 초기(7월 20일 11시)에 모든 모종을 대상으로 저면 관수를 약 10분동안 실시하였다. 추가 관수는 7월 20일 19시에 5번 트레이 및 7월 21일 9시 30분에 4, 5번 트
Fig. 1. Schematic diagram of experimental method.
레이를 대상으로 저면관수를 하여 일반적으로 육묘장에 서 1일간 관수하는 횟수인 1회를 기준으로 과다관수와 적정관수의 차를 확인하고자 하였다.
초분광영상은 초점거리가 23mm, 조리개가 F2.3, 시야 각 21.1 인 렌즈(OLE 23 C-Mount, Specim, Finland)를 분광영역이 400-1000nm, 분광 분해능이 2nm인 초분광 카메라(VNIR spectral camera PS, Specim Spectral imaging Ltd., Finland)에 장착하여 지면으로부터 145cm 높이에서 촬영 각도(로테이터의 회전각) 30o로 취득하였 다. 초분광영상은 카메라 자체 노이즈를 줄이기 위한 Dark current image를 측정한 후 자연광 조건에서 7월20 일에 저면관수 약 3시간 30분 후인 14시 30분부터 1시 간 간격으로 모든 트레이를 대상으로 취득하였고, 7월21 일에 저면관수 전후 30분 및 오전10시에서 오후 3시까 지 약 1시간 간격으로 모든 트레이를 대상으로 취득되 었다. 태양광의 변화를 보정하기 위해 트레이 상단에 레 퍼런스 보드(EzyBalance Grey/White Card 30”, White balance 18%, Lastolite Ltd, England)를 배치한 후 전용 프로그램(Spectral DAQ, Specim Spectral Imaging Ltd., Finland)을 이용하여 초분광영상을 취득하였다.
영상 취득 후 각 품종별로 3주씩 샘플링하여 묘의 상 토 및 뿌리를 제외한 엽과 줄기의 생체중을 측정하였으 며 통풍건조기(VS-4048D, Vision Scientific Co. Ltd., Korea)에 60℃로 72시간 동안 건조 후 건물중을 측정하 였다. 측정한 생체중과 건물중을 이용하여 수분함량을 계산하였다.
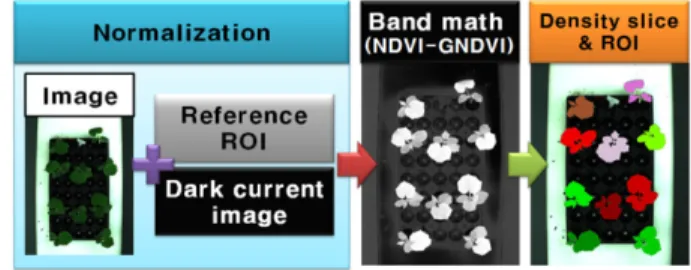
영상처리는 Fig. 3과 같이 전용 소프트웨어(ENVI 5.2, Exelis Visual Information Solution, USA)를 이용하여
노이즈 보정과 광 보정을 하였다. 보정된 이미지에서 묘 와 배경을 분리하기 위해 식(1)과 같은 식생지수(NDVI- GreenNDVI)를 적용하였고 사용된 NIR, Red 및 Green 파장대는 각각 800nm, 670nm, 550nm로 선정(Katsoulas 등, 2016, Francisco 등, 2017)하였다. Density slice를 이 용하여 묘와 배경을 구분하는 이치화값을 산출하였고 Region of Interest(ROI)를 지정하여 각 묘의 반사율을 추출하였다.
(1)
통계처리는 R (software version 3.0.3, R Development Core Team, Vienna, Austria)을 이용하여 작성하였다.
Boxplot으로 정규분포를 확인한 후 영상에서 얻어진 묘 의 평균 반사율과 측정한 수분함량을 이용하여 PLSR 모델을 작성하였고 모델의 타당성은 full-cross validation 을 이용하여 나타내었다. 모델의 성능은 Coefficient of determination(R²), Root Mean Square Error(RMSE), Relative Error(RE)으로 평가하였다.
결과 및 고찰
1. 각 모종의 수분함량 분석
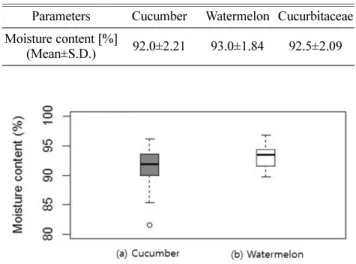
각 모종별 평균 수분함량은 Table 1과 같다. 오이 묘 의 수분함량은 91.6±2.83%, 수박 묘의 수분함량은 93.0±1.84%로 나타났다. 수분함량으로 분석한 결과, 오 이, 수박 묘의 수분함량은 표준편차가 낮아 수분스트레 스에 의한 변화가 적은 것으로 사료된다. Boxplot을 이 용하여 정규분포를 확인한 결과, Fig. 4와 같이 1개의 오이 묘가 정규분포에서 벗어나는 결과를 나타내어 1개 의 오이 모종을 제외한 후 수분함량을 측정한 결과 Table 2와 같이 오이에 대한 정밀도가 높아지는 것으로 조사되어 이를 이용하여 분석하였다.
2. 수분에 따른 반사율 변화
오이와 수박 묘의 수분함량의 변이가 적어 수분 스트 NDVI GreenNDVI– NIR Red–
NIR Red+
--- NIR Green– NIR Green+ --- –
= Fig. 2. Schematic diagram of hyperspectral imagery acquisition
system.
Fig. 3. Schematic diagram of image processing.
3. 반사율을 이용한 수분함량 추정
오이, 수박 묘를 이용한 PLSR분석 결과(Table 3), 오 이 묘 수분함량 추정모델의 정확도(R2)는 0.79, 정밀도 (RMSE, RE)는 1.10%, 1.20%으로 나타났고, 수박 묘 수 분함량 추정모델의 정확도는 0.66, 정밀도(RMSE, RE)는 1.06, 1.14로 나타났다. 박과 대표품종인 오이와 수박묘 를 합산하여 박과작물로 가정하여 수분함량을 추정하였 을 때 모델의 정확도는 0.67, 정밀도(RMSE, RE)는 Table 1. Moisture contents of cucumber, watermelon and
cucrbitaceae seedling.
Parameters Cucumber Watermelon Cucurbitaceae Moisture content [%]
(Mean±S.D.) 91.6±2.83 93.0±1.84 92.3±2.48
Table 2. Moisture contents of cucumber, except 1 sample, water- melon and cucurbitaceae seedlings, except 1 sample
Parameters Cucumber Watermelon Cucurbitaceae Moisture content [%]
(Mean±S.D.) 92.0±2.21 93.0±1.84 92.5±2.09
Fig. 4. Validation test of the cucumber seedlings (a) and the water- melon seedlings (b) moisture content using boxplot analysis.
Fig. 5. Reflectance spectrum graphs of cucumber seedlings (a), watermelon seedlings (b)
Table 3. A result of the improved PLS regression model of cucumber, watermelon and cucurbitaceae seedlings
Variety Cucumber Watermelon Cucurbitaceae Moisture content[%]
(Mean±S.D.) 92.0±2.21 93.0±1.84 92.5±2.09
LV 6 5 5
Cal.
R² 0.81 0.66 0.68
RMSE [%] 0.95 1.06 1.18
RE [%] 1.03 1.14 1.28
Val.
R² 0.63 0.45 0.57
RMSE [%] 1.32 1.35 1.35
RE [%] 1.43 1.45 1.50
1.26%, 1.36%로 나타났다. 분석결과 오이에 대한 추정 모델의 정확도가 가장 높은 것으로 나타났으며, 수박 모 델과 두 모종 합산 모델의 정확도가 비슷한 것으로 나 타났다. 이는 수박의 수분함량 분포가 좁아 모델의 성능 을 낮춘 것으로 판단되며 수박의 수분함량 분포가 넓어 진다면 수박 및 박과 모델의 성능이 향상될 것으로 사 료된다. 또한 각 모델의 정밀도는 비슷하게 나타났으나 수박 모델의 정밀도에 비해 오이, 합산 모델의 밀도도가 낮게 나타났다. 두 품종의 합산 PLSR그래프에서 두 작 물을 분리한 결과, 두 선형회귀선이 비슷한 기울기로 교 차됨으로써 유의한 것으로 나타났다(Fig. 6).
오이, 수박을 합하여 분석한 박과의 PLSR모델은 각
작물별로 분석한 모델의 정확도는 차이가 있었으나 정밀 도는 비슷한 것으로 나타나 추정이 가능한 것으로 판단 된다. 또한 더 많은 샘플과 장시간 스트레스를 가하여 수분함량 분포를 넓혀 분석한다면 모델의 정확도 및 정 밀도를 향상시킬 수 있을 것이며, 추후 개선된 모델을 작성한다면 수분함량계측 센서 개발의 기초자료로 사용 할 수 있을 것으로 판단된다.
적 요
본 연구는 초분광 영상을 이용하여 오이 및 수박과 같 은 박과 묘의 수분함량을 추정하기 위해 수행되었다. 오 Fig. 6. PLS regressive analysis graphs of moisture content.
정모델은 R 0.73, RMSE 1.45%, RE 1.58%의 성능을 보였으며, 수박 묘 수분함량 추정모델은 R2 0.66, RMSE 1.06%, RE 1.14%의 성능을 보였다. 유효범위를 넘어가는 극단치를 제거하여 모델의 성능을 다시 분석한 결과, 오이 모델의 경우 R2 0.79, RMSE 1.10%, RE 1.20으로 상승하였다. 오이와 수박 묘를 함께 분석하여 모델을 제작한 결과, R2 0.67, RMSE 1.26, RE 1.36으 로 분석되었다. 오이 모델이 수박 모델보다 비교적 높은 성능을 보였는데, 이러한 원인은 오이의 수분함량 변이 가 넓게 분포되어 있었기 때문이라고 판단된다. 또한 데 이터셋에서 유효범위를 넘어가는 극단치를 제거한 결과 오이 모델의 정확도 및 정밀도가 상승하였다. 결론적으 로 오이 및 수박 묘 수분함량 추정모델들의 추정선의 기울기 차가 크지 않고, 서로 교차되기 때문에 두 모델 들은 모두 수분함량을 추정하는데 있어서 유의한 것으로 판단된다. 또한 샘플의 변수가 넓게 분포된 변이를 갖는 다면 추정모델의 정확도와 정밀도는 분명 상승할 것이며, 개선된 모델을 이용하면 저가형 센서를 개발하는데 활용 될 수 있을 것으로 사료된다.
추가 주제어 : 묘소질, 부분최소제곱회귀분석, 비파괴분석, 영상처리
사 사
본 연구는 농촌진흥청 공동연구사업(세부과제명: 공정 육묘용 ICT 스마트 변량 관수시스템 연구, 과제번호:
PJ012783)의 지원으로 수행되었음.
Literature cited
Ahn, C.K., B.K. Cho, C.Y. Mo, and M.S. Kim. 2012. Study on development of non-destructive measurement technique for viability of lettuce seed (Lactuca sativa L.) using hyperspec- tral reflectance imaging. J. Kor. Soc. Nondestructive Test- ing, 32 (5):518-528 (in Korean).
Byun, H.J., Y.S. Kim, H.M. Kang, and I.S. Kim. 2012. Phys-
Kang, J.G., C.S. Ryu, S.H. Kim, Y.S. Kang, K.S. Tapash, D.H.
Kang, D.E. Kim, and Y.G. Ku. 2016. Estimating moisture content of cucumber seedling using hyperspectral imagery.
Journal of Biosystems Engineering, 41(3):273-280 (in Korean).
Kang, N.J., M.W. Cho, H.C. Rhee, Y.H. Choi, and Y.C. Um.
2007. Differential responses of antioxidant enzymes on chilling and drought stress in tomato seedlings (Lycopersi- con esculentum L.). Journal of Bio-Environment Control, 16(2):121-129 (in Korean).
Kim, D.Y., B.K. Cho, and Y.S. Kim. 2011. Prediction of inter- nal quality for cherry tomato using hyperspectral reflec- tance imagery. Food Engineering Progress, 15(4):324-331 (in Korean).
Kim, G.Y., K.H. Ryu, and H.Y. Chae. 1999. Analysis of water stress of greenhouse crops using infrared thermography.
Proceedings of the KSAM 1999 Conference, 4(1):244-249 (in Korean).
Kim, H.M., Y.J. Kim, and S.J. Hwang. 2016. Optimum watt- age and installation height of nano-carbon fiber infrared heating lamp for heating energy saving in plug seedling pro- duction greenhouse in winter season. Protected Horticulture and Plant Factory, 25(4): 302-307 (in Korean).
Ko, B.U., J.H. Bae, S.J. Hwang, and H.C. Kim. 2017. Seed- ling qualities of watermelon as affected by different raising seedling period and growth characteristics after planting.
Protected Horticulture and Plant Factory, 26(2):56-63 (in Korean).
Lee, Y.S., H.Y. Seo, G.D. Kim, J.H. Moon, Y.H. Lee, K.J.
Choi, Y. Lee, J.H. Park, and J.H. Kang. 2010. A compari- son of quality and volatile components of two cucumber cultivars grown under organic and conventional conditions.
Kor. J. Food Science and Technology, 42(4):407-413 (in Korean).
Park, E.S. and B.K. Cho. 2014. Development of drought stress measurement method for red pepper leaves using hyper- spectral short wave infrared imaging technique. Protected Horticulture and Plant Factory. 23(1):50-55 (in Korean).
Ryu, C.S., H. Onoyama, M. Suguri, and Y.B. Kim. 2014. Esti- mation of the main properties in potherb mustard (mizuna) using hyperspectral imagery. J. Agriculture & Life Science, 48(6):375-386 (in Korean).