DETECTION OF FLOOD PATTERN AT TONLE SAP AREA USING ALOS PALSAR Jung-Hyun Choi, Nguyen Van Trung, Joong-Sun Won
(1) EARTH SYSTEM SCIENCES, YONSEI UNIVERSITY, 134 SHINCHON-DONG SEODAEMUN-GU, SEOUL 120-749, KOREA
E-MAIL: [email protected]
ABSTRACT
We have analyzed flood pattern over Tonle Sap area during 2007-2009 using ALOS PALSAR. Water level changes have affected on the microwave scattering mechanism in the floodplain. To examine the scattering mechanism in Tonle Sap area, PALSAR quad-polarization data were used. Entropy-alpha distribution shows that the northwest part to the lake (floodplain, wetland) has a dominant double-bounce.
The double-bounce helps to monitor the seasonal changes in the water surface level. ALOS InSAR pairs were used for measuring water level of Tonle Sap floodplain. Interferometric fringe were well observed in the wet season in 2007. Seasonal water level variation of early wet season in 2008 (0.5 meter) was smaller than that in 2007 (2 meter). And we used InSAR coherence map for analysis of flood areas. In contrast to water level variation, the total flooding area in 2008 was much larger than that in 2007. For valuation result of water level variation and flood area using InSAR method, we compared the water level changes measured by InSAR and ground-measured data. According to the ground-measured data, water level variation during 2008 was smaller than 2007 wet season. However, absolute water level of 2007 was lower than that of 2008 by 1-2 m.
KEY WORDS: wetland, water level, double-bounce, interferometry
1. INTRODUCTION
Tonle Sap Lake, along with the Tonle Sap River, forms a unique hydrological system due to monsoon climate.
The reverse flow of the Tonle Sap River during wet season results in intensive flooding that enlarges the lake over vast floodplain and wetland where covered with forests, shrubs, etc. Monitoring the floodplain is essential for water resources, natural disaster management and environmental conservation (Kummu et al., 2006).
Recently, the current climate change model results indicate that climate change will impart on the hydrology of the Mekong River and Tonle Sap Lake (Easthan et al., 2008, Vastile et al., 2010). And existing plans for construction of large-scale hydropower dams in the Mekong upstream are likely to have remarkable impacts in the Tonle Sap, threatening its unique hydrology system (Kummu et al., 2008).
L-band Interferometric SAR has been used to detect relative water level change in wetland. (Alsdorf et al., 2000;
Wdowinski et al., 2008; Lu et al., 2008; Kim et al., 2009).
This application is effective in wetlands and floodplains where woody or herbaceous vegetation emerges above the water surface. The horizontal water surface and the vertical vegetation allow a double-bounce reflection of the transmitted radar signal back to the satellite (Richards et al., 1987). In non-vegetated flooded areas the water surface acts as a mirror scattering away the entire radar signal because of the satellite’s off-nadir transmission angle. In this paper, we focus on examination of flood pattern over Tonle Sap during 2007- 2009 using ALOS PALSAR. To monitor of flood pattern, we observed water level and flood area.
2. DATA PROCESSING
2.1 Study area
The Tonle Sap is one of the largest lakes in Southeast Asia and is the central component of wetland ecosystems in the lower Mekong River basin (Penny, 2006).
The annual recurrence of the monsoon floods, from August to November, is of great importance for farming and economic activity (Kummu et al., 2006). The reserved water is drained from the lake into the Mekong River via the Tonle Sap River. In the wet season while southeast monsoon is active, flooding in the Mekong River causes the reversal flow of the Tonle Sap River northwest (upstream) into the Tonle Sap in which the lake expands more than five-fold to flood the surrounding alluvial plain (Penny, 2006). The unique feature of the reversal flow of the Tonle Sap plays an important role in mitigating extremes of seasonal hydrology associated with the contrasting wet and dry monsoons (Frappart et al., 2006). Between the dry and wet seasons the area of the lake increased from 2500 Km2 up to 15 000 Km2, while the depth of the lake increases from less than 1 m to 6-9.5 m, depending on the year (http: //www.tsbr-ed.org).
2.2 SAR data and processing
We used 28 scenes of PALSAR L-band and 8 scenes of PALSAR PLR data are used. Flooded forests permit
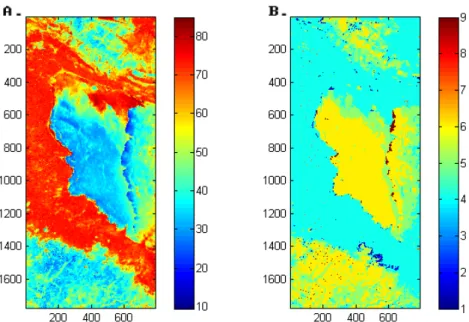
Fig. 1 Result of A) Alpha distribution and B) Alpha/Entropy distribution over northwest area. The Tonle Sap floodplain is double- bounce dominant area.
double-bounce returns of L-band radar pulses, thus allowing InSAR coherence to be maintained for monitoring change in the height of the water surface. To examine the scattering mechanism in Tonle Sap area, PALSAR quad-polarization data were used. And we used InSAR coherence map for analysis of flood areas.
3. RESULT
3.1 Scattering mechanism
Water level changes have affected on the microwave scattering mechanism in the floodplain. In the floodplains at the edge of the lake, double-bounce has increased as water inundated. The double-bounce helps to monitor the seasonal changes in the water surface level. Therefore, classification of scattering model is important.
To classification of scattering model, we used alpha/entropy distribution. The main parameter for identifying the dominant scattering mechanism is alpha value. Generally, double-bounce scattering range is 55˚ ~ 90˚ . Fig. 1A is alpha distribution over northwest area. The red area is double-bounce dominant. Fig.1B shows alpha/entropy classification plain of Tonle Sap area. Blue area (Zone 4: medium entropy multiple scattering) occurs for example in forestry applications, where double bounce mechanisms occur at P and L bands following propagation through a canopy (Cloude et al., 1997).
3.2 Analysis of flood pattern
To measure water level of Tonle Sap, we make InSAR pair. InSAR pairs can be applied to measure water-level change specifically at the northwest edge of the lake.
(Fig.2) Seasonal water level variation of early wet season in 2008 (0.5 meter) was smaller than that in 2007 (2
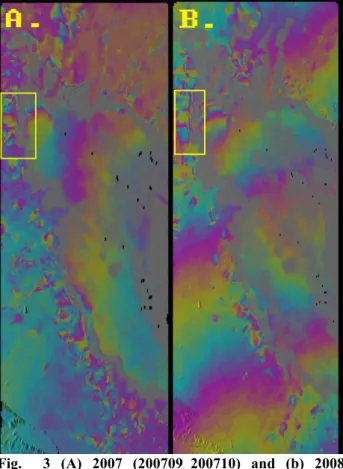
meter). Fig.3A and B is interferogram pair of September to October in 2007 and that in 2008. Compared with Fig.3A and B, fringe pattern is opposite direction. This shows that flood peak point in 2008 was earlier than that in 2007.
We used InSAR coherence map for analysis of flood areas. In contrast to water level variation, the total flooding area in 2008 was much larger than that in 2007.
For valuation result of water level variation and flood area using InSAR method, we compared the water level changes measured by InSAR and ground-measured data (Fig. ) According to the ground-measured data, water level variation during 2008 was smaller than 2007 wet season. However, absolute water level of 2007 was lower than that of 2008 by 1-2 m.
Fig. 2 Interferogram of northwest Tonle Sap area (Google overlay image)
Fig. 3 (A) 2007 (200709_200710) and (b) 2008 (200809_200810) interferometric pairs. Compared with Fig.3A and B, fringe pattern is opposite direction.
This shows that flood peak point in 2008 was earlier than that in 2007.
Fig. 4 Ground-measure data of Tonle Sap. (From www. ffw.mrcmekong.org)
4. CONCLUSION
Flooding of the Tonle Sap is essential to Cambodia, and the Tonle Sap has recently suffered from water famine because of inflow shortage from the Mekong River. For natural disaster management and environmental conservation, it is necessary to monitor continuously. To monitor the flood pattern, we observed water level and flood area at Tonle Sap flood plain. However, PALSAR
InSAR was not able to measure continuous changes of water level because of relatively long data interval.
A follow-up studies is required for measuring continuous water level change in the Tonle Sap. Our plan is that making the flood area map using ALOS PALSAR data, ground-measured data and altimeter data. We anticipate that this research will allow monitoring of flood in Tonle Sap area, especially those lacking ground- measured data.
ACKNOWLEDGMENT
The ALOS PALSAR data were provided by JAXA to the author J.-S. Won as an ALOS PALSAR RAO (PI # 303).
REFERENCES
Alsdorf, D.E., J.M. Melack, T. Dunne, L.A.K. Mertes, L.L. Hess, and L.C. Smith, 2000, Interferometric radar measurements of water level changes on the Amazon flood plain, Nature, 404, pp.174-177.
Cloude, S.R., E.Pottier., 1997, An Entropy Based Classification Scheme for Land Applications of Ploarimetric SAR, IEEE Transactions on Geoscience and Remote Sensing., 35, pp.68-78.
Frappart, F., K.D. Minh, J. L’Hermitte, A. Cazenave, G.
Ramillien, T. Le Toan and N. Mognard-Campbell, 2006, Water volume change in the lower Mekong from satellite altimetry and imagery data, Geophysical Journal International, 167, pp.570-584.
Kim, J.W., Z. Lu., H. Lee., C.J. Shum., C.M. Swarzenski., T.W. Doyle., S.H.Beak., 2009, Intergrated analysis of PLASAR/Radarsat-1 InSAR and ENVISAT altimeter data for mapping of absolute water level Changes in Louisiana wetlands., Remote Sensing of Environment., 113, pp.2356-2365.
Kummu, M., J. Sarkkula, J. Koponen, and J. Nikula, 2006, Ecosystem management of the Tonle Sap Lake:
An integrated modelling approach, 22, pp.497-19.
Lu, Z., and O. Kwoun, 2008, Radarsat-1 and ERS InSAR analysis over southeastern coastal Louisiana:
implications for mapping water level changes beneath swamp forests. IEEE Transactions on Geoscience and Remote Sensing., 46, pp.2167-2184
Penny, D., 2006, The Holocene history and development of the Tonle Sap, Cambodia., Quaternary Science Review, 25, pp.310-322.
Richards, J. A., Woodgate, P. W., Skidmore, A. K., 1987.
An explanation of enhanced radar backscattering from flooded forests., International Journal of Remote Sensing, 8,pp. 1093−1100.
TONLE SAP BIOSPHERE RESERVE, 2008, URL: http:
//www.tsbr-ed.org/.
Wdowinski, S., S.W. Kim, F. Amelung,, T. Dixon, F.
Miralles-Wilhelm, and R. Sonenshein, 2008, Space- based detection of wetlands surface water level changes from L-band SAR interferometry, Remote Sensing of Environment.,112, pp.681-696.