Introduction
Spinal cord injury (SCI) is one of the most preva- lent causes of long-term disability in the United States (US) with approximately 273,000 total cases and about 12,000 new cases each year (National Spinal Cord Injury Statistical, 2013). The spinal cord is composed of a bundle of neural pathways. After injury, nervous tissues and motor neurons are dam- aged and the signals can be disrupted or disconnected. The neurological deficit occurring after injury can be classified into tetra or paraplegia de- pending on the level of injury and body parts involved. Complete neurological recovery has been reported in only a few patients with SCI (National Spinal Cord Injury Statistical, 2013). Since there is no cure available at this time, the management of
SCI presents a large financial burden on the United States economy (Midha et al, 1987). The average cost of care and treatment of patients with SCI var- ies depending on the severity of injury. The annual social cost for management of SCI in the US has been estimated at $9.7 billion (Berkowitz, 1998). The use of non-invasive measurements are critical to re- duce social cost by enhancing our understanding of the pathophysiology of SCI and examining the effi- cacy of physical therapies that are aimed to minimize secondary injuries or to enhance recovery.
The Concept of Primary and Secondary Damage
Spinal cord damage is characterized by the pri- Corresponding author: Woo-taek Lim [email protected]
Muscular Adaptations and Novel Magnetic Resonance Characterizations of Spinal Cord Injury
Woo-taek Lim1,2, PhD, PT
1Dept. of Physical Therapy, College of Health and Welfare, Woosong University
2Dept. of Sports Rehabilitation, College of Health and Welfare, Woosong University
Abstract
1)The spinal cord is highly complex, consisting of a specialized neural network that comprised both neuronal and non-neuronal cells. Any kind of injury and/or insult to the spinal cord leads to a series of damaging events resulting in motor and/or sensory deficits below the level of injury. As a result, muscle paralysis (or paresis) leading to muscle atrophy or shrinking of the muscle along with changes in muscle fiber type, and contractile properties have been observed. Traditionally, histology had been used as a gold standard to characterize spinal cord injury (SCI)-induced adaptation in spinal cord and skeletal muscle.
However, histology measurements is invasive and cannot be used for longitudinal analysis. Therefore, the use of conventional magnetic resonance imaging (MRI) is promoted to be used as an alternative non-invasive method, which allows the repeated measurements over time and secures the safety against radiation by using radiofrequency pulse. Currently, many of pathological changes and adaptations occurring after SCI can be measured by MRI methods, specifically 3-dimensional MRI with the advanced diffusion tensor imaging technique. Both techniques have shown to be sensitive in measuring morphological and structural changes in skeletal muscle and the spinal cord.
Key Words: Diffusion tensor imaging; Magnetic resonance imaging; Muscular adaptation; Spinal cord injury.
mary mechanical injury and subsequent secondary injury at the cellular and molecular levels. After the first mechanical injury to the spinal cord, the secon- dary reactions induce resultant damage at the pri- mary region as well as at the regions above and be- low injury. The concepts of these subsequent changes, also referred to as secondary damage, were first speculated by Allen (1911, 1914) and confirmed by numerous experiments (Fehlings and Sekhon, 2000; Mortazavi et al, 2015; Peterson and Anderson, 2014; Tator and Fehlings, 1991; Tzekou and Fehlings, 2014).
First, disruption and destruction of nerve and tis- sue occur at the site of the primary lesion and these deficits mostly result from the initial mechanical damage (Ronsyn et al, 2008). Additional physical in- jury results from compression induced by fractured bone, ruptured discs, or invasive external material.
Generally, there are four different types of primary injuries: (a) initial mechanical impact with persistent compression, (b) initial mechanical impact with tran- sient compression, (c) spinal cord distraction, (d) spinal cord transection or laceration (Dumont et al, 2001). The first two types (type a and b) are most common in patients with SCI (Sekhon and Fehlings, 2001).
After the first mechanically induced physical dam- age, secondary pathophysiological damage is caused by inflammation, hemorrhaging, and edema. It is
known that the secondary mechanisms are highly related to each other (Figure 1). Secondary damage exacerbates the structural damage of spinal cord over time and neurological deficits caused by secon- dary damage lead to paralysis (or paresis) of muscles. Thus, the magnitude and extent of initial mechanical injury have direct implications on skeletal muscle and locomotor function. The secondary mech- anisms of injury are particularly important in clinical settings and appropriate responses can either prevent or minimize the additional nervous tissue damage and potentially save residual intact tissue.
Characterizing the injury to the spinal cord plays a pivotal role in understanding of the muscular adaptation.
Muscular Adaptations After SCI
Muscle size
The disrupted signal from efferent pathways after SCI results in muscle paralysis and subsequent mus- cle atrophy. Skeletal muscle atrophy is caused by a disturbance in the balance of protein synthesis and degradation, with the latter being more prominent in SCI. Muscle atrophy is expressed by a decrease in muscle size, mass, fiber size, and/or cross-sectional area (CSA) (Dudley et al, 1999; Engstrom et al, 1991; Mahoney et al, 2005; Martin et al, 1992;
Rochester et al, 1995). The rate or extent of muscle atrophy following SCI has been investigated in sev- eral pre-clinical and clinical studies. Within a week of moderate contusion injury in rats, the muscle weight of the soleus (Sol), medial gastrocnemius and lateral gastrocnemius was reduced by 22∼26%, whereas the extensor digitorum longus (EDL) muscle weight was not affected (Hutchinson et al, 2001).
Similarly in severe contusion injury, significant atro- phy was observed only observed in Sol (27.2%) and triceps surae (21.8%) muscles whereas EDL was rel- atively preserved (10.9%) even after 3 weeks post-injury (Ye et al, 2013). The pre-clinical studies Figure 1. Interrelationship of pathophysiologic
processes.
that examined muscle wasting after injury using magnetic resonance imaging (MRI), reported the similar findings. In a moderate contusion injury, the maximum muscle CSA as measured by MRI, was observed to decrease by 16.6% in triceps surae, 11.7% in tibialis anterior (TA), and 10.4% in EDL after a week of injury (Liu et al, 2008). Similar trends were observed in severe contusion injury (Ye et al, 2013). One week post-injury, triceps surae muscle (24.9%) showed more atrophy than TA mus- cle (20.6%). There was no recovery in triceps surae even after 3 weeks of the injury and the substantial atrophy (22.1%) was observed. In animals, more atrophy has been observed in posterior compartment (Sol, gastrocnemius muscle), compared to anterior compartment muscles (TA and EDL muscle) (Lieber et al, 1986; Midrio et al, 1988; Talmadge et al, 2002b). Therefore, muscle wasting cannot be attrib- uted to decline in neuromuscular activity alone, but it is also influenced by muscle loading conditions (Baker and Matsumoto, 1988; Pachter and Eberstein, 1984). In humans, similar pattern of muscle wasting has been observed after injury. Significant atrophy (12∼24%) was observed in the Sol and gastro- cnemius muscles whereas TA muscle was relatively preserved even after 24 weeks of injury (Castro et al, 1999a). Similarly, in a study on SCI individuals using wheelchair, the CSA of medial gastrocnemius, Sol, and TA was found to decrease by 39%, 28%, and 20%, respectively 13 months (±9.0 months) post-injury (Shah et al, 2006). Overall, atrophy has been more pronounced in antigravity muscles (Gordon and Mao, 1994; Gordon and Pattullo, 1993;
Roy et al, 1991). These muscles have more pro- portions of fatigue resistant slow muscle fibers, which are largely responsible for maintaining posture weight bearing.
Fiber type
Muscle fiber type conversion from fast to slow is known in skeletal muscle following SCI. The muscle fiber types can be described using immunohisto-
logical, physiological, morphological, or biochemical characteristics. Currently, myosin heavy chain (MHC) isoform identification is the most common method for muscle fiber typing. MHC isoforms can be identified by immunohistochemical analysis using anti-MHC monoclonal antibodies or by sodium dodecyl sulfate polyacrylamide gel electrophoresis. In a MHC isoform identification, three major isoforms have been ex- pressed in both humans (I, IIa, and IIx) and small mammals (I, IIa, and IIb). Type I fibers are slow twitch oxidative fibers that have higher blood capil- lary density, oxidative capacity, and a large number of mitochondria (Armstrong and Phelps, 1984; Brown et al, 1976; Jänkälä et al, 1997; Pette and Staron, 2000; Simoneau and Bouchard, 1989; Stein and Padykula, 1962). Thus, slow muscle fibers are more suitable for aerobic or endurance activities that de- mand sustained production of adenosine triphosphate.
In contrast, type II fibers are the fast twitch fibers identified by fast concentration time and a low re- sistance to fatigue due to higher concentrations of glycogen, and glycolytic enzymes (Armstrong and Phelps, 1984; Brown et al, 1976; Jänkälä et al, 1997;
Pette and Staron, 2000; Simoneau and Bouchard, 1989; Stein and Padykula, 1962). Type IIb fibers are relatively high in force production and have lower endurance than type IIa.
In humans, a significant decrease in type I muscle fibers and a relative increase in the proportion of type IIb, IIx, and/or mixed muscle fiber have been observed following SCI (Burnham et al, 1997; Castro et al, 1999b; Lotta et al, 1991; Scelsi et al, 1982). A similar shift in fiber type expression was also ob- served in animals after complete SCI. In moderate contusion SCI, the conversion of muscle type was comparatively less (Hutchinson et al, 2001; Stevens et al, 2006). Interestingly, most transformation was shown to occur at the early stages (1∼3 weeks) and it returned back to baseline or close to control val- ues in chronic stage. Overall, it is demonstrated that muscle paralysis following injury leads to shift in muscle fiber type from slower fatigable to faster fa-
tigable type and this shift is more pronounced in the Sol muscle due to higher proportion of slow muscle fibers. This conversion of muscle fibers has been linked to change in other muscle characteristics such as contractile properties (Burnham et al, 1997;
Hopman et al, 1994).
Contractile properties
The adaptation of contractile properties such as time to peak tension (msec), half-relaxation time (msec), fusion frequency (㎐), and specific tension (N/㎠) is commonly observed in SCI. As mentioned above, the muscle fiber type composition moves to- ward fast following SCI. The fast muscle fiber type is characterized by a shorter time to peak tension and shorter half relation time compared to slow muscle. In animal models of transection SCI, slow muscles like Sol show a significantly decreased time to peak tension (50% compared to normal muscle) and increased fusion frequency. In contrast to Sol muscle, no change in time to peak tension and fusion frequency of the EDL muscle was observed (Lieber et al, 1986). Additionally, a significant decrease in maximum tetanic force of Sol muscle was also ob- served at an early stage (between 2 and 3 weeks post injury) following moderate contusion injury (Hutchinson et al, 2001; Singh et al, 2011; Stevens et al, 2006), and severe contusion injury (Ye et al, 2013).
In contrast to time to peak tension, half-relaxation time, and absolute peak tetanic force, the results re- ported on specific force vary after SCI. In transected SCI rats, the normalized peak tetanic force (force per unit area) in Sol muscle was increased in SCI ani- mal model with decreasing muscle CSA (Lieber et al, 1986). Some other studies have reported no difference in normalized peak tetanic force in severe contusion SCI (Ye et al, 2013) or decreased normalized peak tetanic force in moderate contusion SCI (Hutchinson et al, 2001). Potential confounding factors like fat proportion (Elder et al, 2004; Gorgey and Dudley, 2007; Gorgey and Dudley, 2008) have to be consid- ered when interpreting the tetanic force after SCI.
The adaptations in the muscle properties after SCI influence muscle fatigue also. In complete transection SCI, the fatigue resistance of Sol muscle has been shown to decrease by 25% after 3 months of injury and 45% after 6 months post-injury in rats (Talmadge et al, 2002b). Generally the fast muscles contain low proportion of oxidative type I fibers that are considered to be more fatigue resistant than type II fibers (Enoka, 1988). However, decline in slow ox- idative fibers after injury is not the only reason suggested for reduced fatigue resistance (Otis et al, 2004). The impairment of adenosine triphosphate synthesis capacity, neuromuscular junction, and ex- citation-contraction apparatus are suggested as other possible causes (Baldwin et al, 1984; Favero, 1999;
Fitts, 1994; Prakash et al, 1995; Talmadge et al, 2002a; Williams and Klug, 1995).
Magnetic Resonance Imaging (MRI)
At present, extensive research is being done to develop effective treatment interventions for SCI.
Therefore, the identification and development of non-invasive and sensitive outcome measures that are specific to relevant therapeutic targets, is very important. The muscle biopsies, which are widely used in clinical setting, are invasive; limiting their use for longitudinal measurements. In addition, a small piece of muscle collected by a biopsy needle may not be representative of disease status because of the inhomogeneity of muscle involvement follow- ing injury (Halkjaer-Kristensen and Ingemann- Hansen, 1981). The tissue properties can be different based on the regions (i.e., distal part vs. proximal part or deep vs. superficial). In contrast, MRI is an excellent non-invasive tool that allows longitudinal evaluation of the morphometric and structural changes in spinal cord and skeletal muscle. In pre- vious studies, in vivo conventional MRI has been used to show the exercise-induced recovery in mus- cle (Liu et al, 2008) and the recovery of spinal cord
(Narayana et al, 2004) in rats models of SCI.
Furthermore, throughout the recent work on animal models of SCI and humans, MRI has been used as a key methodological tool to characterize lower ex- tremity skeletal muscle and spinal cord adaptations.
Although various medical imaging tools like such as X-ray and computed tomography exist for identi- fication of the progress and providing the potential way of intervention, these are basically based on ionizing radiation. So these methods cannot be free from radiation risk. However, MRI techniques se- cures the safety against radiation by using natural magnetic properties from hydrogen.
Basics of MRI
Hydrogen is the most abundant atom in the body (approximately 60% of body) and it has odd numbers of protons as charged nuclei. The water has two hydrogen atoms and each hydrogen has one nucleus (since the hydrogen nucleus does not have a neutron, it is also considered a proton), which has a positive charge, and one electron which has a negative charge. This unpaired proton generates a magnetic field while it is spinning. In the paired protons with even number of protons, magnetic fields induced by protons cancel each other out and then no net mag- netic field is left. So, every proton, which has an odd number of protons, can have its own magnetic field. However, without external magnetic field, every proton spins randomly around its own axis with a small magnetic field and in this case, the net mag- netization is zero. In the presence of an external magnetic field, the axes of protons are lined up based on the axis of the external magnetic field, with the protons spinning around their own axes and precessing at the axis of the external magnetic field.
The rate of precession is decided by the strength of the external magnetic field. This is expressed using the Larmor equation as follows: ω=γ×B0, where ω=angular precessional frequency of proton, γ=gyromagnetic ratio, and B0=external magnetic field. The gyromagnetic ra- tio is a constant with almost 42.6 million of cycles
per second per tesla (42.6 ㎒/T). Since longitudinal magnetization placed in the external magnetic field cannot be read, a radio frequency (RF) pulse is used as an excitation pulse to change the longitudinal magnetization to transverse magnetization. When the frequency of RF is matched with the precession fre- quency, resonance occurs and then transverse mag- netization is created. After an RF pulse is applied, the longitudinal magnetization of protons flip into the transverse plane and produce transverse magnetization.
When the RF pulse is turned off, flipped protons re- turn back to the axis of the external magnetic field and give the excess energy back to the surrounding lattice. The term relaxation refers to this return to the equilibrium state (or the lowest energy state).
The signals in MRI result from the energy absorbed by protons while resonating. In MRI, there are two types of relaxation time. The time to regain longi- tudinal magnetization is called the T1 relaxation time (also called spin-lattice relaxation time), which is taken by spins to release energy obtained from RF pulse to their surroundings. The time of decay of transverse magnetization is called the T2 relaxation time. The spins, which were initially in phase, begin to get out of phase with each other due to “spin- spin interactions (internal inhomogeneities)” and
“external magnetic field inhomogeneity”. Because of these two processes, transverse magnetization is rap- idly decreased. Each tissue in the body has different inherent relaxation times. Differences in the inherent relaxation times of tissues (e.g., between fat and muscle) result in magnetic resonance (MR) contrast and this contrast can be adjusted by two major pa- rameters (repetition time of RF: TR, echo time: TE).
Generally, short TR and short TE is used in longi- tudinal relaxation time (T1) weighted images and long TR and long TE is used in transverse relaxa- tion time (T2) weighted images to maximize contrast.
Longitudinal relaxation time (T1) weighted images
Morphological changes in muscle and spinal cord
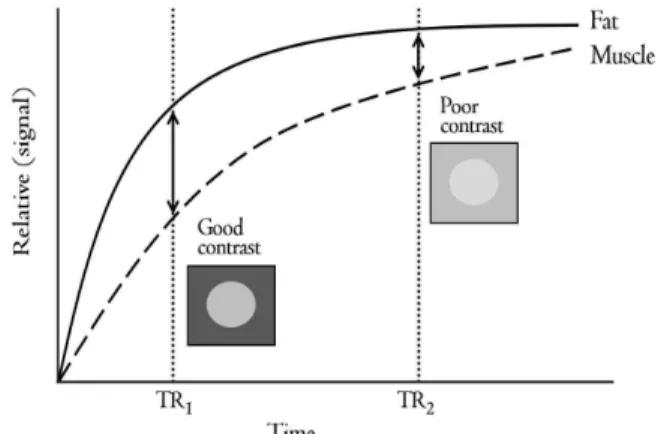
after SCI are well characterized by T1 weighted images. In the human body, T1 of white matter, gray matter, and cerebrospinal fluid (CSF) was 510 msec, 760 msec, and 2650 msec at 1.5 T, respectively (Hashemi et al, 2004). In muscle, the T1 of fat was 100∼150 msec approximately, but it is 3 seconds ap- proximately in pure water. The tissue that has a longer T1 returns relatively slowly to the longitudinal magnetization than the tissue that has a shorter T1. T1 from two different tissues are described in Figure 2. A shorter TR (TR1) is enough to show the differ- ence in contrast in MR image, but the contrast is not appropriate to differentiate two tissues in a lon- ger TR (TR2). Thus, in T1 weighted image, the in- herent T1 recovery property of each tissue plays an important role in the final contrast in MR image and a shorter TR enhances the T1 contrast between two tissues. Generally, the contrast in MR image between muscle and fat is well distinguished in T1 weighted images (Reimers and Finkenstaedt, 1997).
Transverse relaxation time (T2) weighted images
T2 is influenced by the rate of dephasing of proton spins. If the rate of dephasing is slow, the tissue has longer T2 properties. The dephasing of water in the human body is slower compared to other solid or fat structures and it has longer T2 (Figure 3). So, the
order of T2 is “muscle<fat<fluid” in skeletal muscle.
In spinal cord, CSF (180 msec at 1.5 T) has longer T2 than white matter (67 msec) and gray matter (77 msec) (Hashemi et al, 2004). In T2 weighted images, too short TE does not provide enough contrast be- tween two tissues. Appropriate decay of transverse magnetization will be ideal to differentiate different tissues or to diagnose the pathologic changes follow- ing disease. Thus, the inherent T2 decay property of each tissue plays an important role in the final con- trast in the MR image and a longer TE enhances the T2 contrast between two tissues. Currently, T2
weighted images have been widely used to measure pathological changes like inflammation occurring after injury.
Diffusion tensor imaging (DTI)
T1 and T2 weighted images have been the most common methods in MRI techniques. However, cer- tain tissues like myelin have a short T2 relaxation time which is not detectable using conventional MRI (Henkelman et al, 2001; Kozlowski et al, 2008).
Additionally, conventional MRI has not been seen to be sensitive to structural changes in the spinal cord (Ford et al, 1994). A more advanced technique, DTI measures structural changes by detecting molecular diffusion in tissue. Water diffusion in tissues can be restricted by architectural obstacles such as axons,
Figure 2. The example of T1 relaxation curves in two different tissues (TR1: first repetition time, TR2: second repetiton time).
Figure 3. The example of T2 relaxation curves in two different tissues (TE1: first echo time, TE2: second echo time).
fibers, and membranes (Figure 4). Thus, the dif- fusion of molecules shows the structure of tissue in- directly and further can reveal the severity of injury in SCI because disrupted or disconnected spinal tracts can be detected. Early DTI studies were im- plemented in the brain and this technology has been expanded to various tissues including spinal cord (De Smet et al, 2014; Kelley et al, 2014; Le Bihan et al, 1986; Moseley et al, 1990; Murphy et al, 2014). Since the spinal cord includes multiple longitudinal tracks and each track is closely related with certain func- tions, DTI can provide a good measure to character- ize the spinal cord following injury and estimate the progression of injury. The relationship between DTI metrics and structural damage in axon, myelin, and white matter has been reported in a number of stud- ies (Ellingson et al, 2008; Kozlowski et al, 2008;
Song et al, 2002; Song et al, 2003; Sun et al, 2006).
Conclusion
SCI leads to neurologic deficits and loss of loco-
motor function with severe muscle atrophy.
Neurologic deficits including pathophysiologic changes in muscle have been widely studied in both animal models of SCI and humans. However, muscle biopsy, which has been widely used in clinics, is limited be- cause it is invasive and only allows a single time measurement. In addition, a small piece of tissue col- lected by a biopsy needle does not represent the characteristics of whole muscle or spinal cord be- cause of the inhomogeneity within the sample. In comparison to biopsy, MRI allows for a longitudinal evaluation of the morphological and structural changes of the spinal cord and muscles. Longitudinal outcome measures are very important for physical therapists to understand a series of adaptations in spinal cord and muscle in response to physical therapy. Previously, only ex vivo conventional MRI has successfully shown the pathophysiologic changes and exercise-induced recovery, but 3-dimensional MRI and advanced DTI currently plays an important role in detection of morphological and structural changes of muscle and spinal cord even in vivo.
Additionally, the safety, feasibility, and effectiveness of MR measures strongly support the potential for translation of numerous pre-clinical researches for clinical application in physical therapy.
References
Allen AR. Surgery of experimental lesion of spinal cord equivalent to crush injury of fracture dis- location of spinal column: A preliminary report.
JAMA. 1911;57(11):878-880.
Allen AR. Remarks on the histopathological changes in the spinal cord due to impact. An ex- perimental study. J Nerv Ment Dis. 1914;41(3):
141-147.
Armstrong RB, Phelps RO. Muscle fiber type compo- sition of the rat hindlimb. Am J Anat. 1984;171 (3):259-272.
Baker JH, Matsumoto DE. Adaptation of skeletal Figure 4. Isotropic and anisotropy diffusion.
The diffusion of water molecules can be constrained by fiber bundles and white matter tracks.
muscle to immobilization in a shortened position.
Muscle Nerve. 1988;11(3):231-244.
Baldwin KM, Roy RR, Sacks RD, et al. Relative in- dependence of metabolic enzymes and neuro- muscular activity. J Appl Physiol Respir Environ Exerc Physiol. 1984;56(6):1602-1607.
Berkowitz M. Spinal cord injury: An analysis of medical and social costs. New York, Demos Medical Publishing, 1998:1.
Brown MD, Cotter MA, Hudlická O, et al. The ef- fects of different patterns of muscle activity on capillary density, mechanical properties and structure of slow and fast rabbit muscles.
Pflugers Arch. 1976;361(3):241-250.
Burnham R, Martin T, Stein R, et al. Skeletal muscle fibre type transformation following spinal cord injury. Spinal Cord. 1997;35(2):86-91.
Castro MJ, Apple DF Jr, Hillegass EA, et al.
Influence of complete spinal cord injury on skel- etal muscle cross-sectional area within the first 6 months of injury. Eur J Appl Physiol Occup Physiol. 1999a;80(4):373-378.
Castro MJ, Apple DF Jr, Staron RS, et al. Influence of complete spinal cord injury on skeletal muscle within 6 mo of injury. J Appl Physiol. 1999b;86 (1):350-358.
De Smet E, Vanhoenacker FM, Parizel PM.
Traumatic myelopathy: Current concepts in imaging. Semin Musculoskelet Radiol. 2014;18(3):
318-331. http://dx.doi.org/10.1055/s-0034-1375573 Dudley GA, Castro MJ, Rogers S, et al. A simple
means of increasing muscle size after spinal cord injury: A pilot study. Eur J Appl Physiol Occup Physiol. 1999;80(4):394-396.
Dumont RJ, Okonkwo DO, Verma S, et al. Acute spinal cord injury, part I: Pathophysiologic mechanisms. Clin Neuropharmacol. 2001;24(5):
254-264.
Elder CP, Apple DF, Bickel CS, et al. Intramuscular fat and glucose tolerance after spinal cord in- jury-a cross-sectional study. Spinal Cord. 2004;
42(12):711-716.
Ellingson BM, Kurpad SN, Schmit BD. Functional correlates of diffusion tensor imaging in spinal cord injury. Biomed Sci Instrum. 2008;44:28-33.
Engstrom CM, Loeb GE, Reid JG, et al.
Morphometry of the human thigh muscles. A comparison between anatomical sections and computer tomographic and magnetic resonance images. J Anat. 1991;176:139-156.
Enoka RM. Muscle strength and its development.
New perspectives. Sports Med. 1988;6(3):146-168.
Favero TG. Sarcoplasmic reticulum Ca (2+) release and muscle fatigue. J Appl Physiol. 1999;87(2):
471-483.
Fehlings MG, Sekhon L. Cellular, Ionic and Biomolecular Mechanisms of the Injury Process in Contemporary Management of Spinal Cord Injury: From impact to rehabilitation. Chicago, IL, American Association of Neurological Surgeons, 2000:33.
Fitts RH. Cellular mechanisms of muscle fatigue.
Physiol Rev. 1994;74(1):49-94.
Ford JC, Hackney DB, Alsop DC, et al. MRI charac- terization of diffusion coefficients in a rat spinal cord injury model. Magn Reson Med. 1994;31(5):
488-494.
Gordon T, Mao J. Muscle atrophy and procedures for training after spinal cord injury. Phys Ther.
1994;74(1):50-60.
Gordon T, Pattullo MC. Plasticity of muscle fiber and motor unit types. Exerc Sport Sci Rev.
1993;21:331-362.
Gorgey AS, Dudley GA. Skeletal muscle atrophy and increased intramuscular fat after incomplete spi- nal cord injury. Spinal Cord. 2007;45(4):304-309.
Gorgey AS, Dudley GA. Spasticity may defend skel- etal muscle size and composition after in- complete spinal cord injury. Spinal Cord. 2008;46 (2):96-102.
Halkjaer-Kristensen J, Ingemann-Hansen T. Variations in single fibre areas and fibre composition in needle biopsies from the human quadriceps muscle. Scand J Clin Lab Invest. 1981;41(4):
391-395.
Hashemi RH, Bradley WG, Lisanti CJ. MRI: The basics. 2nd ed. Philadelphia, Lippincott Williams
& Wilkins, 2004:63.
Henkelman RM, Stanisz GJ, Graham SJ. Magnetization transfer in MRI: A review. NMR Biomed. 2001;
14(2):57-64.
Hopman MT, Nommensen E, van Asten WN, et al.
Properties of the venous vascular system in the lower extremities of individuals with paraplegia.
Paraplegia. 1994;32(12):810-816.
Hutchinson KJ, Linderman JK, Basso DM. Skeletal muscle adaptations following spinal cord con- tusion injury in rat and the relationship to loco- motor function: A time course study. J Neurotrauma. 2001;18(10):1075-1089.
Jänkälä H, Harjola VP, Petersen NE, et al. Myosin heavy chain mRNA transform to faster isoforms in immobilized skeletal muscle: A quantitative PCR study. Journal of Appl Physiol. 1997;82(3):
977-982.
Kelley BJ, Harel NY, Kim CY, et al. Diffusion tensor imaging as a predictor of locomotor function af- ter experimental spinal cord injury and recovery.
J Neurotrauma. 2014;31(15):1362-1373. http://dx.
doi.org/10.1089/neu.2013.3238
Kozlowski P, Raj D, Liu J, et al. Characterizing white matter damage in rat spinal cord with quantitative MRI and histology. J Neurotrauma.
2008;25(6):653-676. http://dx.doi.org/10.1089/neu.
2007.0462
Le Bihan D, Breton E, Lallemand D, et al. MR imaging of intravoxel incoherent motions:
Application to diffusion and perfusion in neuro- logic disorders. Radiology. 1986;161(2):401-407.
Lieber RL, Johansson CB, Vahlsing HL, et al.
Long-term effects of spinal cord transection on fast and slow rat skeletal muscle. I. Contractile properties. Exp Neurol. 1986;91(3):423-434.
Liu M, Bose P, Walter GA, et al. A longitudinal study of skeletal muscle following spinal cord in- jury and locomotor training. Spinal cord. 2008;
46(7):488-493. http://dx.doi.org/10.1038/sj.sc.3102169 Lotta S, Scelsi R, Alfonsi E, et al. Morphometric and neurophysiological analysis of skeletal muscle in paraplegic patients with traumatic cord lesion.
Paraplegia. 1991;29(4):247-252.
Mahoney ET, Bickel CS, Elder C, et al. Changes in skeletal muscle size and glucose tolerance with electrically stimulated resistance training in sub- jects with chronic spinal cord injury. Arch Phys Med Rehabil. 2005;86(7):1502-1504.
Martin TP, Stein RB, Hoeppner PH, et al. Influence of electrical stimulation on the morphological and metabolic properties of paralyzed muscle. J Appl Physiol. 1992;72(4):1401-1406.
Midha R, Fehlings MG, Tator CH, et al. Assessment of spinal cord injury by counting corticospinal and rubrospinal neurons. Brain Res. 1987;410(2):
299-308.
Midrio M, Danieli Betto D, Betto R, et al.
Cordotomy-denervation interactions on con- tractile and myofibrillar properties of fast and slow muscles in the rat. Exp Neurol. 1988;
100(1):216-236.
Mortazavi MM, Verma K, Harmon OA, et al. The microanatomy of spinal cord injury: A review.
Clin Anat. 2015;28(1):27-36. http://dx.doi.org/
10.1002/ca.22432
Moseley ME, Cohen Y, Kucharczyk J, et al.
Diffusion-weighted MR imaging of anisotropic water diffusion in cat central nervous system.
Radiology. 1990;176(2):439-445.
Murphy RKJ, Gamble P, Sun P, et al. 144 predicting recovery after a spinal cord injury: The role of diffusion basis spectrum imaging as a biomarker of corticospinal tract integrity. Neurosurgery.
2014;61:207.
Narayana PA, Grill RJ, Chacko T, et al. Endogenous recovery of injured spinal cord: Longitudinal in vivo magnetic resonance imaging. J Neurosci Res. 2004;78(5):749-759.
National Spinal Cord Injury Statistical Center. Spinal cord injury facts and figures at a glance. J
Spinal Cord Med. 2013;36(1):1-2.
Otis JS, Roy RR, Edgerton VR, et al. Adaptations in metabolic capacity of rat soleus after paralysis.
J Appl Physiol. 2004;96(2):584-596.
Pachter BR, Eberstein A. Neuromuscular plasticity following limb immobilization. J Neurocytol.
1984;13(6):1013-1025.
Peterson SL, Anderson AJ. Complement and spinal cord injury: Traditional and non-traditional as- pects of complement cascade function in the in- jured spinal cord microenvironment. Exp Neurol.
2014;258:35-47. http://dx.doi.org/10.1016/j.expneurol.
2014.04.028
Pette D, Staron RS. Myosin isoforms, muscle fiber types, and transitions. Microsc Res Tech. 2000;
50(6):500-509.
Prakash YS, Zhan WZ, Miyata H, et al. Adaptations of diaphragm neuromuscular junction following inactivity. Acta Anat (Basel). 1995;154(2):
147-161.
Reimers CD, Finkenstaedt M. Muscle imaging in in- flammatory myopathies. Curr Opin Rheumatol.
1997;9(6):475-485.
Rochester L, Chandler CS, Johnson MA, et al.
Influence of electrical stimulation of the tibialis anterior muscle in paraplegic subjects. 1.
Contractile properties. Paraplegia. 1995;33(8):
437-449.
Ronsyn MW, Berneman ZN, Van Tendeloo VF, et al.
Can cell therapy heal a spinal cord injury?
Spinal Cord. 2008;46(8):532-539. http://dx.doi.
org/10.1038/sc.2008.13
Roy RR, Baldwin KM, Edgerton VR. The plasticity of skeletal muscle: Effects of neuromuscular activity. Exerc Sport Sci Rev. 1991;19:269-312.
Scelsi R, Marchetti C, Poggi P, et al. Muscle fiber type morphology and distribution in paraplegic patients with traumatic cord lesion. Acta Neuropathol. 1982;57(4):243-248.
Sekhon LH, Fehlings MG. Epidemiology, demo- graphics, and pathophysiology of acute spinal cord injury. Spine (Phila Pa 1976). 2001;26
(24 Suppl):S2-S12.
Shah PK, Stevens JE, Gregory CM, et al. Lower-ex- tremity muscle cross-sectional area after in- complete spinal cord injury. Arch Phys Med Rehabil. 2006;87(6):772-778.
Simoneau JA, Bouchard C. Human variation in skel- etal muscle fiber-type proportion and enzyme activities. Am J Physiol. 1989;257(4 Pt 1):
E567-E572.
Singh A, Murray M, Houle JD. A training paradigm to enhance motor recovery in contused rats:
Effects of staircase training. Neurorehabil Neural Repair. 2011;25(1):24-34. http://dx.doi.org/10.1177/
1545968310378510
Song SK, Sun SW, Ju WK, et al. Diffusion tensor imaging detects and differentiates axon and myelin degeneration in mouse optic nerve after retinal ischemia. Neuroimage. 2003;20(3):
1714-1722.
Song SK, Sun SW, Ramsbottom MJ, et al.
Dysmyelination revealed through MRI as in- creased radial (but unchanged axial) diffusion of water. Neuroimage. 2002;17(3):1429-1436.
Stein JM, Padykula HA. Histochemical classification of individual skeletal muscle fibers of the rat.
Am J Anat. 1962;110:103-123.
Stevens JE, Liu M, Bose P, et al. Changes in soleus muscle function and fiber morphology with one week of locomotor training in spinal cord con- tusion injured rats. J Neurotrauma. 2006;23(11):
1671-1681.
Sun SW, Liang HF, Le TQ, et al. Differential sensi- tivity of in vivo and ex vivo diffusion tensor imaging to evolving optic nerve injury in mice with retinal ischemia. Neuroimage. 2006;32(3):
1195-1204.
Talmadge RJ, Castro MJ, Apple DF, et al.
Phenotypic adaptations in human muscle fibers 6 and 24 wk after spinal cord injury. J Appl Physiol. 2002a;92(1):147-154.
Talmadge RJ, Roy RR, Caiozzo VJ, et al. Mechanical properties of rat soleus after long-term spinal
cord transection. J Appl Physiol. 2002b;93(4):
1487-1497.
Tator CH, Fehlings MG. Review of the secondary injury theory of acute spinal cord trauma with emphasis on vascular mechanisms. J Neurosurg.
1991;75(1):15-26.
Tzekou A, Fehlings MG. Treatment of spinal cord injury with intravenous immunoglobulin G:
Preliminary evidence and future perspectives. J Clin Immunol. 2014;34 Suppl 1:S132-S138.
Williams JH, Klug GA. Calcium exchange hypothesis
of skeletal muscle fatigue: A brief review.
Muscle Nerve. 1995;18(4):421-434.
Ye F, Baligand C, Keener JE, et al. Hindlimb muscle morphology and function in a new atrophy model combining spinal cord injury and cast immobilization. J Neurotrauma. 2013;30(3):
227-235. http://dx.doi.org/10.1089/neu.2012.2504
This article was received March 27, 2015, was re- viewed March 27, 2015, and was accepted May 2, 2015.