말소리와 음성과학 제6권 제3호 (2014.09.30) www.speechsciences.or.kr
ISSN 2005-8063, pp. 109~119 http://dx.doi.org/10.13064/KSSS.2014.6.3.109
Sound change of /o/ in modern Seoul Korean:
Focused on relations with acoustic characteristics and perception
Igeta, Takako1)․Sonu, Mee2)․Arai, Takayuki3)
ABSTRACT
This article represents a first step in a large study aimed at elucidating the relationship between production and perception involved in sound change of /o/ in (Seoul) Korean. In this paper we present the results of a production study and a perception experiment. For the production study we examined vowel production data of 20 young adult speakers, measuring the first and second formants, then conducted a discriminant analysis based on those values. In terms of their F1-F2 values, the distribution of /o/ and /u/ were close, and even overlapping in some circumstances, which is consistent with the literature.
This tendency was more apparent among the female speakers than the males. Moreover, with the females' distributions, /o/
was frequently categorized as /u/, suggesting that the direction of the sound change is indeed increasing from /o/ to /u/. Next, to investigate the effects of this proximity on perception, we used the production data of five randomly selected speakers from the production study as stimuli for a perception experiment in which 21 young adult native speakers of (Seoul) Korean performed a vowel identification task and provided a Goodness rating on a 5-point scale. We found that while rates of correctness were high, when these correctness scores were weighted by the Goodness rating, these “weighted correctness”
scores were lower in some cases, indicating a degree of confusion in distinguishing between the two vowels.
Keywords: Korean vowels, sound change, acoustic characteristics, production, perception
1. Introduction
The acoustic properties of Korean vowels have been reported on by numerous phoneticians to date (e.g. Han 1963;
Lee & Zhi 1983; Chung et al. 1988; Yang 1992, 1996).
Within that body of literature, a number of reports observe that, in the Seoul variety of Korean, the vowel qualities of /e/
and /ɛ/ differ across generations of speakers, and production and perception of /e/ and /ɛ/ are merged by young-adult Seoul dialect speakers (Umeda 1995, Lee & Ramsey. 2000).
Additionally, in recent years, several studies have observed /o/
raising towards /u/ in vowel space as plotted in F1/F2
1) Sophia University, [email protected]
2) National Institute for Japanese Language and Linguistics [email protected]
3) Sophia University, [email protected] Received: August 18, 2014
Revised: September 12, 2014 Accepted: September 18, 2014
diagrams. Broadly speaking, these studies can be classified as either production or perception studies.
We indicate previous literatures on production and perception research as follow.
1.1 Revisiting /o/ in the Seoul dialect
Recent years’ observations of /o/ in Seoul Korean was reported by Chae (1995). Vowel production studies dealing with /o/ in the Seoul dialect can be differentiated based on their foci. These include dialect differences (Chung 1988), age differences (Han & Kang 2013, Kang & Han 2013), sex differences (Seong 2004, Moon 2007, Igeta 2011, Han &
Kang 2013, Kang & Han 2013), and position of occurrence (Han & Kang 2013, Kang & Han 2013).
Chung et al. (1988a) conducted an acoustic analysis of the vowels of the Seoul and Kyungsang dialects. Chung and colleagues found that, when F1-F2 values for both dialects’
vowels were analyzed together, there was some degree of overlap between /o/ and /u/. Separating out the vowels of
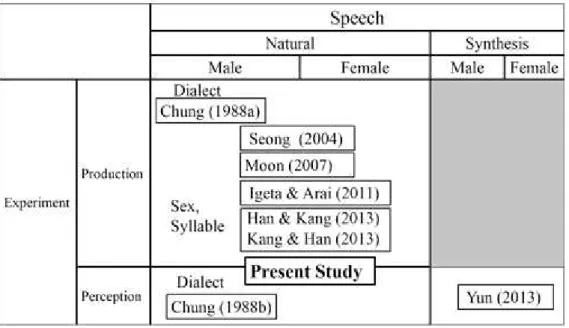
Figure 1. The present study and its relation to existing literature on Korean/o/ and /u
Seoul speakers, though, revealed overlap between /e/ and /ɛ/
but not /o/ and /u/. At face value, this suggests a low possibility of acoustic raising of /o/ in the Seoul dialect of the 1980s. However, since the data used in the study were comprised of vowels spoken in isolation, the results only tell us about /o/ raising outside of any relationship to phonological environment. Also, the data included only productions from male speakers, and so the results are not informative of non-linguistic effect of sex. If we consider acoustic characteristics of the Seoul dialect, a comparison of sex differences is a critical element in that consideration.
While raising of males’ /o/ was not observed by Chung et al.
(1988a), it is entirely plausible that females raised /o/ at the time.
Studies which focus on sex differences include Seong (2004), Moon (2007), and Igeta (2011). Seong (2004) looked at sex differences and found that, in Euclidean distance in F1-F2 space, /o/ was closer to /u/ among males than among females, whose /o/s were 1.36 times as distant. That is, compared to females, /o/ and /u/ were closer among males than among females.
Moon (2007) also investigated the effect of sex on /o/ and /u/ and found that while the distributions for both vowels were extremely close for both sexes, they nonetheless statistically formed separate vowel groupings. However, these results may reflect greater distinctiveness as the data used for analysis were selected from the results of a perception experiment, and not the study's larger dataset.
A later study by Igeta (2011) conducted a series of case studies of individual native Korean speaker's F1 and F2 values for 8 vowels and conducted an analysis using iso-probability ellipses. The results indicated females' distributions for /o/ and /u/ overlapped more than males'.
From this study, we can note observations of close proximity between /o/ and /u/ as well as overlap between them;
however, the study in Igeta (2011) was limited to qualitative analysis, but not quantitative.
Han & Kang (2013) and Kang & Han (2013) focused on phonological position as well as age differences. Han & Kang (2013) examined the distance between /o/ and /u/ as a function of age and reported that the two were closer among younger speakers. Moreover, looking at the distance between /o/ and /u/ in two-syllable words produced by younger speakers, they found that /o/ overlapped with /u/ in the second syllable for both males and females; however, in the first syllable, only females’ /o/ distributions overlapped with /u/ while the males’ did not. This shows that /o/ is involved in a change in progress for both sexes, but the change is further along among females than among males. Furthermore, in regard to the non-initial positional restriction shown by Chae (1995), Han & Kang (2013) did not observe this for the female speakers in their study. In this way we can see that where close proximity between /o/ and /u/ is an acoustic characteristic in play, as it were, it is plausible for the perception of either vowel to be affected in some way.
1.2 Speech perception by Seoul dialect listeners Vowel perception proceeds based on differences in their formant frequencies, whereby a wide variety are distinguished.
For this reason, analysis of the lower formant frequencies has featured prominently in research on vowel perception.
Chung et al. (1988b) conducted a perception experiment with native listeners of the Seoul and Kyungsang dialects using the vowels of both dialects as stimuli. In terms of their acoustic features, the stimuli they used for /o/ and /u/ were such that – acoustically – they clearly represented two different vowels. In spite of this acoustic distinctiveness of the /o/ and /u/ stimuli, however, Chung et al. observed that, in the perceptual space of the Seoul group, there was a little overlap between /o/ and /u/. Also, when the Seoul group listened to /o/ and /u/ produced by speakers of the Kyungsang dialect, they mistook /u/ for /o/ 31.3% of the time. On the other hand, while the Seoul group correctly perceived /o/ 68.7% of the time, where they incorrectly perceived it this was not as /o/ but rather as /ʌ/. A possible explanation for Seoul speakers mis-perceiving Kyungsang /o/
as /ʌ/ is that the F1 of /o/ and /u/ in the Kyungsang dialect is higher than that of /o/ and /u/ in the Seoul dialect.
Therefore, Seoul dialect listeners tend to mis-perceive /o/ of foreign dialect with /ʌ/ having higher F1.
Moon (2007) investigated the vowel qualities of young adult native speakers of the Seoul dialect with a view to elucidating the vowel system of Seoul Korean. As part of the acoustic analysis, Moon conducted a perception experiment using tokens selected for the acoustic analysis. The participants for perception experiment were university students in their early 20’s, the same generation as the speakers in their production study. However, the participants for perception experiment did not took part in the production research. Moon found that perception errors for /o/ and /u/
were frequent. That is, even the group who produced the experimental stimuli mis-perceived /o/ and /u/ frequently, which suggests that among these two vowels there was some similarity in acoustic properties afoot that affected perception.
Yun (2013) performed a number of perception tests using synthesized speech for young adult males and females from Daejeon and South Chungcheong. From these experiments Yun found that, when discriminating between /o/ and /u/, F2 was relied on as a cue more than F1. However, since Yun's participants were not Seoul speakers, it can be argued that the results are not entirely generalizeable to the Seoul dialect
even if we assume the participants used standard language.
1.3 Purpose of present study
In the context of the foregoing research, the present study investigates the sound change described as the approximation between the Korean back vowels /o/ and /u/. The present study and its relation to existing literature are summarized in Figure 1. Specifically, we investigate the proximity of these vowels and address the follow two research questions:
1. Does the close approximation of young adult Seoul Korean speakers’ back vowels /o, u/ exhibit stable directionality, and does it occur in vowels spoken in isolation?
2. Is it different between male and female speakers?
3. What effect does close approximation of two vowels in F1-F2 space have on perception and its assessment?
2. Acoustic characteristics of /o/ and /u/
by Seoul dialect speakers
2.1 Methodology 2.1.1 Participants
Twenty native speakers of Seoul Korean (males: 9, females: 11) in their early 20s to early 30s took part in this study. All had lived in Seoul or the surrounding Gyeonggi-do area from birth to 15 years of age.
2.1.2 Recorded sounds
We asked each of the 20 participants in our study to record each of the eight Korean monophthongs /a, i, ɯ, u, e, ɛ, ʌ, o/ three times, for a grand total of recorded 480 utterances (20 ´ 8 ´3 = 480).
2.1.3 Procedure
The vowel targets were presented one by one on a computer screen in Hangul orthography in a quiet room (background noise level: 28.9 dBA). Participants uttered the vowels as they were presented randomly, and these utterances were recorded using a digital sound recorder (Marantz PMD 660) and a microphone (SONY ECM-23F5) a sampling frequency of 48 kHz and a quantization level of 16 bits.
2.2 Measurement of F1 and F2
Our targets were isolated 8 vowels (/a, i, ɯ, u, e, ɛ, ʌ, o/),
and those were uttered three times by 20 participants. Thus, we analyzed the total number of 480 utterances. We measured the vowel formants by using XKL software (Klatt, 1984).
Some preparation was necessary before using XKL. First, these utterances were downsampled from 48 kHz to 8 kHz.
Then, we measured three points in time axis of first and second formant frequencies (F1, F2) in the steady state of each token. We adopted estimated values of formant frequency by linear predictive analysis in XKL. The order of linear predictive analysis was 14 with 25 ms Hamming windows. Additionally, in the case we had an error from XKL, we referred to the spectral characteristics obtained by discrete Fourier transform (DFT) to decide appropriate frequencies of the first and the second formants.
For each token, we calculated each distance between origin (0, 0) and the point (F1, F2) on F1-F2 plane based on the obtained value of F1 and F2 for each of the three points. The F1 and F2 pairs that give the medial distance were adopted as the representative values for each token, and used for the analysis.
2.3 Distribution of 8 vowels
Vowel plots created from the F1 and F2 values for the eight Korean vowels are shown by sex in Figures 2 (males’
vowels) and 3 (females’ vowels) while Tables 1 and 2 list their average F1 and F2 values. From Figures 2 and 3, we observed overlap between /e/ and /ɛ/ as reported in previous literatures (Umeda 1995, lee & Ramsey, 2000). We can also see in the figures is that the distributions for /o/ and /u/ are noticeably closer to one another compared with the other vowels, a similar tendency as that observed by Igeta (2011) and Kang et al. (2013). The remainder of this section will focus on /o/ and /u/ in more detail.
Let us now turn to the F1 and F2 values for /o/ and /u/ as well as their distribution. Looking at the values for male speakers shown in Table 1, we see that the average F1 for /o/ is 382 Hz and 348 Hz for /u/, a difference of roughly 10%. For F2, the average for /o/ is 724 Hz and 872 Hz for /u/, roughly 20% higher than /o/. Looking at the distribution of both vowels in Figure 2, we can see that although both /o/
and /u/ are extremely close together, they nonetheless group into separate categories. In contrast to the male speakers, the distribution of females' values for F1 and F2 for /o/ and /u/
are closer, with an average F1 at 471 Hz (/o/) and 476 Hz (/u/): a very small difference of roughly 1%. Average values
for females' F2 is 911 Hz for /o/ and 962 Hz for /u/, a difference of roughly 5%. Looking at the distributions of the females' F2 values for the two vowels in Figure 3, we see that they overlap with one another. Female’s 2 vowel distributions are closer than Male’s 2 vowel distributions. This is consistent with the findings of Kang & Han (2013); i.e., females' /o/ and /u/ feature greater overlap than males'.
2.4 Discriminant analysis
We conducted the discriminant analysis based on the statistical method by using Mahalanobis’ distance to see whether each token is properly categorized as the same vowel or miscategorized as the counterpart within an arbitrary vowel pair. Mahalanobis’ distance is normalized distance given by dividing vowel formant by standard deviation. This analysis shows to which group, whether each token is close /o/ or /u/.
The procedure is as follows. First, Mahalanobis' distance of each data point (V1) is measured from data sets of both V1 and V2. Next, we compared the Mahalanobis' distances to determine which data set is closer to each data point. Finally, we counted the number of data points which are close to the data set of V1. The numbers were counted within all combinations of V1 and V2.
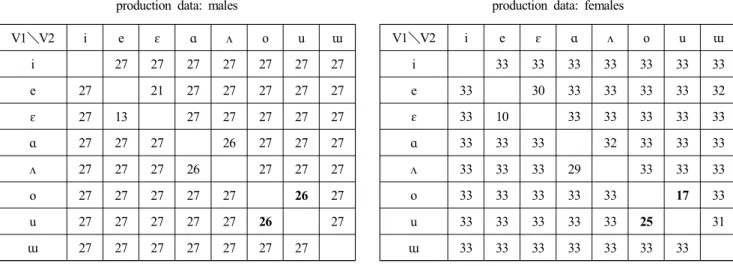
The results of the discriminant analysis of production data are shown in Tables 3 (males) and 4 (females). Tables 3 shows the discrimination results for the male speakers. Here, since there were 9 speakers repeating each vowel 3 times, the maximum possible correct categorization per measure is 27.
V1 indicates the vowel category to which each token is actually assigned, and vowels in V2 represents possible vowel categories to which each token can be assigned. Looking at the Tables 3, we see that /o/ was categorized to be /o/ in 26 cases, and /o/ was categorized to be /u/ in 1 case. With /u/, it was categorized as /u/ in 26 cases, and as /o/ in 1 case.
Table 4 shows the discrimination results for the female speakers. Here, since there were 11 speakers repeating each vowel 3 times, the maximum possible correct categorization per measure is 33. Looking at the Table 4, we see that /o/
was categorized to be /o/ in 17 cases, and /o/ was categorized to be /u/ in 16 cases. With /u/, it was categorized as /u/ in 25 cases, and as /o/ in 8 cases. From the above, we found that the categorical error of distributions was further advanced among the female speakers than the males. This finding is consistent with previous studies (Chae 1995, Kang& Han 2013, Han & Kang 2013), which found that the degree of
F1 F2
Vowel Mean SD. Mean SD.
i 250 31.0 2268 177.8
e 505 40.2 1907 138.8
ɛ 509 39.2 1926 119.2
ɑ 754 39.4 1158 66.4
ʌ 599 42.4 981 42.8
o 382 35.9 724 51.9
u 348 30.9 872 72.9
ɯ 348 33.1 1361 115.6
Table 1. F1 and F2 for 9 male speakers
F1 F2
Vowel Mean SD. Mean SD.
i 342 32.2 2796 188.9
e 614 67.2 2489 163.0
ɛ 623 49.7 2483 127.2
ɑ 926 97.5 1527 89.0
ʌ 753 61.4 1299 79.6
o 471 35.0 911 79.7
u 476 46.6 962 116.7
ɯ 457 33.6 1680 214.1
Table 2. F1 and F2 for 11 female speakers
Figure 2. Vowel space of 9 male speakers
Figure 3. Vowel space of 11 female speakers
V1\V2 i e ɛ ɑ ʌ o u ɯ
i 27 27 27 27 27 27 27
e 27 21 27 27 27 27 27
ɛ 27 13 27 27 27 27 27
ɑ 27 27 27 26 27 27 27
ʌ 27 27 27 26 27 27 27
o 27 27 27 27 27 26 27
u 27 27 27 27 27 26 27
ɯ 27 27 27 27 27 27 27
Table 3. Results of the discriminant analysis of production data: males
V1\V2 i e ɛ ɑ ʌ o u ɯ
i 33 33 33 33 33 33 33
e 33 30 33 33 33 33 32
ɛ 33 10 33 33 33 33 33
ɑ 33 33 33 32 33 33 33
ʌ 33 33 33 29 33 33 33
o 33 33 33 33 33 17 33
u 33 33 33 33 33 25 31
ɯ 33 33 33 33 33 33 33
Table 4. Results of the discriminant analysis of production data: females
overlap between the two vowels was greater among female speakers than among males. Moreover, we have found in this discriminant analysis that, with the females and within the category overlap between vowels, /u/ is not categorized to /o/, but rather, /o/ is categorized to /u/. This is a new finding that sheds light on the directionality of this sound change.
3. Perception experiment
We conducted a perception experiment to ascertain whether Seoul Korean speakers could distinguish between these two vowels, /o/ and /u/, which have come into close approximation in F1-F2 space. To do this, we randomly selected a subset of the data analyzed in §2 and used these as stimuli in a forced choice task. Participants listened to a stimulus, then choose which of two vowels it was that they heard. Participants were then asked to rate the stimulus on a 5-point Goodness scale.
3.1 Stimuli
The stimuli used in the perception experiment were comprised of a randomly-selected subset of the data recorded in the investigative study. Specifically, where 9 males and 11 females contributed to the investigative data set, for the perception experiment we randomly selected 5 speaker’s data (male: 2, female: 3). From these randomly-selected 5 speakers’ data, we further selected the third of 3 repetitions of /o/ and /u/ for use as stimuli tokens in the perception experiment. The total number of tokens used as stimuli were thus 10: 1 repetition of /o/ and 1 repetition of /u/ from each of 5 speakers.
3.2 Participants
Twenty-one young adult native speakers of Seoul Korean took part in the perception experiment (5 males, 16 females, average age: 22.6 years). Eighteen were from Seoul proper, and 3 were from the surrounding area of Gyeonggi.
Participant numbers and ages are summarized in Appendix.
3.3 Procedure
The /o, u/ perception experiment was performed one participant at a time in a quiet room at Seoul’s Konkuk University using the speech analysis software Praat (ver. 5.3).
Stimulus tokens of /o/ and /u/ were presented randomly to each participant through SENNHEISER headphones. Upon
hearing a stimulus, participants selected one of /o/ or /u/, displayed in Hangul orthography on a monitor in from of them. We arranged our set up such that participants could play a given stimulus a maximum of 2 times. In addition to selecting which of orthographic /o/ or /u/ a stimulus represented, participants also graded how well each stimulus they heard represented the category they chose by marking it according to a 5-point Goodness scale.
3.4 Analysis
Two types of correctness scores, calculated for each stimulus, are used in the analysis of perception data: a simple, non-weighted correctness score as well as a weighted-by- Goodness correctness score (hereafter: weighted correctness).
Non-weighted correctness was determined for each stimulus token, counting ‘1’ if correct and ‘0’ if incorrect. Weighted correctness scores were generated from combining non-weighted correctness with the Goodness measures taken on a 5-point scale. In other words, if a response was correct but with low Goodness, such as, 2 out of 5, then we counted 0.4 (=2/5) instead of 1 for correct response as the weighted-correctness score. The Goodness measure allowed us to capture any uncertainty participants may have had with regard to their own categorical /o/ versus /u/ judgments.
Finally, we averaged all scores by dividing their sum totals by 21, the number of participants in the perception experiment.
3.5 Results and Discussion
Figures 4 and 5 show the average non-weighted and weighted correctness scores, by stimulus, for /o/ (Fig. 4) and /u/ (Fig. 5). In each graph, correctness is given on the vertical axis while the correctness measures themselves are shown on the horizontal axis, with non-weighted correctness on the left and weighted correctness on the right. Stimuli produced by the two males are designated KM1 and KM2, while those from the three female speakers are designated by KF1, KF2, and KF3, respectively.
Beginning with the correctness rates for /o/ (Fig. 4), all stimuli scored 100% on the non-weighted measure with the exception of KF1, which scored 95.2%. Looking at the weighted correctness scores, 4 of the 5 stimuli scored over 90%; from highest to lowest these are KF2 at 98.1%, KM1 at 96.2%, KF3 at 93.3%, and KF1 at 90.5%. The lowest weighted correctness score for /o/ was KM2’s stimulus at 86.7%.
Figure 4. Perceptual discrimination results: /o /. Figure 5. Perceptual discrimination results: /u /.
Turning to the correctness rates for /u/ (Figure 5), all stimuli scored 100% on the non-weighted measure with the exception of KF3, which scored 95.2%. Looking at the weighted correctness scores, 3 of the 5 stimuli scored over 90%; from highest to lowest these are KF1 at 98.1%, KM2 at 97.1%, and KF3 at 94.3%. The 2 remaining lowest weighted correctness scores for /u/ were KF2’s stimulus at 87.6% and KM1’s stimulus at 77.1%.
Despite 4 out of the 5 /o/ stimuli scoring 100%
non-weighted correctness, there were nonetheless some, like KM2’s 86.7%, for which the weighted correctness score dropped greatly. With /u/ as well, the range went from 100%
to 77.1% for KM1 and to 87.6% for KF2. By including weighted correctness as a means of capturing listeners’ lack of certainty about their categorical discrimination choices, we were able to observe a result that suggests, indeed, that such lack of certainty may have taken place among listeners when judging the stimuli. Also, from comparing Figures 4 and 5, we can see that the weighted correctness scores for /u/ are lower than those for /o/.
4. Comparison of acoustic characteristics and perception To ascertain whether we can observe an effect of acoustic properties on perception, we now compare the results of our perception experiment from §3. For ease of comparison, the speech stimuli only for /o/ and /u/ were in F1- F2 space so that their distributions could be visually accessible. These data are comprised of the speech of the 9 males and 11 females who participated in the initial investigation, described in
§2.1.1. Figure 6 shows the male speech data, and Figure 7 shows the female speech data; /o/ data points are displayed as white circles while /u/ data are white squares. Further, data
points for /o, u/ used as stimuli in the perception experiment are filled in black, and the stimuli’s associated speakers as well as weighted correctness scores are indicated with text boxes and arrows.
First, let us examine the males’ vowel distribution (Figure 6). The distributions of the two vowels /o/ and /u/ appear close together, and partly overlapping – which is consistent with previous studies (Kang & Han 2013, Han & Kang 2013). Table 5 indicates Mahalanobis’ distance from each stimulus by the two male speakers to the /o/ or /u/ cluster.
We focus on the results of 2 male’s /o/ stimuli. KM1’s weighted correctness is 96.2%, and Mahalanobis’ distance between the data point of /o/ and /o/ cluster is 5.9506, /u/
cluster is 93.3733. We indicate Mahalanobis’ distance in § 2.4. KM1’s Mahalanobis’ distance for /o/ is closer to the /o/
cluster than the /u/ cluster, and is categorized as a /o/. On the other hand, KM2’s weighted correctness is 86.7%, and Mahalanobis’ distance between the data point of /o/ and /o/
cluster is 1.0716, /u/ cluster is 139.8962. KM1’s and KM2’s stimuli are close to /o/ cluster, therefore both weighted correctness are high. Then, we focus on the results of 2 male’s /u/ stimuli (Table 5). KM1’s weighted correctness is 77.1%, and Mahalanobis’ distance between the data point of /u/ and /u/ cluster is 5.2707, /o/ cluster is 4.7280. On the other hand, KM2’s weighted correctness is 97.1%, and Mahalanobis’ distance between the data point of /u/ and /u/
cluster is 3.8027, /o/ cluster is 10.2216. It assumed that Mahalanobis’ distance between KM1’s stimulus and each vowel cluster could have been affected to KM1’s weighted correctness.
Next we consider the females’ vowel space plot (Figure 7).
First, it is visually apparent that the distributions for /o/ and
Male
Vowel Weighted
correct rate (%)
F1 (Hz)
F2 (Hz)
Mahalanobis’ distance between /o/ cluster
Mahalanobis’ distance
between /u/ cluster Speaker
/o/ 96.2 397 806 5.9506 93.3733 KM1
86.7 419 772 1.0716 139.8962 KM2
/u/ 77.1 406 1008 4.7280 5.2707 KM1
97.1 306 936 10.2216 3.8027 KM2
Table 5. Mahalanobis’ distance and F1, F2 by 2 male speakers, with weighted correctness.
Female
Vowel Weighted
correct rate (%)
F1 (Hz)
F2 (Hz)
Mahalanobis’ distance between /o/ cluster
Mahalanobis’ distance
between /u/ cluster Speaker
/o/ 90.5 425 848 1.3744 1.6145 KF1
98.1 525 1031 3.3957 2.0200 KF2
93.3 452 875 0.0792 0.7632 KF3
/u/ 98.1 423 990 17.6887 0.7837 KF1
87.6 531 960 6.6070 2.4730 KF2
94.3 426 887 3.0736 1.0157 KF3
Table 6. Mahalanobis’ distance and F1, F2 by 3 female speakers, with weighted correctness.
/u/ overlap. Especially interesting is that the distribution for /o/ is located within the distribution for /u/. With the vowels themselves, beginning with the perception results for /o/, recall that the weighted correctness scores for the stimuli were high: KF2 at 98.1%, KF3 at 93.3%, and KF1 at 90.5%.
Given these high scores, how distant are these data points from the /o/ cluster? Calculating Mahalanobis’ distance for 3 female’s each stimulus between 2 vowel clusters. First, we find KF2 at 3.3957, KF3 at 0.0792, and KF1 at 1.3744. From these values, we cannot see a relationship between weighted correctness and Mahalanobis’ distance.
Calculating distance again this time with respect to the /u/
cluster gives us KF2 at 2.0200, KF3 at 0.7632, and KF1 at 1.6145. Interesting here is that KF2’s Mahalanobis’ distance for /o/ is closer to the /u/ cluster than the /o/ cluster, and is in fact categorized as a /u/.
Moving on to /u/, we see that the results of the perception test indicated relatively high weighted correctness with KF1 at 98.1%, KF2 at 87.6%, and KF3 at 94.3%. We calculated
Mahalanobis’ distance (Table 6), which find KF1 at 0.7837, KF2 at 2.4730 and KF3 at 1.0157. Relative to the /o/ cluster, on the other hand, we calculated the Mahalanobis’ distance for these stimuli as follows: KF1 at 17.6887, KF3 at 3.0736, and KF2 at 6.6070 – distances which place these stimuli further away from the /o/ cluster compared with the /u/
cluster. Comparing KF2 with KF1, there is a difference in F1 of around 100 Hz, which may have caused confusion in judging its Goodness as an instance of /u/. However, while Yun (2013) suggests that F2 cues perception to a larger extent than F1, we do not know if F2 is controlling perception in this case. With that in mind, whether native speakers are sensitive to a 100 Hz difference in F1 such that it affects their perception is a worthwhile topic for further research.
Figure 6: Vowel space of 9 male speakers. Squares and circles indicate /o/ and /u/. Filled marks indicate perception experiment stimuli.
Figure 7: Vowel space of 11 female speakers. Squares and circles indicate /o/ and /u/.
Filled marks indicate perception experiment stimuli.
5. Conclusion
This paper has investigated a sound change in progress reported in the literature, /o/ raising in Korean, and set as one of its research questions whether the approximation of /o, u/
among young adult speakers of Seoul Korean can be seen in vowels spoken in isolation in the same way as it has been reported in 2-syllable words. To answer this question, we conducted a production study whose results confirmed approximation of /o, u/ in vowels spoken in isolation.
Further, to ascertain the directionality of the approximation between the 2 vowels, we conducted a discriminant analysis whose results for isolated vowels were similar to those of previous reports on the overlap between /o/ and /u/ in 2 syllable words. In particular, we found that roughly half of females’ /o/s were categorized as /u/. Since this was not the case f for male speakers, though, it became clear that females, more than males, categorized /o/ and /u/ as separate vowel clusters. This is consistent with similar findings in the literature which report overlap for both males and females, with the extent of that overlap being greater among females than males. Having found similar results, we were also able to investigate the extent to which overlap occurred across the two vowels among males and females.
A new finding about female speech which we were able to obtain from the production study was that the direction in which one vowel was categorized as another was predominantly from /o/ to /u/. We next conducted a perception experiment to ascertain what effect acoustic properties might have on perception. The results indicated that while listeners were able to identify the correct vowel category for a given spoken vowel, there were some stimuli whose acoustic properties confused listeners to some degree during perception. That is, while /o/ and /u/ stimuli were identified with a high degree of simple, categorical correctness, the Goodness-weighted correctness scores of some of these stimuli was lower, indicating confusion in perception.
From perception experiment, we found that while rates of correctness were high, when these correctness scores were weighted by the Goodness rating, these “weighted correctness”
scores were lower in some cases, indicating a degree of confusion in distinguishing between the two vowels. Sound change has already been suggested by the acoustic characteristics. Besides, results of the perceptional experiment suggest that it may be possible that sound change in
production causes perceptual merge. Therefore, it is necessary to analyze results of the perception experiment in terms of acoustic characteristics of stimuli.
In our future research on the acoustic characteristics of /o/
and /u/, we would like to examine in detail individual characteristics in conjunction with perception experiments.
Also, further examination of syllable structure and consonantal environment in conjunction with perception experiments is an avenue we would like to explore further to see if the acoustic characteristics we have observed here can be verified using those methodologies.
ACKNOWLEDGMENTS
I would particularly like to thank Thomas Magnuson from University of Victoria for helpful comments and practical advice on this paper. I take this opportunity to express my profound gratitude to Prof. Kwangjoon Min from Konkuk University, for giving us cordial support as a Global Mentor of Sophia University from Women Researchers Support Program Office. This study work was supported by the Sophia University Open Research Center and Women Researchers Support Program Office. I am also grateful for Step Up Grant by the Sophia University Global Mentoring System", which is one of the creative approaches to strengthen the research ability of younger scholars at Sophia University. This system is implemented as a part of MEXT program, "Supporting Activities for Women Researchers". In our experiment, I would like to thank undergraduate students from Kunkuk University of Japanese Language Education for participating. In addition, special thanks go to all speakers for production research.
References
Boersma, P. & Weenink, D. (2011) Praat: doing phonetics by computer [Computer program].Version 5.3, retrieved 15 November 2011 from http://www.praat.org/
Chae, S. (1995). External constraints on sound change: The raising of/o/ in Seoul Korean, Ph.D. dissertation, Philadelphia: University of Pennsylvania.
Chung, H, Makino, S., & Kido, K. (1988 a). Analysis and recognition of Korean isolated vowels using formant frequency, Journal of the Acoustic Society of Japan, (E) 9(5), 225-232.
Chung, H., Makino, S., & Kido, K. (1988 b). On the listening tests using natural speech of 8 Korean vowels, Journal of the Acoustic Society of Japan, (E) 9(6), 305-307.
Han, J. & Kang, H. (2013). Cross-generational change of /o/
and /u/ in Seoul Korean Ⅰ: proximity on vowel space, Journal of the Korean society of speech sciences, 5(2), 25-31.
Han, M. (1963). Acoustic phonetics of Korean. Studies in the phonology of Asian language.
Kang, H. & Han, J. (2013). Cross-generational change of /o/
and /u/ in Seoul Korean Ⅱ: Spectral interactions in normalized vowel space, Journal of the Korean society of speech sciences, 5(2), 33-41.
Igeta, T. & Arai, T. (2011). A case study on comparison of male and female vowel formants by native speakers of Korean, Proceedings of the 17th International Congress of Phonetic Sciences, Hong Kong, August, 934-937.
Klatt, D.H. (1984). The new MIT speech VAX computer facility, Speech Communication Group Working Papers IV, Research Laboratory of Electronics, MIT, Cambridge, 73-82.
Lee, H. & Zhi, M. J. (1983). A Perceptual study of Korean vowels, MALSORI, 6(1), 4-12.
Lee, I. & Ramsey, S. R. (2000). The Korean language, State University of New York Press.
Moon. S. (2007). A fundamental phonetic investigation monophthongs, MALSORI, 62, 1-17.
(문승재 (2007). 한국음향학회지한국어 단모음의 음성학적 기반연구. 말소리, 62, 1-17.)
Seong, C. (2004). An acoustic analysis on the Korean 8 monophthongs -With respect to the acoustic variables on the F1/F2 vowel space, Journal of the Acoustical Society of Korea, 23(6), 454-461.
(성철재 (2004). 한국어 단모음 8개에 대한 음향분석. 한국 음향학회지, 23(6), 454-461.)
Umeda, H. (1995). Age differentiation of the vowel system in the Seoul Korean: Acoustic measurements, Journal of Asian and African Studies, 48-49, 443-453.
Yang, B. (1992). An acoustical study of Korean monophthongs produced by male and female speakers, Journal of Acoustical Society of America, 91(4), 2280-2283.
Yang, B. (1996). A comparative study of American English and Korean vowels produced by male and female speakers, Journal of Phonetics, 24-245-261.
Yun, J. & Seoung, C. (2013). Cross-generational change of /o/
and /u/ in Seoul Korean Ⅱ: Spectral interactions in
normalized vowel space, Journal of the Korean society of speech sciences, 5(2), 33-41.
(윤지현, 성철재 (2004). F1/F2의 변화가 한국어 /오/, /우/
모음의 지각판별에 미치는 영향, 말소리와 음성과학, 5(3), 39-46.)
∙Igeta, Takako
Sophia University, Faculty of Science and Technology, 7-1 Kioi-cho, Chiyoda-ku, Tokyo, 102-8554 JAPAN Email: [email protected]
∙Sonu, Mee
National Institute for Japanese Language and Linguistics, 10-2 Midori-cho, Tachikawa City, Tokyo, 190-8561 JAPAN Email: [email protected]
∙Arai, Takayuki
Sophia University, Faculty of Science and Technology, 7-1 Kioi-cho, Chiyoda-ku, Tokyo, 102-8554 JAPAN Email: [email protected]
Appendix
early 20s late 20s early 30s Number of
participants (Male: Female)
N=6 (2:4)
N=9 (5:4)
N=5 (2:3)
Age (Mean)
20-24 (22.7 yrs)
26-29 (27.2 yrs)
30-34 (31.8 yrs) Production research participants.
late 10s early 20s late 20s early 30s Number of
participants (Male: Female)
N=2 (0:2)
N=16 (4:12)
N=1 (0:1)
N=2 (1:1) Age
(Mean)
19 (19.0 yrs)
20-24 (21.8 yrs)
26 (26.0 yrs)
30-31 (30.5 yrs) Perception experiment participants.