1. Introduction
Previous studies have reported that distributions of /o/ and /u/ by young-adult native speakers of Seoul dialect have similar acoustic features in terms of first and second formants (Chung, 1988; Moon, 2007; Igeta & Arai, 2011; Han & Kang, 2013; Han et al., 2013;
Igeta et al., 2014). The degree of /o/ and /u/ overlapping has been reported to differ by generation. For example, Han & Kang (2013), Kang & Han (2013), and Han et al. (2013) have concluded language sound change to be the cause of the overlap of /o/ and /u/.
Additionally, the phenomenon of the overlap of /o/ and /u/ was reported to be more prominent for female speakers than for male speakers (Chung et al., 1988; Moon, 2007). Chae (1995) has
reported that the overlapping of /o/ and /u/ occurred in non-initial position. This showed that there was restriction for which the overlapping of /o/ and /u/ could occur in words.
However, recent studies have also reported that the overlapping of /o/ and /u/ occurs in the speech of male speakers. This phenomenon suggested an ongoing sound change in Korean for male speakers (Han & Kang, 2013; Kang & Han, 2013; Igeta et al., 2014). Han & Kang (2013) and Kang & Han (2013) investigated the degree of overlaps by looking at the phonological positions for male and female speakers. The results suggested that /o/ and /u/ by female speakers overlapped irrespectively of the phonological positions in CVCV context. Furthermore, the studies have shown that /o/ and /u/
by male speakers overlapped at non-initial position in CVCV context. Thus, in Han & Kang (2013) and Kang & Han (2013), it
* This work was supported by JSPS KAKENHI Grant Number: JP15K16747
** Sophia University, Faculty of Science and Technology, [email protected] Received 30 September 2016; Revised 2 March 2017; Accepted 8 March 2017
ISSN 2005-8063 2017. 3. 31.
Vol.9 No.1 pp. 1-7
말소리와 음성과학
http://dx.doi.org/10.13064/KSSS.2017.9.1.001
Overlapping of /o/ and /u/ in modern Seoul Korean:
focusing on speech rate in read speech
*Takako Igeta**, Sadao Hiroya, Takayuki Arai
Abstract
Previous studies have reported on the overlapping of F1 and F2 distribution for the vowels /o/ and /u/ produced by young Korean speakers of the Seoul dialect. It has been suggested that the overlapping of /o/ and /u/ occurs due to sound change.
However, few studies have examined whether speech rate influences the overlapping of /o/ and /u/. On the other hand, previous studies have reported that the overlapping of /o/ and /u/ in syllable produced by male speakers is smaller than by female speakers. Few reports have investigated on the overlapping of the two vowels in read speech produced by male speakers. In the current study, we examined whether speech rates affect overlapping of /o/ and /u/ in read speech by male and female speakers. Read speech produced by twelve young adult native speakers of Seoul dialect were recorded in three speech rates. For female speakers, discriminant analysis showed that the discriminant rate became lower as the speech rate increases from slow to fast. Thus, this indicates that speech rate is one of the factors affecting the overlapping of /o/ and /u/.
For male speakers, on the other hand, the discriminant rate was not correlated with speech rate, but the overlapping was larger than that of female speakers in read speech. Moreover, read speech by male speakers was less clear than by female speakers. This indicates that the overlapping may be related to unclear speech by sociolinguistic reasons for male speakers.
Keywords: Korean vowel, sound change, Seoul dialect, speech rate, read speech
was found that there is a difference in the degree of overlap between the two vowels in the utterance of male and female. After that, Igeta
& Arai (2014) examined the overlap of isolated /o/ and /u/ by male and female speakers. The result indicated that /o/ and /u/ overlapped in both male and female speakers. The degree of overlapping of two vowels by female speakers is larger than male speakers.
Although many previous studies have concluded that sound change causes the overlapping of /o/ and /u/, it is possible that speech rate also contributes to the overlapping. It has been reported widely that speech rate affects acoustic vowel spaces. Previous studies (e.g. Van Son et al., 1990, 1992; Tsao et al., 2006 inter alia) suggested that vowel spaces are compressed in fast speech rate than slow speech rate. Therefore, it is possible that unclear articulation in fast speech rate leads to greater overlapping of /o/ and /u/. However, few studies have examined whether speech rate influences the overlapping of the two vowels.
Chae (1995) reported that sound change of /o/ occurred in spontaneous speech. However, many previous studies investigated the overlapping of /o/ and /u/ in only small speech unit such as two syllables for both male and female speakers. On the other hand, Han et al. (2013) examined the overlapping of /o/ and /u/ by female speakers in read speech, which resembles spontaneous speech in terms of its speech unit. Therefore, the overlapping of /o/ and /u/ for male speakers was not confirmed in read speech acoustically.
In this paper, we investigated whether speech rate affects the overlapping of /o/ and /u/ in read speech for both male and female speakers.
2. Production experiment
2.1. Participants
Twelve native speakers of Seoul Korean (males: 6, females: 6) in their early 20s to early 30s took part in this study (Table 1). All had lived in Seoul or the surrounding Gyeonggi area from birth to 15 years of age.
Male Female
Number of participants N = 6 N = 6
Age (mean)
20 - 30 (24.3)
20 - 30 (26.5) Table 1. Participants for production experiment
2.2. Recorded sounds and procedure
Participants read the story of ‘North wind and sun’ (Suzuki, 2002) at three speech rates (fast, normal and slow). We asked the participants to read the text as fast as possible during ‘fast’ speech and as slow as possible during ‘slow’ speech. However, there is a possibility that naturalness of read speech would be degraded in ‘fast’ and ‘slow’
speech rates. Therefore, we asked the participants to pay attention to control their speech rate as carried out in Port et al. (1980) and Hirata & Whiton (2005). They read the text in order of ‘fast’,
‘normal’ and ‘slow’.
The participants were also asked to practice reading the text before the actual recording. The participants had to read the story repeatedly until there were no errors. The utterances were recorded in a sound-treated room at Sophia University using a digital sound recorder (Marantz PMD 660) and a microphone (SONY ECM-23F5) at
48 kHz sampling and 16 bit quantization.
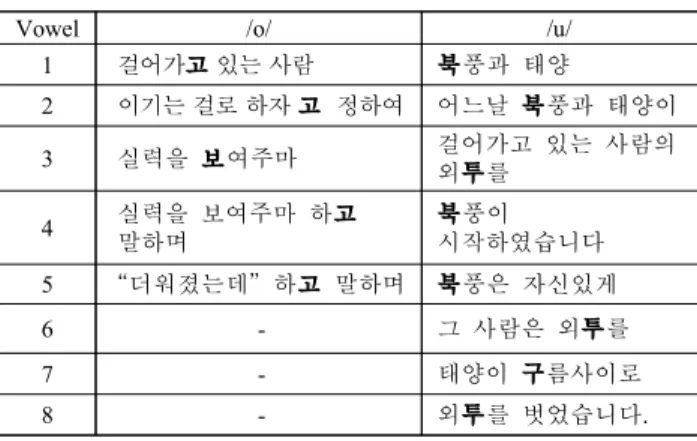
Vowel /o/ /u/
1 걸어가고 있는 사람 북풍과 태양
2 이기는 걸로 하자 고 정하여 어느날 북풍과 태양이
3 실력을 보여주마 걸어가고 있는 사람의
외투를
4 실력을 보여주마 하고
말하며 북풍이
시작하였습니다
5 “더워졌는데” 하고 말하며 북풍은 자신있게
6 - 그 사람은 외투를
7 - 태양이 구름사이로
8 - 외투를 벗었습니다.
Table 2. Read sentences consisting of the target vowels for formant measurement in present research
3. Acoustic characteristics of /o/ and /u/
3.1. Speech rate
Table 3 displays speech rate and articulation rate in read speech.
Speech rate was calculated as the number of syllables per second.
Articulation rate was also calculated as the number of syllables per second, without the pauses from the read speech data.
3.2. Formant measurement
We measured the formant frequencies of vowels /o/ and /u/ by linear predictive analysis in XKL with a 25-ms Hamming window (Klatt, 1984). Although it is known that phoneme environment affects degree of overlapping, either lenis or aspirated stop was used as preceding consonants based on our investigation (Table 2). These signals were downsampled from 48 kHz to 8 kHz and pre-emphasized using a first order high-pass filter (coefficient: 0.98). The measuring position are three points at 20%, 50%, 80% of all duration in steady-state. We decided the mean of F1 and F2 as the token of F1
and F2. The order of linear predictive analysis was 10 in male and 8 in female.
In the case where consonants and syllable environments in sentence cause devoicing, we discard the devoiced vowels completely because measuring of F1 and F2 is impossible. In the case of partially voiced vowel, we measured F1 and F2 manually by looking at sound wave and sound spectrogram. Table 4 indicates the ratio of measured tokens. The number of devoiced vowels by male speakers was larger than by female speakers. Devoicing may be related to unclear speech.
Speech rate Articulation rate
Male Female Male Female
Mean (S.D) Mean (S.D)
Fast 6.50 (0.46) 6.33 (0.52) 7.41 (0.43) 7.89 (1.62) Normal 4.84 (0.44) 4.82 (0.44) 5.88 (0.48) 5.76 (0.37) Slow 3.29 (0.53) 3.55 (0.36) 4.66 (0.28) 4.90 (1.17) Table 3. Speech rate and articulation rate in read speech. Speech rate
was calculated as the number of syllables per sec. Articulation rate was also calculated as the number of syllables per second,
without the pauses from the read speech data.
Male Female
/o/ /u/ /o/ /u/
Fast 96.7 (29/30) 52.1 (25/48) 100.0 (30/30) 93.8 (45/48) Normal 100.0 (30/30) 58.3 (28/48) 100.0 (30/30) 93.8 (45/48) Slow 100.0 (30/30) 81.3 (39/48) 100.0 (30/30) 97.9 (47/48)
Table 4. Ratio of tokens for formant measurement by speech rate.
(The number of the tokens without fully devoiced tokens / total number of tokens)
/o/ /u/
F1 [Hz] F2 [Hz] F1 [Hz] F2 [Hz]
Mean (S.D.) Mean (S.D.) Mean (S.D.) Mean (S.D.)
Fast 374 (40.8) 937 (132.4) 331 (39.8) 1174 (251.5)
Normal 366 (37.8) 933 (172.4) 323 (39.7) 1207 (248.1)
Slow 364 (42.1) 872 (176.2) 311 (40.5) 1178 (286.1)
Table 5. Mean of F1 and F2 for male speakers by speech rate
/o/ /u/
F1 [Hz] F2 [Hz] F1 [Hz] F2 [Hz]
Mean (S.D.) Mean (S.D.) Mean (S.D.) Mean (S.D.) Fast 435 (47.4) 1035 (175.6) 385 (39.4) 1371 (335.7) Normal 431 (44.0) 970 (153.3) 381 (42.9) 1390 (344.1)
Slow 424 (53.2) 925 (131.3) 374 (40.9) 1380 (322.0)
Table 6. Mean of F1 and F2 for female speakers by speech rate
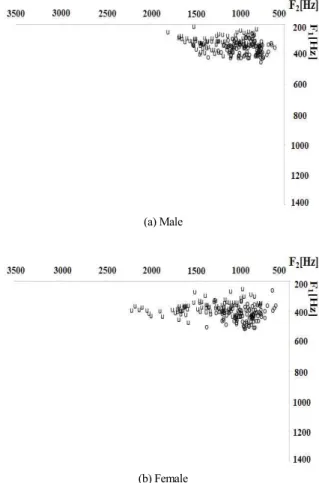
3.3. Distributions of /o/ and /u/
Figure 1 indicates the distribution of /o/ and /u/ in read speech of all speech rate by gender. It shows a similar tendency to previous studies (Yang, 1992, 1996) in females’ distribution. Figure 2 and 3 show the distribution of /o/ and /u/ in read speech in each speech rate by male and female speakers. The mean and standard deviation (S.D.) of formant frequencies are summarized by male speakers (Table 5) and female speakers (Table 6). In speech rate, it is difficult to confirm the differences of distributions of male (Figure 2) and female (Figure 3) visually, though it seems that Table 5 and 6 show a similar tendency in both genders.
Firstly, we focused on F1 and F2 by male speakers. Mean F1 of /o/
in ‘fast’, ‘normal’ and ‘slow’ rate was 374 Hz, 366 Hz, 364 Hz, respectively. Mean F2 of /o/ in ‘fast’, ‘normal’ and ‘slow’ rate were 937 Hz, 933 Hz, 872 Hz, respectively. Both mean F1 and F2 rise as the speech rate gets faster. The change in F1 value of /o/ indicates a change in tongue height. With the F1 value increasing, it can be considered that as speech rate becomes faster, the lower the tongue becomes. The change in the F2 value indicates a “back-ness”/
“front-ness” relationship of the tongue’s location within the oral cavity. The higher F2 in faster speech rate suggests the tongue moving forward the front of the mouth. This indicates that, within the vowel chart, the mapping of the distribution of mean has become more centralised toward faster speech rate.
Next, we focused on the F1 and F2 values produced by the female speakers (Table 6). Mean F1 of /o/ in ‘fast’, ‘normal’ and ‘slow’ rate were 435 Hz, 431 Hz, 424 Hz, respectively. Mean F2 of /o/ in ‘fast’,
‘normal’ and ‘slow’ rate were 1035 Hz, 970 Hz, 925 Hz, respectively.
Therefore, we can confirm similar tendency of lowering the tongue as speech rate becomes faster observed for both male and female speakers. Similar to the F1 pattern observed for /o/, the F1 value of /u/ also increases as the speech rate increases. However, the F2 value
(a) Male
(b) Female
Figure 1. Distributions of /o/ and /u/ by male (a) and female (b).
These distribution combines all speech rates (‘fast’, ‘normal’ and ‘slow’).
Fast
Normal
Slow
Figure 2. Distributions of /o/ and /u/ by male speakers for each of the speech rates.
of /u/ did not display similar tendencies as /o/. Both male and female speakers showed similar results.
4. Discriminant analysis
4.1. Methods
In the present study, we conducted the same discriminant analysis as Igeta et al. (2014) by using Mahalanobis distance to see whether each token has been properly categorized as the same vowel or miscategorized as the different vowel. Mahalanobis distance D between a token ‘V1’ and a distribution ‘V2’ is obtained as follows.
Fast
Normal
Slow
Figure 3. Distributions of /o/ and /u/ by female speakers for each of the speech rates.
Here, F indicates the formant values of token ‘V1’, and μ and σ are the mean and the variance-covariance of distribution ‘V2’, respectively. The mean and variance-covariance are obtained from F1 and F2 values of all tokens of the distribution ‘V2’. Discriminant analysis shows which distribution is closer to each token, /o/ or /u/.
Therefore, each token was categorized as /o/ if Mahalanobis distance between the token and a distribution /o/ was less than that for /u/, and vice versa.
4.2. Results
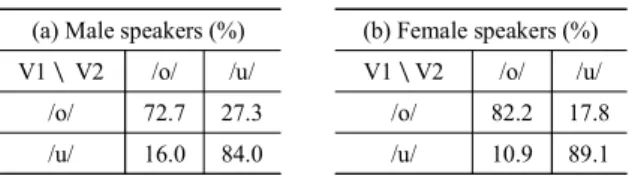
Table 7 shows the result by each gender for all speech rates. The results of the discriminant analysis by using data of male speakers show that 72.7% of the /o/ tokens was categorized to be /o/, and 84.0% of the /u/ tokens was categorized to be /u/. On the other hand, the results of the discriminant analysis by using data of female speakers indicate that 82.2% of the /o/ tokens was categorized to be /o/, and 89.1% of the /u/ tokens was categorized to be /u/. Table 7 indicates that the discriminant rate of both /o/ and /u/ by male speakers was lower than female.
Table 8 and 9 show the results for each speech rate by male and female speakers, respectively. In the male speakers’ results (Table 8), the overall ratio for categorizing vowel /o/ as /u/ was high compared to the discriminant rate of participants categorizing the vowel /u/ as /o/ for all speech rates. In the overall data of female speaker (Table 9), as the speech rate got faster the discriminant rate of the participants categorizing the vowel /u/ as /o/ increased. Table 8 and 9 indicate that discriminant rates of both /o/ and /u/ by male speakers are lower than female speakers for all speech rates except for categorizing vowel /u/ as /o/ in ‘fast’ rate.
Figure 4 shows the mean and standard deviation of the discriminant rate in each of the speech rates by male and female speakers. Mean of the discriminant rate by female speakers in ‘fast’,
‘normal’ and ‘slow’ rate were 82.4 %, 85.8 %, 90.8 %, respectively.
This indicates that speaking rate is correlated with discriminant rate, i.e., the overlapping of /o/ and /u/, for female speakers. However, mean of the discriminant rate by male speakers in ‘fast’, ‘normal’
and ‘slow’ rate were 83.5 %, 70.1 % , 77.2 % , respectively. In the result of male speakers, the discriminant rate did not suggest any effect from speech rate.
As mentioned before, the number of devoiced vowels by male speakers was larger than that by female speakers. Figure 5 shows that the number of devoiced vowels by male speakers increases linearly as their speech rate becomes faster. On the other hand, devoiced vowels hardly appeared for female speakers. Thus, this suggests that the difference of discriminant rates between male and female speakers in read speech is related to devoicing.
5. Discussion
Our results showed that speech rate affects the overlapping of /o/
and /u/ for female speakers. In case of ‘fast’ rate, the lowest discriminant rate may be related to a narrowing of the vowel space due to coarticulation. It was also confirmed the overlaps of /o/ and /u/ even in ‘slow’ rate. However, the overlapping of the two vowels in ‘slow’ rate cannot be explained only by coarticulation. This indicated that other factors (e.g., sound change) also affect the overlaps of /o/ and /u/ in ‘slow’ rate. In other words, the overlapping of /o/ and /u/ in itself exist in spite of speech rate.
(a) Male speakers (%) (b) Female speakers (%)
V1\ V2 /o/ /u/ V1\V2 /o/ /u/
/o/ 72.7 27.3 /o/ 82.2 17.8
/u/ 16.0 84.0 /u/ 10.9 89.1
Table 7. Result of discriminant analysis of /o/ and /u/ for all speech rates by male and female speakers.
V1 means uttered vowels, V2 is discriminated vowel categories.
In relation to speech rate, a recent study showed that speaking rate by female speakers in their 20s was faster than older generation in read speech (Han et al., 2013). Thus, there is a possibility that generational differences in the overlapping of /o/ and /u/ (Han &
Kang, 2013) may be related to speaking rate. However, more in-depth analysis is required.
Igeta et al. (2014) has reported that the degree of overlapping of /o/ and /u/ by male speakers is less than female speakers. However, the current study shows that the overlapping of /o/ and /u/ by male speakers are larger than female speakers in read speech. Thus, this result differs from previous stsudies (Igeta & Arai 2011; Kang &
Han 2013; Han & Kang 2013; Igeta et al. 2014). Igeta et al. (2014) reported that isolated vowels did not affect degree of overlapping of /o/ and /u/, suggesting that isolated vowels have no effect of coarticulation. On the other hand, present study used read speech for analysis. We argue that it is the difference of the speech environments that affected the degree of overlapping of /o/ and /u/.
Results showed that the number of devoiced vowels was greater for male speakers than that for female speakers in read speech.
Thus, there is a possibility that Korean male speakers speak more unclear than female speakers in daily speech. Labov (1990) has been reported that unclear speech sounds more masculine. This sociolinguistic reason for sounding more masculine may explain the devoicing in the male speakers compared to the female speakers in read speech.
6. Conclusion
In this study, we examined whether speech rate influences the overlapping of back vowels /o/ and /u/ by young adult native speakers of Seoul dialect. For female speakers, discriminant analysis showed that the discriminant rate became lower as the speech rate increases from slow to fast. Thus, this indicates that speech rate is one of the factors associated with the overlapping of /o/ and /u/.
For male speakers, on the other hand, the discriminant rate was not correlated with speech rate, but the overlapping was larger than that of female speakers in read speech. Moreover, speech read by male speakers was less clear than by female speakers. However, we had limited data in this study and we will need to collect more data in order to understand this phenomenon more deeply.
In our future research on the overlaps of /o/ and /u/, we would like to examine generation differences between both young adult and older by using read speech.
Fast (%) Normal (%) Slow (%)
V1\ V2 /o/ /u/ V1\ V2 /o/ /u/ V1\ V2 /o/ /u/
/o/ 72.5 27.5 /o/ 70.0 30.0 /o/ 73.3 26.7
/u/ 5.5 94.5 /u/ 29.9 70.1 /u/ 18.9 81.1
Table 8. Result of discriminant analysis for the three levels of speech rates by male speakers.
V1 means uttered vowels, V2 is discriminated vowel categories.
Fast (%) Normal (%) Slow (%)
V1\ V2 /o/ /u/ V1\ V2 /o/ /u/ V1\ V2 /o/ /u/
/o/ 80.0 20.0 /o/ 80.0 20.0 /o/ 90.0 10.0
/u/ 15.2 84.8 /u/ 8.3 91.7 /u/ 8.3 91.7
Table 9. Result of discriminant analysis in three levels of speech rates by female speakers.
V1 means uttered vowels, V2 is discriminated vowel categories.
Figure 4. Mean of the discriminant rate in each of the speech rates by male and female speakers.
The error bars indicate standard error on each speech rate.
Figure 5. The ratio of tokens without devoiced tokens over total tokens for each speech rate by male and female speakers.
Acknowledgments
I would particularly like to thank Justine Hui from Sophia University for helpful comments and practical advice on this paper.
This work was partly supported by JSPS KAKENHI Grant Number JP15K16747. In addition, special thanks go to all speakers for production research.
References
Chae, S. (1995). External constraints on sound change: The raising of /o/ in Seoul Korean. Ph.D. Dissertation, Philadelphia:
University of Pennsylvania.
Chung, H., Makino, S., & Kido, K. (1988). Analysis and recognition of Korean isolated vowels using formant frequency. Journal of the Acoustic Society of Japan (E), 9(5), 225-232.
Han, J., & Kang, H. (2013). Cross-generational Change of /o/ and /u/
in Seoul Korean I. Phonetics and Speech Sciences, 5(2), 25-31.
Han, J., Kang, H., & Kim, J. (2013). Cross-generational differences of /o/ and /u/ in informal text reading. Phonetics and Speech Sciences, 5(4), 201-207.
Hirata, Y., & Whiton, J. (2005). Effects of speaking rate on the single/geminate stop distinction in Japanese. The Journal of the Acoustical Society of America, 118(3), 1647-1660.
Igeta, T., & Arai, T. (2011). A case study on comparison of male and female vowel formants by native speakers of Korean.
Proceedings of the 17th International Congress of Phonetic Sciences (pp. 934-937). Hong Kong, August, 2011.
Igeta, T., Sonu, M., & Arai, T. (2014). Sound change of /o/ in modern Seoul Korean: Focused on relations with acoustic characteristics and perception. Phonetics and Speech Sciences, 6(3), 109-119.
Kang, H., & Han, J. (2013). Cross-generational change of /o/ and /u/
in Seoul Korean Ⅱ: Spectral interactions in normalized vowel space. Phonetics and Speech Sciences, 5(2), 33-41.
Klatt, D. H. (1984). The new MIT speech VAX computer facility.
Speech Communication Group Working Papers IV, Research Laboratory of Electronics, MIT, Cambridge, 73-82.
Labov, W. (1990) .The intersection of sex and social class in the course of linguistic change. Language Variation and Change, 2, 205-254.
Moon, S. (2007). A fundamental phonetic investigation of Korean monophthongs. Malsori, 62, 1-17. (문승재 (2007). 한국어 단모 음의 음성학적 기반연구. 말소리, 62, 1-17.)
Port, R. F., Al-Ani, S., & Maeda, S. (1980). Temporal compensation and universal phonetics. Phonetica, 37, 235-252.
Suzuki, H. (2002). Report of the special research project for the typological investigation of languages and cultures of the east and west. Tsukuba: University of Tsukuba Press.
Tsao, Y. -C., Weismer, G., & Iqbal, K. (2006). The effect of intertalker speech rate variation on acoustic vowel space. The Journal of the Acoustical Society of America, 119(2), 1074-1082.
Van Son, R. J. J. H., & Pols, L. C. W. (1990). Formant frequencies of Dutch vowels in a text, read at normal and fast rate. The Journal of the Acoustical Society of America, 88(4), 1683-1693.
Van Son, R. J. J. H., & Pols, L. C. W. (1992). Formant movements of Dutch vowels in a text, read at normal and fast rate. The Journal of the Acoustical Society of America, 92(1), 121-127.
Yang, B. (1992). An acoustical study of Korean monophthongs produced by male and female speakers. The Journal of Acoustical
Society of America, 91(4), 2280-2283.
Yang, B. (1996). A comparative study of American English and Korean vowels produced by male and female speakers. Journal of Phonetics, 24, 245-261.
● Takako Igeta corresponding author
Faculty of Science and Technology, Sophia University 7-1 Kioi-cho, Chiyoda-ku, Tokyo 102-8554, JAPAN Email: [email protected]
● Sadao Hiroya
NTT Communication Science Laboratories, NTT Corporation 3-1 Morinosato-Wakamiya, Atsugi-shi, Kanagawa, 243-0198, JAPAN
Email: [email protected]
● Takayuki Arai
Faculty of Science and Technology, Sophia University 7-1 Kioi-cho, Chiyoda-ku, Tokyo 102-8554, JAPAN Email: [email protected]
Appendix
북풍과 태양
어느 날 북풍과 태양이 서로의 힘자랑을 하게 되었습니다.
‘저기 걸어가고 있는 사람의 외투를 벗기는 쪽이 이기는 걸로 하자’고 정하여 먼저 북풍이 시작하였습니다. 북풍은 자신 있 게 ‘한번 실력을 보여 주마’ 하고 말하며 세차게 바람을 일으켰 습니다. 그런데, 바람이 세어지면 세어질수록 그 사람은 외투 를 꽉 쥐어버렸습니다. 이번에는 태양의 차례가 되었습니다.
태양이 구름사이로 따뜻한 빛을 비추자 그 사람은 땀을 흘리기 시작했습니다. 게다가 태양이 빛을 강하게 하자 그 사람은 “더 워졌는데”하고 말하며 외투를 벗었습니다. 그렇게 해서 그 힘 자랑은 태양의 승리로 끝났습니다.