Adrenomedullin Deficiency Increases the Susceptibility of Liver Fibrosis Induced by CCl
4Ae-Ri Ji1, Meeyul Hwang1, Ah-Young Kim1,2, Eun-Mi Lee1,2, Eun-Joo Lee1,2, Myeong-Mi Lee1,2, Soo-Eun Sung1,2, Sang-Hyeob Kim1,2, Jin-Kyu Park1 and Kyu-Shik Jeong1,2*
1Department of Pathology, College of Veterinary Medicine, Kyungpook National University, Daegu 702-701, Korea
2Stem Cell Therapeutic Research Research Center, Kyungpook National University, Daegu 702-701, Korea Received January 8, 2015 /Revised January 27, 2015 /Accepted March 9, 2015
Adrenomedullin (AM) is a peptide expressed in all body tissues, and its related receptors are in- creased in liver fibrosis. In this study, we evaluated the effect of AM deficiency on liver fibrogenesis induced by CCl4 using AM heterozygous (HT) mice. The animals received a single injection of CCl4
or olive oil for the acute experiment, and received CCl4 or olive oil three times a week for 6 weeks for the chronic experiment. Fibrosis was accessed using histopathological analysis and the western blot. The AM HT mice showed mild pericentrilobular degeneration when compared to the AM wild type (WT) mice. In the acute experiment, there was no significant difference between the AM WT and AM HT mice. However, in the chronic experiment, the CCl4-treated AM HT mice showed more severe liver fibrosis than that of the CCl4-treated AM WT mice. The AST and ALT levels of the AM HT CCl4
group were higher than those of the AM WT CCl4 group. Additionally, the collagen deposition, α- SMA protein and TGF-β protein were increased in the AM HT CCl4 group when compared to the AM WT CCl4 group. The AM HT mice also exhibited severe lipid peroxidation through the GSH decrement. Taken together, our data suggest that AM deficiency increases the susceptibility to liver fibrosis induced by CCl4, indicating a novel therapeutic target for patients with liver fibrosis.
Key words : Adrenomedullin, lipid peroxidation, liver fibrosis, TGF-β
*Corresponding author
*Tel : +82-53-955-5975, Fax : +82-53-950-5955
*E-mail : [email protected]
This is an Open-Access article distributed under the terms of the Creative Commons Attribution Non-Commercial License (http://creativecommons.org/licenses/by-nc/3.0) which permits unrestricted non-commercial use, distribution, and reproduction in any medium, provided the original work is properly cited.
Journal of Life Science 2015 Vol. 25. No. 4. 463~472 DOI : http://dx.doi.org/10.5352/JLS.2015.25.4.463
Introduction
Liver fibrosis is a common manifestation of a variety of diseases such as alcohol-induced liver disease, viral hep- atitis, drug toxicity, right heart failure, primary biliary cir- rhosis and so on [9]. Liver is the principal site for CCl4-in- duced effects such as severe oxidative stress in mitochondria resulting in apoptosis or cirrhosis and necrosis [6, 9]. There is no specific receptor for the action of CCl4 in the liver, although CCl4 inactivates cytochrome p450 2E1 (CYP2E1) which metabolizes various compounds such as xenobiotics.
In addition, CCl3OO- radical results in lipid peroxidation and membrane damage [27]. When the liver is injured, quiescent hepatic stellate cells (HSCs) are stimulated by transforming growth factor-β (TGF-β) which is a key participant in the development of liver fibrosis [2], and activated with their
subsequent transformation to myofibroblastic cells. The acti- vated HSCs are characterized by overproduction of ex- tracellular matrix proteins such as collagen [14, 17]. The rela- tion between oxidative stress and collagen overproduction was first proposed in 1989 [4]. Hydroxyl radicals and perox- ynitrite stimulate lipid peroxidation (LPO), which induce collagen expression and synthesis [21].
Adrenomedullin (AM) is a 54 amino acid peptide dis- covered in human pheochromocytoma extracts. It has been known to have several biological activities such as a circulat- ing hormone and a vasodilator. AM is expressed in most tissues including peripheral blood monocytes and endothe- lial cells [7]. In fact, it has been thought to play an important role in the regulation of vascular tone and stability under physiological or pathological cellular conditions [8, 26], and to be closely involved in the formation of blood vessels, called angiogenesis [12, 22]. AM-induced angiogenesis is car- ried out through the activation of phosphatidylinositol-3 kin- ase (PI3K), mitogen-activated protein kinase (MAPK) and fo- cal adhesion kinase (FAK) in endothelial cells [12]. In addi- tion, AM reduces vascular permeability increased by re- active oxygen species, endotoxins or cytokines, thus limiting the formation of inflammatory exudates [18]. Moreover, AM
A B
C D E
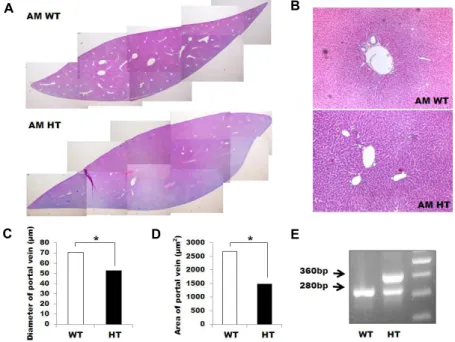
Fig. 1. Histopathologic characteristics of AM transgenic mouse. (A) Histologic pic- ture of control group mouse liver. (B) Histopathologic feature of the portal triad of AM WT control mouse and AM HT control. H&E stain. Original magnification: ×400. (C) The diameter of portal veins was measured in five fields (×200) per each five mice of AM HT and AM WT group. (D) The pre- sumptive area of the portal vein is rep- resented based on the result of (B) and the mathematical equation, πr2. *p<0.05.
(E) Genotyping of AM HT mouse.
is been known as a survival factor against hypoxia-induced cell death. It has been reported to protect epithelial cells from hypoxia/ reoxygenation-induced cells by suppressing the generation of reactive oxygen species (ROS) via gluta- thione (GSH) production [11].
Here, we evaluated the effect of AM deficiency using AM heterozygous mice in a liver fibrosis animal model.
Materials and Methods
Animals and experimental design
AM heterozygous (AM+/-, AM HT) mice were used for this experiment because AM homozygous (AM-/-) is lethal within the uterus for unknown reason [11]. AM HT mice have approximately 50% of the serum and organ concen- trations of AM compared to wild type (WT) mice [25]. To distinguish the genotypes of AM WT from AM HT type, the genomic DNA of mice was purified from the mouse-tail tissue and PCR was performed with the primers P1 (5’-GGCTCCTTAAGTTGCGCA-3’) and P2 (5’-ACGTAGAA- GAACTTATTAA -ACCGCA-3’) (Fig. 1E). The animals were kept in a room at 22±2℃ and 50±10% relative humidity in a 12 hr light-dark cycle and fed standard laboratory chow and water, ad libitum. Chow was withheld from all mice 12 hr before being euthanized. Animal procedures were per- formed in accordance with the National Institutes of Health (NIH, Bethesda, USA) guidelines for the care and use of lab- oratory animals and approved by the Kyungpook National University Institutional Animal Care for the care and use
of laboratory animals [Approval No. : KNU 2009–48].
Induction of acute and chronic liver fibrosis For acute fibrosis, 15-week-old male AM WT mice (n=10) and AM HT mice (n=10) received a single injection of CCl4
(40% in olive oil, 1ml/kg). For chronic fibrosis, 7-week-old male AM WT mice (n=20) and AM HT mice (n=20) were injected with CCl4 (50% in olive oil) for 6 weeks, three times a week. The animals in the acute experiment were euthan- ized 24 hr after CCl4 injection.
Serum biochemical measurements
Serum ALT and AST concentrations were analyzed with the IFCC UV method (ADVIA, Bayer, USA), using commer- cial reagents, respectively.
Histopathology and immunohistochemistry
Hematoxylin and Eosin (H&E) staining and Masson’s Trichrome (MT) staining were done to detect collagen. The diameter of the portal veins varied depending on how it was cut; therefore, the minor axis was used to precisely measure the diameter. Image J software (National Institute of Health, Bethesda, MD, USA) was used to estimate the diameter and the coagulative centrilobular necrosis area. The area of the cross section of the portal veins was calculated mathematically: πr2. The grade of portal fibrosis and peri- sinusoidal fibrosis was determined using blind assessment by four pathologists following the grading system of Mendier MH et al. [16]. The sections were immunostained
with anti-α-SMA antibody (Sigma, St Louis, MO, USA) and anti-CYP2E1 antibody (Chemicon International Inc., Teme- cula, CA, USA). The avidin–biotin peroxidase complex method (Vector Laboratories, Burlingame, CA, USA) with 3, 3-diaminobenzidine (Zymed laboratories Inc., San Francis- co, CA, USAS) was used to visualize the antigen–antibody complex. For a negative control, the primary antibody was replaced by phosphate-buffered saline.
Terminal deoxynucleotidyl transferase-mediated nick-end labeling (TUNEL) assay
TUNEL assay was carried out to detect apoptotic cells us- ing an in situ cell death detection kit (Roche, Indianapolis, IN). The cells were reacted with proteolytic enzyme (20 μg/
ml of proteinase K) and rinsed with deionized distilled water (DDW). Then, the cells were reacted with a TdT mixture at 37°C for 1 hr, containing the following: 200 mmol/l potas- sium cacodylate; 25 mmol/l Tris-HCl (pH 6.5); 0.25 g/l bo- vine serum albumin; 1 mmol/l COCl2; 5 mmol/l biotin- dUTP; and 100 U/ml TdT. After being rinsed with PBS, the cells were stained with an NBT/BCIP detection kit (Prome- ga, WI, USA).
Immunoblotting
The concentration of liver protein was measured using the Bradford assay (Sigma). Equal amounts of proteins were separated by SDS–polyacrylamide gel electrophoresis. For immunoblotting, the proteins were electro-transferred to a PVDF membrane (Schleicher & Schuell, Dassel, Germany).
Primary antibodies were applied to the membrane: anti- α- smooth muscle actin (α-SMA) antibody (Sigma), anti- CYP2E1 antibody (Chemicon International), anti-TGF-β1 an- tibody (Santa Cruz Biotechnology Inc., Santa Cruz, CA), anti- Glutathione peroxidase (GPx) antibody (Santa Cruz Biotech- nology). Beta-tubulin was used as an internal standard protein. Blots were incubated with a horseradish perox- idase-conjugated anti-mouse and rabbit IgG (Santa Cruz Biotechnology). For detection, the Super Signal West Dura Extended Duration Substrate (Thermo Fisher Scientific Inc, Rockford, IL, USA) was used and exposed to Medical X-ray Film (Kodak, Rochester, NY, USA). The band intensities were quantified using the Image J software (NIH).
Detecting hepatic hydroxyproline (HYP) content The same volume of liver tissue homogenates in 6N HCl was hydrolyzed at 110°C for 16 hr. The hydrolysate was fil-
tered, and aliquots were evaporated under a vacuum. The sediment was dissolved in isopropanol and incubated in 0.84% chloramines-T in an acetate-citrate buffer (pH 6.0) for 10 minutes at room temperature. Subsequently, Ehrlich’s re- agent was added and the mixture was incubated at 60°C for 25 minutes. The absorbance of the sample solution was measured at a wavelength of 560 nm (Tecan Instruments, Salzburg, Austria). The HYP content was calculated from a standard curve of 4-hydroxy-L-proline (Sigma).
Quantitation of ROS in the liver
Liver tissue homogenates with arachidonic acid were in- cubated for 5 min. 2′, 7′-dichlorodihydrofluorescein diac- etate (DCFDA) was added to the liver homogenates in a 50 mM phosphate buffer. Changes in fluorescence intensity were evaluated every 5 min for 30 min with excitation and emission wavelengths of 485 and 530 nm, respectively (Genius, Tecan Instruments).
Glutathione (GSH) and oxidized glutathione (GSSG) assays
The method of Pandey and Katiyar [19] was used for the GSH and GSSG assays. Liver tissues with meta-phosphoric acid were centrifuged, and the supernatant was used for the assay. For the GSH assay, o-phthalaldehyde was added and then 1 mM EDTA/50 mM phosphate buffer was added. The fluorescence was measured at an excitation and emission wavelength of 360 nm and 460 nm, respectively. For the GSSG assay, the supernatant with N-ethylmaleimide was pre-incubated for 20 min and 0.1 M NaOH was added. The fluorescence was measured the same way as GSH.
TBARS assay for Lipid peroxidation (LPO) as- sessment
The content of hepatic thiobarbituric acid-reactive sub- stances (TBARS) was determined to assess LPO. The liver homogenates with 8.1% SDS, 20% acetic acid and 1.2% 2-thi- obarbituric acid (TBA) were heated for 30 min at 95°C. After cooling, n-butanol was added and the mixture was centrifuged. Then, the supernatant was evaluated at a wave- length of 550 nm and expressed as nanomoles of ma- londialdehyde (MDA).
Statistical analysis
The results are expressed as the means ± S.D. To compare values obtained from the two groups, Student t test was
A B
C D
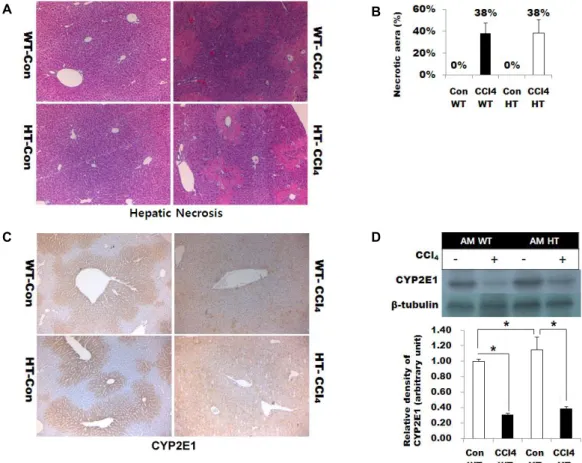
Fig. 2. Acute CCl4-induced liver injury. (A) Histologic picture of acute experiment. H&E staining. Original magnification: ×200.
CCl4 treated AM WT mouse and AM HT mouse showed wide-spread centrilobular necrosis with intact periportal areas.
(B) The area of centrilobular necrosis was measured in five fields (×200) from five mice for the AM HT and AM WT groups by Image J. (C) Immunohistochemistry of CYP2E1. The CYP2E1 expression was decreased in the CCl4 treated group in both the AM WT and AM HT group. Original magnification: ×400. (D) Immunoblot analysis of CYP2E1. The graph exhibits relative band densities normalized with α-tubulin. Data are shown as the mean ± SD. *p<0.05.
done. A value of p<0.05 or p<0.01 was considered significant.
Results
Histopathologic characteristics of AM HT mice First, we investigated the histopathologic characteristics of the AM HT mice. The AM HT mice showed mild pericen- trilobular hepatocellular hypertrophy compared to AM WT mice (Fig. 1A). Pericentrilobular hepatocytes were mildly hy- pertrophic and had a hypereosinophilic cytoplasm and en- larged nucleus (Fig. 1B), which is the characteristics of peri- centrilobular degeneration. The diameter of the portal veins in the AM HT mice was approximately two thirds of the AM WT mice (Fig. 1C). Furthermore, the presumptive area of the portal vein from the AM WT mice was approximately twice as much as the AM HT mice (Fig. 1D).
Acute CCl4-induced liver injury
Next, we examined the effect of AM deficiency on acute CCl4-induced liver injury. As shown in Fig. 2A, wide-spread centrilobular necrosis and coagulative necrosis of hep- atocytes occurred in the CCl4 treated WT and HT groups.
The inflammatory cells had not been recruited yet at 24 hr after acute treatment (Fig. 2A). The liver necrosis area of both groups was 38% of the total liver area (Fig. 2A and 2B). CCl4-induced inactivation of CYP2E1 was examined by immunohistochemistry and immunoblot data. CYP2E1 ex- pression decreased in both AM WT and AM HT treated with CCl4 (Fig. 2C and 2D). Thus, there was no significant change in the AM WT and AM HT mice after acute CCl4 treatment.
Chronic CCl4-induced liver injury
H&E stained liver showed abnormal hepatic architecture with bridging fibrosis between the central veins and in peri- portal region, necrotic hepatocytes, and multifocally in-
A B
C D
Fig. 3. Chronic CCl4-induced liver injury. (A) Histologic picture of chronic experi- ment. H&E staining. Original magnifi- cation: ×200. CCl4 treated AM WT mouse and AM HT mouse showed col- lagen accumulation between the central veins and necrotic changes. (B) Serum biochemistry of GOT and (C) GPT. The most damage was found in the AM HT CCl4 treated group. (D) TUNEL assay.
No apoptosis occurred in the CCl4 treat- ed mouse. Original magnification: ×200.
(E) Immunoblot analysis of CYP2E1.
The graph shows the relative band den- sities normalized with α-tubulin. The expression of the CYP2E1 was decre- ased in the CCl4 treated group and the magnitude of the decrease in the AM HT group is twice as much as the AM WT group. *p<0.05, **p<0.01
creased inflammatory cells in the groups (Fig. 3A). The WT group showed milder fibrosis than HT group with CCl4
treatment. Notably, the CCl4 treated AM HT mice show hep- atic spongiosis from HSCs degeneration. The degenerative HSCs are characterized by anisocytosis and cyst-like struc- tures that contain foamy granular eosinophilic materials in the cytoplasm (Fig. 3A, black arrows). The serum AST and ALT level were increased by chronic exposure to CCl4. The average level of AST and ALT of AM HT group was higher than those of AM WT group in CCl4 treated mice (Fig. 3B).
TUNEL staining is negative on liver parenchyma in both groups, yet is positive on few HSCs in AM HT groups (Fig.
3C). Immunoblot data of CYP2E1 displayed a declined level in the CCl4 treated groups (Fig. 3D). Reduction of CYP2E1 expression in the CCl4 treated group was detected in both AM WT mice and AM HT mice. The relative protein level of CYP2E1 in the AM HT control mice was approximately twice as much as the AM WT control mice (Fig. 3D). Also, CYP2E1 protein level of AM HT CCl4 group was about 20%
of that of AM HT control whereas AM WT CCl4 group showed about 50% of AM WT control.
Liver fibrosis was promoted in the AM HT mouse MT staining shows collagen fibers as blue and smooth muscles as red. The accumulation of collagen in the AM HT CCl4 treated group occurred to a greater extent compared to the AM WT CCl4 treated group (Fig. 4A). The fibrosis grade was evaluated based on the MT stained histological
data. For an objective estimate of fibrosis scoring, four path- ologists graded liver fibrosis through a blind assessment.
The control groups revealed no fibrotic changes. However, the CCl4–treated AM WT group (grade 2.43 by portal fib- rosis grading) showed fibrous expansion into most portal areas, with or without short fibrous septa, and (grade 0.8 by perisinusoidal fibrosis grading) represented perivenular and/or periportal involvement of some lobules. The CCl4
treated AM HT group exhibited severe fibrosis (grade 4.55 for portal fibrosis grading and grade 1.6 for perisinusoidal fibrosis grading) (Fig. 4B and 4C).
The number of α-SMA-immunopositive cells were in- creased in the CCl4 treated group around the central vein branches and portal area (Fig. 4D). Compared to the AM WT CCl4 group, the AM HT CCl4 group exhibited intensely stained α-SMA positive, and active HSCs were observed in the liver parenchyma. Additionally, α-SMA positive cells in the AM WT control and AM HT control mice were hardly detected in the liver by immunohistochemistry (Fig. 4D). In agreement with the immunohistochemistry data, the im- munoblot data showed a significant increase in α-SMA pro- tein expression in the CCl4 treated groups, especially in the AM HT CCl4 group. The protein level of α-SMA in the AM WT CCl4 mice increased approximately 5-fold compared to the AM WT control mice (Fig. 4E). And the AM HT CCl4
group showed about a 7-fold increase compared to the AM HT control (Fig 4E). The hepatic hydroxyproline (HYP) con- tent in the CCl4 treated groups was significantly higher than
A
B C
D E
F G
Fig. 4. Hepatic fibrosis was promoted in the AM HT mice. (A) Histopathologic pictures of Masson’s Trichrome staining. Collagen fibers shown as blue areas was more intensive in the CCl4 treated AM HT group compared to the CCl4 treated AM WT group. Original magnification: ×200. (B, C) Fibrosis grade. (D) Immunohistochemical analysis of α-SMA. CCl4 treated groups showed an increased level of α-SMA, which represents activated HSCs. Original magnification: ×200. (E) Immunoblot analysis for α-SMA. (F) The relative expression level of α-SMA in the immunoblots. The graph represents the relative band densities normalized with α-tubulin. (G) Relative HYP level was standardized in the AM WT control group. The HYP level of the CCl4 treated groups was similar in the AM WT and AM HT groups. Data is represented as the mean ± SD. *p<0.05, **p<0.01
those in the control groups (Fig. 4F). The HYP level of the AM WT CCl4 and the AM HT CCl4 groups showed no differences. TGF-β expression was significantly up-regulated after CCl4 administration in both the AM WT and AM HT groups. The TGF-β expression in the AM HT CCl4 group was about 2.5-fold higher than that of the AM WT CCl4
group (Fig. 4G).
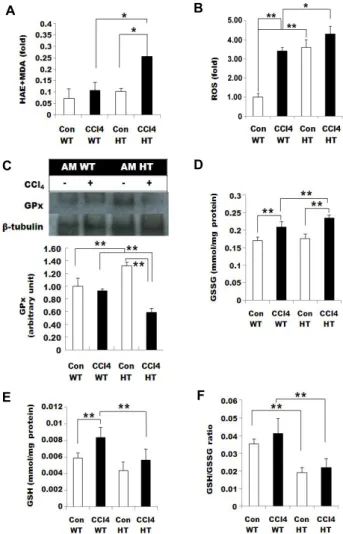
Lipid peroxidation increased in the AM HT mouse MDA and HAE, ROS, GPx, GSH, GSSG, and GSH/GSSG were examined to assess lipid peroxidation (LPO) in AM WT and AM HT mice. The MDA and HAE levels derived from the LPO process were increased in the livers of the CCl4 administered groups compared to the control groups.
However, the AM HT CCl4 group displayed a dramatically and significantly higher level of MDA and HAE (Fig. 5A).
In the AM WT group, a significant increase in ROS was trig- gered by CCl4 treatment. However, the AM HT group gen- erated substantial amounts of ROS in both the control and CCl4 groups (Fig. 5B). The GPx protein level showed no dra- matic changes induced by CCl4 treatment in the AM WT mice (Fig. 5C). However, the GPx protein level decreased because of the CCl4 treatment in the AM HT mice. In addi- tion, the AM HT control mice showed a significant increase in the GPx protein level compared to the AM WT control mice. The GSSG level was augmented in the CCl4 treated groups, which showed a higher concentration in the AM HT CCl4 than in the AM WT CCl4 groups (Fig. 5D). The GSH
A B
C D
E F
Fig. 5. Lipid peroxidation was increased in the AM HT mouse.
(A) Lipid peroxidation level was investigated via ma- londialdehyde (MDA) and 4-hydroxyalkenals (HAE). (B) The ROS level was increased because of the CCl4 treat- ment and AM deficiency. (C) Immunoblotting assay for GPx. GPx was decreased in the treated groups. The rela- tive GPx expression normalized with α-tubulin (D) GSSG level increased after CCl4 treatment. (E) GSH level in- creased from the CCl4 treatment. (F) GSH/GSSG ratio was increased in the CCl4 treated group; the ratio of the AM HT groups was almost half of that of the AM WT groups. Data are represented as the mean ± SD. *p<0.05,
**p<0.01.
level of the CCl4 treated groups was increased in both geno- types (Fig. 5E). The tendency of the control group and the CCl4 treated group of the AM HT mouse was similar to that of the AM WT mouse, though the level of GSH in the AM HT groups was reduced. Therefore, the ratio of GSH and GSSG in the AM HT groups represented approximately half the level of GSH and GSSG in the AM WT groups (Fig.
5F).
Discussion
This study investigated the effect of AM deficiency in liv- er fibrosis using AM heterozygous type (HT) mice. We dem- onstrated that (1) AM heterozygous mice have smaller vas- cular size and reduced angiogenesis in the liver compare to control mice; (2) AM HT mice show little differences from AM WT mice for acute CCl4 treatment; (3) AM deficiency increases the accumulation of proteins related to fibrosis such as α-SMA, TGF-β and collagen and enhances lipid per- oxidation by suppressing GSH activity, resulting in in- creased fibrosis in the liver.
As shown in Fig. 1A and 1B, small vascular formations -suppressed angiogenesis- in the liver were present. The re- duced lumen diameter of vessels generally causes an in- crease in peripheral resistance, which is one of the key char- acteristics of hypertension [24]. Indeed, the AM HT CCl4 treated mice showed less fibrosis when losartan, a drug to treat hypertention by antagonizing antiotensin II receptor, was applied (unpublished data). Additionally, AM is consid- ered a hypoxia-regulated gene because AM is increased in hypoxic hepatocytes and protects organs from hypoxia and hypertensive injury from such as liver transplantation [5].
Therefore, the liver of the AM HT mouse could be assumed to be hypoxic with hypertension condition, susceptible to injury.
To elucidate the effect of AM on liver injury, we designed and performed two types of experiments: acute and chronic.
AM WT and AM HT groups exhibited little differences in liver injury induced by a single injection of CCl4 in the acute experiment (Fig. 2). AM would not have a critical effect on acute liver injury. However, the AM HT group showed vul- nerability to liver injury in the chronic experiment (Fig. 3).
Repeated CCl4 injections triggered more severe biochemical changes (ALT and AST) in the AM HT mice. A substantial decrease in CYP2E1 expression was detected in the AM HT CCl4 mice, which represents reduced capacity to metabolize chemical compounds and vulnerability to liver injury in- duced by CCl4 in AM HT mice. Additional, TUNEL staining is negative on liver parenchyma and positive on a few HSCs.
The HSCs located in perisinusoids is considered as non-pa- renchymal cells in liver. This confirms that the liver under- goes not apoptosis but necrosis by CCl4 treatment.
As shown in Fig 4, liver fibrosis was exacerbated in the AM HT mouse. Histopathologic data as well as Western blot analysis confirmed the promoted liver fibrosis in the AM
HT mice (Fig. 4). Collagen accumulation, α-SMA protein and TGF-β protein in the AM HT CCl4 mice were more than two times as much as that in the AM WT CCl4 mice. The excessive accumulation of fibrotic proteins was consistent with the fibrosis grade data (Fig 4B and 4C). On the other hand, the TGF-β protein level in the AM HT control group was similar to the AM WT CCl4 group and was higher than that of the AM WT control group (Fig. 4G). However, the AM HT group did not show any fibrotic changes compared to the AM WT group. There was little collagen staining and almost a ‘0’ fibrosis grade in the AM HT control group. In addition, the hydroxyproline level of this group was same as that of the AM WT control group. Thus, this TGF-β in- crease did not seem to be directly related to liver fibrosis.
Recently, Masuoka et al. reported that TGF-β production was significantly increased under hypoxia condition in vitro, stimulating epithelial-mesenchymal transition (EMT) of gas- tric cancer. TGF-β induced EMT transformed gastric cancer cells into spindle-shaped cells which might be responsible for the initial invasion and metastasis of cancer [15]. Based on a previous report and our data, we assumed that mild hypoxia condition due to AM deficiency could trigger TGF-β production in the AM HT control mice. As we mentioned above, AM function is closely associated to hypoxia [5]. The AM HT mice had narrow vessels and a small number of vessels (Fig. 1). Thus, we hypothesized that the down-regu- lated AM protein forces the liver to a mild hypoxia con- dition, resulting in an increase of TGF-β production and fi- broblast deposition. An elevated basal level of TGF-β could give the AM HT mice susceptibility to fibrosis. However, to evaluate our hypothesis, further study should be needed.
Because lipid peroxidation is considered as one of the hy- poxia characteristics of AM deficient mice, we examined lip- id peroxidation (LPO). MDA and HAE derived from the LPO process were significantly increased in the AM HT CCl4
group. In addition, there was a slight increase in MDA and HAE in the AM WT CCl4 group and the AM HT control group (Fig. 5A). Because the generation of free radicals in- duces the LPO process, we examined ROS production. The ROS level was greatly increased in the AM HT mice and the AM WT CCl4 group. Previous reports have shown that AM plays a role as an antioxidant in two ways: suppressing ROS production [1, 3, 8]and promoting the ROS scavenging system [10]. Consequently, the increased ROS might be due to the down-regulated AM.
Next, the ROS scavenging system such as GPx, GSH,
GSSG and GSH/GSSG was investigated. GSH is a key regu- lator of cellular redox and is involved in the maintenance of interior cellular redox balance in mammals [10, 23].
Surprisingly, the GSH/GSSG level of the AM HT mice was almost half the level of the AM WT mice due to a decrease in the GSH level (Fig. 5D, 5E, 5F). The expression of GPx in the HT control group was enhanced compared to the WT control group and was greatly decreased after CCl4 treat- ment (Fig. 5I, 5J). An increased GPx expression in the AM HT control group may be a protective reaction from the en- hanced ROS. The diminished GSH/GSSG as well as GPx increased hydrogen peroxide and thus induced hydroxyl radicals, which is a source of LPO. Moreover, hydrogen per- oxide may also act as a vasodilator in many vascular beds under certain conditions [13, 20]. In summary, our findings suggest that AM can provide a novel therapeutic strategy in the development of medication for patients with liver fib- rosis or chronic liver disease.
Acknowledgement
This research was supported by Bio-industry Technology Development Program (312062-5) of iPET (Korea Institute of Planning and Evaluation for Technology in Food, Agricula- ture, Forestry and Fisherires), Ministry for Food, Agricul- ture, Forestry and Fisheries, Republic of Korea.
References
1. Alonso-Galicia, M. and Drummond, H. A. 1997. Inhibition of 20-HETE production contributes to the vascular re- sponses to nitric oxide. Hypertension 29, 320-325.
2. Biernacka, A., Dobaczewski, M. and Frangogiannis, N. G.
2011. TGF-β signaling in fibrosis. Growth Factors 29, 196-202.
3. Chini, E. N., Chini, C. C., Bolliger, C., Jougasaki, M., Grande, J. P., Burnett, J. C. Jr. and Dousa, T. P. 1997. Cytoprotective effects of adrenomedullin in glomerular cell injury: central role of cAMP signaling pathway. Kidney Int. 52, 917-925.
4. Chojkier, M., Houglum, K., Solis-Herruzo, J. and Brenner, D. A. 1989. Stimulation of collagen gene expression by as- corbic acid in cultured human fibroblasts. A role for lipid peroxidation? J. Biol Chem. 264, 16957-16962.
5. Garayoa, M., Martínez, A., Lee, S., Pío, R., An, W. G., Neckers, L., Trepel, J., Montuenga, L. M., Ryan. H., Johnson, R., Gassmann, M. and Cuttitta, F. 2000. Hypoxia-inducible factor-1 (HIF-1) up-regulates adrenomedullin expression in human tumor cell lines during oxygen deprivation: a possi- ble promotion mechanism of carcinogenesis. Mol. Endocrinol.
14, 848-862.
6. Haouzi, D., Lekéhal, M., Moreau, A., Moulis, C., Feldmann,
G., Robin, M. A., Lettéron, P., Fau, D. and Pessayre, D. 2000.
Cytochrome P450-generated reactive metabolites cause mi- tochondrial permeability transition, caspase activation, and apoptosis in rat hepatocytes. Hepatology 32, 303-311.
7. Hinson, J. P., Kapas, S. and Smith, D. M. 2000.
Adrenomedullin, a multifunctional regulatory peptide.
Endocr. Rev. 21, 138-167.
8. Iimuro, S., Shindo, T., Moriyama, N., Amaki, T., Niu, P., Takeda, N., Iwata, H., Zhang, Y., Ebihara, A. and Nagai, R. 2004. Angiogenic effects of adrenomedullin in ischemia and tumor growth. Circ. Res. 95, 415-423.
9. Kaplowitz, N. J. 2000. Mechanisms of liver cell injury.
Hepatology 32, 39-47.
10. Kim, J. Y., Yim, J. H., Cho, J. H., Kim, J. H., Ko, J. H., Kim, S. M., Park, S. and Park, J. H. 2006. Adrenomedullin regu- lates cellular glutathione content via modulation of gam- ma-glutamate-cysteine ligase catalytic subunit expression.
Endocrinology 147, 1357-1364.
11. Kim, S. M., Kim, J. Y., Lee, S. and Park, J. H. 2010. Adreno- medullin protects against hypoxia/reoxygenation-induced cell death by suppression of reactive oxygen species via thi- ol redox systems. FEBS Lett. 584, 213-218.
12. Kim, W., Moon, S. O., Sung, M. J., Kim, S. H., Lee, S., So, J. N. and Park, S. K. 2003. Angiogenic role of adrenome- dullin through activation of Akt, mitogen-activated protein kinase, and focal adhesion kinase in endothelial cells. FASEB J. 17, 1937-1939.
13. Liu, Y., Zhao, H., Li, H., Kalyanaraman, B., Nicolosi, A. C.
and Gutterman, D. D. 2003. Mitochondrial sources of H2O2 generation play a key role in flow-mediated dilation in hu- man coronary resistance arteries. Circ. Res. 93, 573-580.
14. Malhi, H. and Gores, G. J. 2008. Cellular and molecular mechanisms of liver injury. Gastroenterology 134, 1641-1654.
15. Matsuoka, J., Yashiro, M., Doi, Y., Fuyuhiro, Y., Kato, Y., Shinto, O., Noda, S., Kashiwagi, S., Aomatsu, N., Hirakawa, T., Hasegawa, T., Shimizu, K., Shimizu, T., Miwa, A., Yamada, N., Sawada, T. and Hirakawa, K. 2013. Hypoxia stimulates the EMT of gastric cancer cells through autocrine TGF-β signaling. PLoS ONE 8, e62310. doi:10.1371/
journal.pone.0062310
16. Mendler, M. H., Kanel, G. and Govindarajan, S. 2005.
Proposal for a histological scoring and grading system for non-alcoholic fatty liver disease. Liver Int. 25, 294-304.
17. Odena, G. and Bataller, R. 2012. Liver fibrogenesis: physi-
opathology. Gastroenterol. Hepatology 2, 3-9.
18. Onur, O. E., Guneysel, O., Akoglu, H., Denizbasi, A. and Onur, E. 2007. Adrenomedullin reduces the severity of cer- ulein-induced acute pancreatitis. Peptides 28, 2179-2183.
19. Pandey, A. and Katiyar, S. S. 1996. Inactivation of yeast glu- tathione reductase by O-phthalaldehyde. J. Enzyme Inhib. 11, 141-149.
20. Paravicini, T. M., Chrissobolis, S., Drummond, G. R. and Sobey, C. G. 2004. Increased NADPH-oxidase activity and Nox4 expression during chronic hypertension is associated with enhanced cerebral vasodilatation to NADPH in vivo.
Stroke 35, 584-589.
21. Parola, M., Pinzani, M., Casini, A., Albano, E., Poli, G., Gentilini, A., Gentilini, P. and Dianzani, M. U. 1993.
Stimulation of lipid peroxidation or 4-hydroxynonenal treat- ment increases procollagen alpha 1 (I) gene expression in human liver fat-storing cells. Biochem. Biophys. Res. Commun.
194, 1044-1050.
22. Sakimoto, S., Kidoya, H., Kamei, M., Naito, H., Yamakawa, D., Sakaguchi, H., Wakabayashi, T., Nishida, K. and Takakura, N. 2013. An angiogenic role for adrenomedullin in choroidal neovascularization. PLoS One 8, e58096.
23. Schafer, F. Q. and Buettner, G. R. 2001. Redox environment of the cell as viewed through the redox state of the gluta- thione disulfide/glutathione couple. Free Radic. Biol. Med.
30, 1191-1212.
24. Schiffrin, E. L. and Touyz, R. M. 2004. From bedside to bench to bedside: role of renin-angiotensin-aldosterone sys- tem in remodeling of resistance arteries in hypertension.
Am. J. Physiol. Heart Circ. Physiol. 287, H435-46.
25. Shimosawa, T., Matsui, H., Xing, G., Itakura, K., Ando, K.
and Fujita, T. 2003. Organ-protective effects of adrenome- dullin. Hypertens. Res. 26, S109-112.
26. Shindo, T., Kurihara, Y., Nishimatsu, H., Moriyama, N., Kakoki, M., Wang, Y., Imai, Y., Ebihara, A., Kuwaki, T., Ju, K. H., Minamino, N., Kangawa, K., Ishikawa, T., Fukuda, M., Akimoto, Y., Kawakami, H., Imai, T., Morita, H., Yazaki, Y., Nagai, R., Hirata, Y. and Kurihara, H. 2001. Vascular abnormalities and elevated blood pressure in mice lacking adrenomedullin gene. Circulation 104, 1964-1971.
27. Weber, L. W., Boll, M. and Stampfl, A. 2003. Hepatotoxicity and mechanism of action of haloalkanes: carbon tetra- chloride as a toxicological model. Crit. Rev. Toxicol. 33, 105- 136.
초록:아드레노메둘린 결핍은 사염화탄소로 유도된 간경화 감수성을 상승시킴
지애리1․황미열1․김아영1,2․이은미1,2․이은주1,2․이명미1,2․성수은1,2․김상협1,2․박진규1․정규식1,2*
(1경북대학교 수의과대학 병리학교실, 2경북대학교 줄기세포연구소)
아드레노메둘린은 모든 조직에서 발현되는 펩타이드로 이 펩타이드 수용체가 간경화 유발 시 증가된다. 이번 연구에서는 사염화탄소(CCl4) 투여로 유도되는 간경화에서 아드레노메둘린의 효과를 아드레노메둘린 유전자 한 쪽이 결핍된 생쥐에서 관찰하였다. 사염화탄소를 일회투여 받은 급성 군과 6주 동안 지속적으로 투여 받은 만성군 으로 나누어 효과를 관찰하였다. 간경화 정도는 병리조직적 검사와 웨스턴 블롯 방법을 사용하여 측정하였다. 급 성에서는 결핍된 생쥐와 야생형 생쥐에서 별다른 차이점이 없었다. 만성의 경우 아드레노메둘린이 결핍된 생쥐에 서 심각한 간경화가 관찰되었다. 아스파르테이트 아미노전이요소(AST)와 알라닌 아미노전이요소(ALT) 수치가 아 드레노메둘린이 결핍된 생쥐 군에서 높게 관찰되었다. 간경화 마커 단백질인 콜라젠, 알파-SMA과 TGF-beta가 아 드레노메둘린이 결핍된 생쥐 군에서 높게 관찰되었다. 또한 아드레노메둘린 결핍 생쥐 군은 심각한 지질 과산화 반응이 확인되었고 이는 글루타시오 펄옥시다아제(GSH)의 감소가 원인이었다. 따라서 이 연구는 아드레노메둘린 의 결핍은 사염화탄소로 유도된 간경화 감수성을 증가시키는 것으로 결론할 수 있다. 이로써 아드레노메둘린은 간경화 새로운 치료 타겟으로 사용될 수 있음을 나타낸다.