서 론
1972년 Godfrey Hounsfield가 전산화 횡단 스캐닝 (Com- puterized Axial Transverse Scanning)의 새로운 영상기술을
개발하여 소개한 이래 이는 Computed Tomography (CT)라는 이름으로 진단을 위한 필수적인 영상기술이 되어 오늘에 이르고 있다. Hounsfield Units (HU)로도 불리는 CT number 는 사용되는 유효 스캐닝 에너지에서 건조한 공기를 -1000,25� C의 순수한 물을 0으로 설정한 두 점을 기준으로 직선
scale에 기초하여 상대적인 밀도를 표시한 것이다.
1-3cone- beam CT (CBCT)는 1990년대 말에 개발되어
4,5일반 CT보 다 상당히 낮은 방사선량, 높은 해상도로 악안면영역 골격 의 3차원 영상을 제공하여 급속한 관심 증가로, 특히 구강 악안면영역에서 폭발적인 사용의 증가가 이루어지고 있 다.5-8한편 임플란트 식립시 CT를 사용하여 골 밀도를 측정, 분 류하는 연구가 시도되었는데, Norton과 Gamble9은 주관적 인 골질 분류와 CT영상에서 측정한 HU로 나타낸 골밀도 범위를 연관시켜 quality 1은
+ + 850 이상, quality 2/3은 + + 500
에서 850사이, quality 4는 0에서+ + 500사이였다고 보고하였
접수일 (2010년 5월 15일), 수정일 (2010년 5월 24일), 채택일 (2010년 5월 28일)
Correspondence to : Prof. Eun-Kyung Kim
Department of Oral and Maxillofacial Radiology, School of Dentistry, Dankook University, San 7-1, Shinboo-dong, Cheonan, Chungnam, Korea
Tel) 82-41-550-1922, Fax) 82-41-556-7127, E-mail) [email protected]
Cone-beam CT와 multi-detector CT영상에서 측정된 CT number에 대한 비교연구
단국대학교 치과대학 구강악안면방사선학교실
김동수∙한원정∙김은경
Comparison of CT numbers between cone-beam CT and multi-detector CT
Dong-Soo Kim, Won-Jeong Han, Eun-Kyung Kim
Department of Oral and Maxillofacial Radiology, School of Dentistry, Dankook University ABSTRACT
Purpose : To compare the CT numbers on 3 cone-beam CT (CBCT) images with those on multi-detector CT (MDCT) image using CT phantom and to develop linear regressive equations using CT numbers to material density for all the CT scanner each.
Materials and Methods : Mini CT phantom comprised of five 1 inch thick cylindrical models with 1.125 inches diameter of materials with different densities (polyethylene, polystyrene, plastic water, nylon and acrylic) was used.
It was scanned in 3 CBCTs (i-CAT, Alphard VEGA, Implagraphy SC) and 1 MDCT (Somatom Emotion). The images were saved as DICOM format and CT numbers were measured using OnDemand 3D. CT numbers obtained from CBCTs and MDCT images were compared and linear regression analysis was performed for the density,
ρ (g/cm3), as the dependent variable in terms of the CT numbers obtained from CBCTs and MDCT images.
Results : CT numbers on i-CAT and Implagraphy CBCT images were smaller than those on Somatom Emotion MDCT image (p⁄0.05). Linear relationship on a range of materials used for this study were
ρ==0.001H+ + 1.07 with R
2value of 0.999 for Somatom Emotion,
ρ==0.002H+ + 1.09 with R
2value of 0.991 for Alphard VEGA,
ρ==0.001H+ + 1.43 with R
2value of 0.980 for i-CAT and
ρ==0.001H+ + 1.30 with R
2value of 0.975 for Implagraphy.
Conclusion: CT numbers on i-CAT and Implagraphy CBCT images were not same as those on Somatom Emotion MDCT image. The linear regressive equations to determine the density from the CT numbers with very high correla- tion coefficient were obtained on three CBCT and MDCT scan. (Korean J Oral Maxillofac Radiol 2010; 40 : 63- 68)
KEY WORDS : Tomography, Cone-Beam Computed; Tomography, X-ray Computed; CT number; Mini-CT Phantom
다. 또 Misch10는 골질이 가장 치밀한 D1은 1250 HU 이상,
D2는 850-1250 HU, D3는 350-850 HU, D4는 150-350 HU, D5는 150 HU 이하라고 제시하였다. 그 외에도 임플란트 식
립부위의 골 밀도 평가를 위해 의과용 CT영상에서 HU를 측정한 연구가 많이 보고된 바 있다.11-19한편 CBCT를 이용한 다양한 연구가 있었는데, Aranyar-
achkul 등
2은 NewTom사의 CBCT와 CT를 이용하여 HU를 측정한 연구에서 CBCT에서 측정한 골 밀도값이 CT에서 측정한 골 밀도값보다 높다고 보고하였다. 또 Hitachi사의CBCT영상에서 HU값을 측정한 Goo 등
19은 선학의 연구결 과와 비교하여 더 낮은 HU값을 보였다고 보고하였다.Lagravere 등
20,21은 NewTom사의 CBCT를 이용하여 HU로 부터 물질의 밀도를 환산하는 변환계수를 산출하여 보고 하였다. Han 등22은 두 종의 CBCT에서 CT 팬텀을 이용하여 영상 특성을 평가한 보고에서 동일 물질 블록의 CT number 가 의과용 CT영상에서 기대되는 number와 큰 차이를 보였 다고 보고하였다.이와 같이 CBCT영상에서의 CT number를 골질 평가 등 임상에 활용하고자 하는 경우가 많음에도 다양한 연구결 과들이 보고되고 있어, 본 연구에서는 밀도를 알고 있는 물 질로 구성된 mini CT QC 팬텀을 이용하여 3가지 기종의
CBCT영상에서 얻어진 CT number와 의과용으로 주로 사용
하는 multi-detector CT (MDCT) 영상에서 얻어진 CT number 를 비교하여 차이가 있는지 알아보고, 각 기종의 영상에서CT number로부터 물질의 밀도를 산출하는 직선회귀방정
식을 구해 보고자 하였다.재료 및 방법
1. 연구재료
polyethylene (밀도: 0.95), polystyrene (밀도: 1.05), plastic water (밀도: 1.03), nylon (밀도: 1.15), acrylic (밀도: 1.18) 물
질의 1.125인치 직경, 1인치 두께의 원통형 모델로 구성된mini CT QC 팬텀 (Fluke Biomedical, Cleveland, USA) (Fig. 1)
을 촬영에 이용하였다. 촬영기로 3가지 기종의 CBCT 즉 i-CAT (Imaging Sciences International, Hatfield, USA), Alphard VEGA (Asahi Röentgen Ind. Co., Ltd., Kyoto, Japan), Implag- raphy SC (Vatech Co., Ltd., Yongin, Korea)와 MDCT인 Somatom Emotion (Siemens Medical Systems, Forscheim, Germany)을 이용하였다.
2.
연구방법1) 3종의 CBCT와 1종의 MDCT영상 촬영
mini CT QC 팬텀을 하악 구치부의 임플란트 식립 전 평
가시 통상적으로 주는 조건 즉 Somatom Emotion은 130 kV,250 mAs, 1.5 sec, 10 mm slice thickness, i-CAT은 120 kV, 46.72 mAs, 40 sec, 0.25 mm voxel, scan dimension 직경 160 mm×높이 130 mm, Alphard VEGA는 80 kV, 5 mA, 17 sec, 0.39 mm voxel, C모드 직경 200 mm×높이 179 mm, Implag- raphy SC는 85 kV, 5 mA, 24 sec, 0.2 mm voxel, FOV 120×
90 mm의 조건으로 촬영하였다.
2) CT number 측정 및 비교 평가
각각의 촬영 후 raw data는 DICOM format으로 변환시켜
OnDemand 3D
TM(CyberMed Inc., Seoul, Korea) 프로그램에
서 밀도가 다른 여러 물질의 CT number를 polyethylene,polystyrene, plastic water, nylon, acrylic 물질은 CT영상의
각 원통형 모델의 중앙부에서 18×18 mm의 사각형의 관 심영역을, 공기는 팬텀의 중앙부의 작은 hole에서 7.5×7.5mm의 사각형의 관심영역을 설정하여 측정하였다. 10 mm slice 두께로 촬영한 MDCT의 영상을 기준으로 해서, CBCT
영상도 OnDemand 3DTM프로그램에서 10 mm thickness로 재구성하여 CT number의 측정이 이루어졌다. 동일한 조건 에서의 측정을 위해 i-CAT과 Alphard VEGA 영상은 polye-thylene, polystyrene, plastic water, nylon, acrylic 물질은 CT영
상의 각 원통형 모델의 중앙부에서 18×18 mm의 사각형의 관심영역을, 공기는 팬텀의 중앙부의 작은 hole에서 7.5×7.5 mm의 사각형의 관심영역을 설정하여 측정하였다. 단, Implagraphy 영상은 FOV가 작아 각 원통형 모델 중 nylon, acrylic
물질과 공기는 타 영상과 동일하게, polyethylene,polystyrene, plastic water은 14×5 mm의 사각형의 관심영역
을 설정하여 CT number의 평균값과 표준편차를 측정하였다(Fig. 2).
3종의 CBCT영상에서 측정된 CT number의 평균값을
Fig. 1. Mini CT QC phantom (Fluke Biomedical, Cleveland, USA)
has material inserts with different physical density.
MDCT영상에서 측정된 CT number의 평균값과 비교하고,
각 영상에서 얻어진 데이터를 직선회귀분석하여 CT num-ber를 종속변수로 하여 물질의 밀도
ρ (g/cm3)를 구하는 방
정식을 산출하였다. 또한 영상의 noise라 볼 수 있는 CTnumber의 표준편차를 3종의 CBCT영상과 MDCT영상에서
비교하였다.직선회귀분석과 paired t-test를 위한 통계프로그램으로
SPSS 12.0 for Windows (SPSS Inc., Chicago, USA)를 사용
하였다.결 과
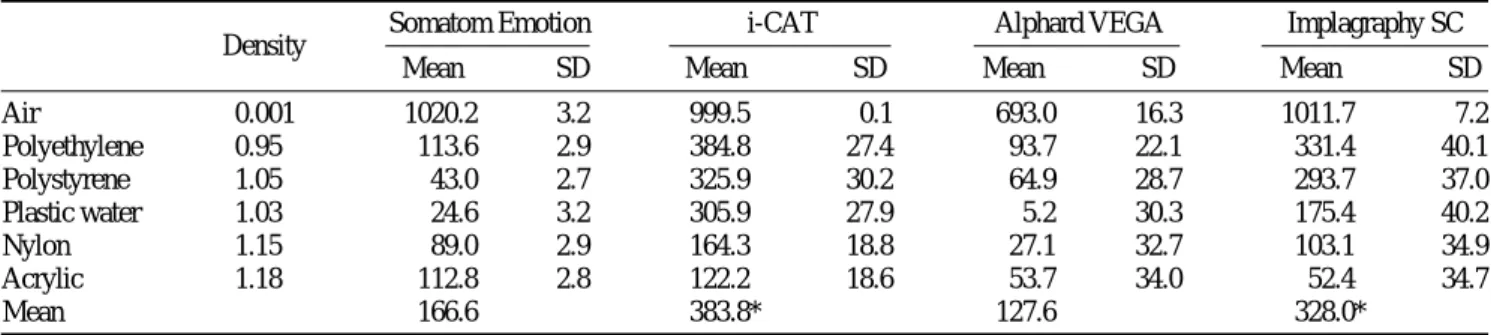
3종의 CBCT영상과 MDCT영상에서 측정된 CT number의
평균값과 표준편차는 Table 1과 같았다. i-CAT, Implagraphy
SC에서 측정된 CT number는 MDCT인 Somatom Emotion
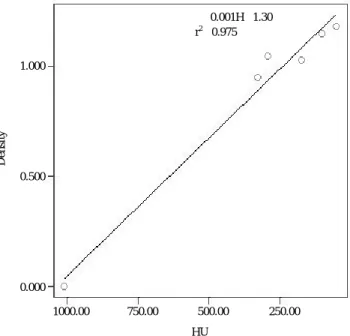
에서의 CT number보다 유의성 있게 작았다 (p⁄0.05).각 영상에서의 직선회귀방정식과 그래프는 Table 2, Figs.
3-6과 같았다. 모두 높은 결정계수를 보여 상관관계가 높
은 직선회귀방정식을 구할 수 있었으며, MDCT인 SomatomEmotion에서의 직선회귀방정식은
ρ==0.001H+ + 1.07, 결정계
수 0.999로 상관관계가 가장 높은 것으로 나타났으며 (Fig.3), Alphard VEGA에서의 직선회귀방정식은
ρ==0.002H+ + 1.09, 결정계수 0.991로 상관관계가 그 다음으로 높은 것으
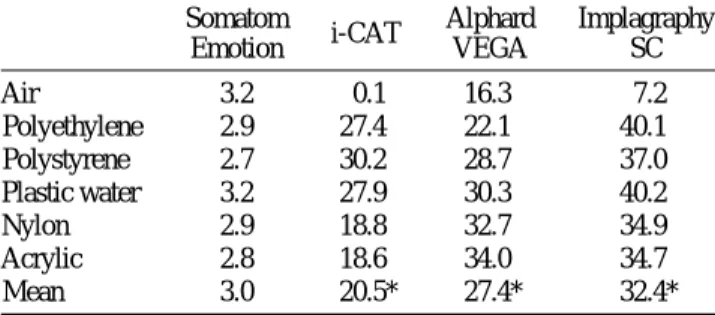
로 나타났다 (Fig. 5).3종의 CBCT영상과 MDCT영상에서 image noise를 나타
내는 CT number의 표준편차는 Table 3과 같았다. 3종의Fig. 2. Mean and SD of CT numbers on CBCT and MDCT images were obtained with OnDemand 3D
TMprogram.
Table 1. CT numbers of different density materials on 3 CBCT and MDCT images
Density Somatom Emotion i-CAT Alphard VEGA Implagraphy SC
Mean SD Mean SD Mean SD Mean SD
Air 0.001 -1020.2 3.2 -999.5 0.1 -693.0 16.3 -1011.7 7.2
Polyethylene 0.95 -113.6 2.9 -384.8 27.4 -93.7 22.1 -331.4 40.1
Polystyrene 1.05 -43.0 2.7 -325.9 30.2 -64.9 28.7 -293.7 37.0
Plastic water 1.03 -24.6 3.2 -305.9 27.9 5.2 30.3 -175.4 40.2
Nylon 1.15 89.0 2.9 -164.3 18.8 27.1 32.7 -103.1 34.9
Acrylic 1.18 112.8 2.8 -122.2 18.6 53.7 34.0 -52.4 34.7
Mean -166.6 -383.8* -127.6 -328.0*
*: statistically significant at 0.05 level
Table 2. Linear regression equations obtained on CBCT and MDCT images
Somatom Emotion i-CAT Alphard VEGA Implagraphy SC
Regression equation ρ= =0.001H
++1.07 ρ= =0.001H
++1.43 ρ= =0.002H
++1.09 ρ= =0.001H
++1.30
R square 0.999 0.980 0.991 0.975
CBCT에서 모두 MDCT 인 Somatom Emotion에서보다 유
의성 있게 크게 나타났다 (p⁄0.01).고 찰
임플란트 식립시 많은 치과의사들이 의과용 CT영상에서
CT number를 측정, 골 밀도를 평가하여 임상에 도움을 얻
고 있다.9,10그러나 최근 그 사용이 급격하게 증가하는
CBCT영상에서의 CT number는, 기종에 관계없이 일관성
있게 측정되는 CT영상과 달리 다양하게 나타나고 있어 그 해석에 있어서 주의가 요구되고 있다. 본 연구결과 3종의CBCT영상 즉 i-CAT, Implagraphy에서 측정된 CT number
는 MDCT인 Somatom Emotion에서의 CT number와 비교 해 볼 때, 공기를 제외한 모든 물질에서 현저히 작았으며,Fig. 4. Linear regression equations of density from CT numbers of
i-CAT CBCT image.
Density
HU
ρ= =0.001H
++1.43 r
2= =0.980
-1000.00 -750.00 -500.00 -250.00 1.000
0.500
0.000
Fig. 6. Linear regression equations of density from CT numbers of Implagraphy SC CBCT image
Density
HU
ρ= =0.001H
++1.30 r
2= =0.975
-1000.00 -750.00 -500.00 -250.00 1.000
0.500
0.000
Fig. 5. Linear regression equations of density from CT numbers of Alphard VEGA CBCT image.
Density
HU
ρ= =0.002H
++1.09 r
2= =0.991
-600.00 -400.00 -200.00 -0.00 1.000
0.750
0.500
0.250
0.000
Fig. 3. Linear regression equations of density from CT numbers of Somatom CT image.
Density
HU
ρ= =0.001H
++1.07 r
2= =0.999
-1000.00 -750.00 -500.00 -250.00 0.00 1.000
0.750
0.500
0.250
0.000
Alphard에서 측정된 값은 통계적으로 유의한 차이는 아니
었으나 nylon, acrylic에서 60 정도의 차이를 보였고, 특히 -1000 정도의 값을 보이는 공기의 CT number가 -693으로 나타났다. 연구에 사용한 mini CT QC phantom (Fluke Bio-medical, Cleveland, USA)에 사용된 물질은 polyethylene (밀도: 0.95 g cm
-3), polystyrene (밀도: 1.05 g cm
-3), plastic water (밀도: 1.03 g cm
-3), nylon (밀도: 1.15 g cm
-3), acrylic (밀도: 1.18 g cm
-3)으로서, 동일 회사에서 나온 CT perform- ance AAPM 팬텀의 매뉴얼에 의하면 예상되는 전형적인 CT number가 polyethylene은 -92, polystyrene은 -24, nylon
은+ + 92, acrylic은 + + 120이다. CT는 의료영상품질관리원에
서 매년 CT performance AAPM phantom을 이용한 영상 품 질관리검사를 해야 하는데, 그 중 CT number 직선성 항목 에서 CT number calibration block의 CT number가 제조사에 서 제시한 CT number의 ±10 HU 이내로 나타나야 한다고 규정하고 있다.23본 연구결과 Somtom Emotion은 전형적인CT number와 유사한 값을 보인 반면, CBCT영상은 기종에
따라 다 다른 값을 보였다. 많은 임상치과의사들이 임플란 트 식립 전에 골질을 평가할 때 Misch10가 제시한 CT num-ber에 의해 골질 분류를 하여 임상에 적용하고 있는데, 이
는 CBCT영상에서의 CT number가 아닌 CT영상에서의 수 치임을 반드시 기억해야 한다.한편 CBCT를 이용한 연구에서 NewTom사의 CBCT에 서 측정한 골 밀도값이 CT에서 측정한 골 밀도값보다 높 다고 보고되었고,2
Hitachi사의 CBCT영상에서의 HU값은
낮은 HU값을 보였다고 보고된 바 있다.19 본 연구에서도CBCT의 기종에 따라 제각기 다른 CT number를 보였는데,
이는 각 기종의 촬영 조건이 Somatom Emotion은 130 kV,250 mAs, i-CAT은 120 kV, 46.72 mAs, Alphard VEGA는 80 kVp, 5 mA, Implagraphy SC는 85 kVp, 5 mA로 모두 다른 관
전압으로 촬영된 것도 한 요인으로 생각되며, Swennen과Schutyser
24는 CBCT 시스템은 x선 감쇠가 유사한 구조물들 이 측정부위가 다를 때 다른 HU값을 보인다고 언급하였 다. 무엇보다 중요한 것은 CT는 CT performance AAPMphantom을 이용한 영상의 특성에 대한 품질관리기준이 명
확하여 CT number의 일관성, 재현성 등을 유지시키도록 하 는데 반해 늦게 개발되어 주로 치과임상에 활용되고 있는
CBCT는 제조회사들이 CT number의 통일성 및 일관성에
관심을 기울이지 않은 것이라 생각되며, 전 세계적으로CBCT영상의 품질관리를 위한 CBCT용 팬텀도 상용화 된
것이 없어 이에 대한 연구 개발이 시급하다고 생각된다.본 연구에서 각 영상의 CT number로부터 물질의 밀도를 환산하는 직선회귀방정식은 모두 높은 결정계수를 보여 상 관관계가 높은 직선회귀방정식을 구할 수 있었다. 특히
MDCT인 Somatom Emotion에서의 직선회귀방정식은
ρ==0.001H + + 1.07, 결정계수 0.999로 상관관계가 가장 높은 것으
로 나타났으며 Alphard, i-CAT, Implagraphy에서의 직선회 귀방정식 모두 결정계수가 0.975 이상으로 상관관계가 높은 것으로 나타났다. 이는 연구에 사용된 물질의 밀도 범위 내에서, 즉 0.001 g cm-3부터 1.18 g cm-3에서, 연구에 사용된 기종의 CT영상과 CBCT영상에서의 CT number와 물질의 밀도가 직선관계를 가져 환산이 가능하다는 것을 알려 준 다. 이는 Lagravere 등20,21이 NewTom사의 CBCT를 이용하 여 HU로부터 물질의 밀도를 결정할 수 있다는 보고와 일 치한다. 다만 연구에서 사용된 물질의 최고 밀도가 1.18 gcm
-3로, 예상되는 전형적인 CT number가+ + 120 정도로 낮아 CT number와 물질의 밀도가 직선관계를 보인 범위가 골
조직을 포함할 정도의 범위가 되지 못한 점이 이 실험의 한 계로 생각되며 차후 연구는 골조직을 포함할 정도에 해당 되는 높은 밀도를 보이는 물질을 포함시켜야 할 것으로 생 각된다.또한 마지막으로 살펴 본 CT영상과 CBCT영상에서 noise 를 나타내는 CT number의 표준편차는 3종의 CBCT에서 모두 CT인 Somatom Emotion에서보다 크게 나타나 CBCT 영상이 image noise가 크다는 사실을 확인할 수 있었다.
결론적으로, 3종의 CBCT영상 중 i-CAT과 Implagraphy
CBCT영상의 CT number는 MDCT영상에서의 CT number
와 같은 값을 보여주지 않았으며, 모든 기종에서 상관계수 가 높은 CT number로부터 밀도를 구하는 회귀방정식을 구 할 수 있었다.참 고 문 헌