Publications of the Korean Astronomical Society pISSN 1225-1534
32: 197 ∼ 199, 2017 March eISSN 2287-6936
2017. The Korean Astronomical Society. All rights reserved.c https://doi.org/10.5303/PKAS.2017.32.1.197
AKARI INFRARED CAMERA OBSERVATIONS OF THE 3.3 µm PAH FEATURE IN Swift/BAT AGNs Angel Castro1, Takamitsu Miyaji1,2, Mai Shirahata3,4, Kohei Ichikawa5, Shinki Oyabu6, David Clark1,
Masatoshi Imanishi7, Takao Nakagawa4, and Yoshihiro Ueda5
1Instituto de Astronom´ıa, Universidad NacionalAut´onoma de M´exico (UNAM), Ensenada, Baja California, M´exico
2University of California, San Diego, Center for Astrophysics and Space Sciences, La Jolla, CA 92093-0424, USA
3National Astronomical Observatory of Japan (NAOJ), 2-21-1 Osawa, Mitaka, Tokyo 181-8588, Japan
4Institute of Space and Astronautical Science (ISAS), 3-1-1 Yoshino-dai, Chuo-ku, Sagamihara 252-5210
5Department of Astronomy, Kyoto University, Kitashirakawa-Oiwake-cho, Sakyo-ku, Kyoto 606-8502
6Graduate School of Science, Nagoya University, Furo-cho, Chikusa-ku, Nagoya, Aichi 464-8602, Japan
7Subaru Telescope, 650 North A’ohoku Place, Hilo, Hawaii, 96720, USA E-mail: [email protected]
(Received July 23, 2015; Revised October 21, 2016; Accepted October 21, 2016)
ABSTRACT
Using the InfraRed Camera (IRC) on board the infrared astronomical satellite AKARI we study the 3.3 µm polycyclic aromatic hydrocarbon (PAH) feature and its connection to active galactic nucleus (AGN) properties for a sample of 54 hard X-ray selected bright AGN, including both Seyfert 1 and Seyfert 2 type objects. The sample is selected from the 9-month Swift/BAT survey in the 14–195 keV band and all of the sources have known neutral hydrogen column densities (NH). The 3.3 µm PAH luminosity (L3.3µm) is used as a proxy for star-formation (SF) activity and hard X-ray luminosity (L14−195keV) as an indicator of the AGN power. We explore for possible difference of SF activity between type 1 (un-absorbed) and type 2 (absorbed) AGN. We use several statistical analyses taking the upper-limits of the PAH lines into account utilizing survival analysis methods. The results of our log(L14−195keV) versus log(L3.3µm) regression shows a positive correlation and the slope for the type 1/unobscured AGN is steeper than that of type 2/obscured AGN at a 3σ level. Also our analysis shows that the circum-nuclear SF is more enhanced in type 2/absorbed AGN than type 1/un-absorbed AGN for low L14−195keV luminosity/low Eddington ratio AGN, while there is no significant dependence of SF activity on the AGN type in the high L14−195keV luminosities/Eddington ratios.
Key words: galaxies: active — galaxies: Seyfert — X-rays: galaxies.
1. DESCRIPTION OF THE RESEARCH
In this work, we investigate the 2.5–5 µm low-resolution (R∼120) spectra obtained with the InfraRed Camera (IRC) instrument on the Japanese space infrared obser- vatory AKARI for a sample of 54 AGN with various levels of obscuration selected from the 9-month catalog (Tueller et al., 2008) of the Swift/BAT survey, which is sensitive to very high X-ray energies (14–195 keV). In our sample, 26 AGN are optical type 1 AGN (Seyfert optical type ≤ 1.5) and 28 type 2 AGN (Seyfert optical
http://pkas.kas.org
type > 1.5). Our selected sample also has detailed X-ray spectroscopy (0.3–12 keV) (Winter et al., 2009; Ichikawa et al., 2012). For all objects in our sample X-ray derived neutral hydrogen column densities were obtained mainly by analyzing spectra from the XMM-Newton, ASCA, Suzaku, and Swift/XRT. We use the 3.3 µm PAH emis- sion detected in our spectral range as a proxy for the SF activity to explore the link between AGN activity, column densities towards the nucleus, AGN type and SF. Detailed results have been reported in Castro et al.
(2014).
197
198 CASTRO ET AL.
Table 1
Linear regression parameters obtained using the E-M method under ASURV.
Sample No. Up.† a0 b0 hlog(L3.3µm)i P‡
log(L3.3µm) = a0{log(L14−195keV) − 43.64} + b0:
All AGN 54 30 0.42±0.14 40.20±0.11 40.07±0.12 0.01
Optical type 1 26 20 1.05±0.27 39.92±0.24 39.68±0.22 0.02
Optical type 2 28 10 0.11±0.17 40.27±0.12 40.23±0.11 0.66
log(L3.3µm/MBH) = a0{log(L14−195keV/MBH) − 35.42} + b0:
All AGN 54 30 0.73±0.17 31.97±0.13 31.88±0.13 0.002
Optical type 1 26 20 1.56±0.37 31.55±0.26 31.62±0.21 0.005
Optical type 2 28 10 0.62±0.23 32.16±0.16 32.01±0.16 0.10
Notes: † Number of upper-limits included,‡Correlation probability by Cox’s proportional hazard model.
Table 2
Two sample tests for optically classified AGN.
Criteria hlog(L3.3µm)i Gehan’s logrank Peto&Peto
No. nsy1 nsy2 Type 1 Type 2 Prob. Prob. Prob.
log(LX) ≤ 43.64 26 9 17 39.44±0.28 40.19±0.13 0.04 0.02 0.02
log(LX) > 43.64 28 17 11 40.59±0.09 40.29±0.19 0.66 0.34 0.50 log(LX/MBH) ≤ 35.43 25 10 15 31.17±0.15 31.66±0.13 0.14 0.09 0.12 log(LX/MBH) > 35.43 29 16 13 32.21±0.19 32.62±0.20 0.21 0.18 0.18
38 39 40 41 42 43
41 42 43 44 45
-2 -1 0 1 2
41 42 43 44 45
log(L3.3µm) [ergs-1 ] log SFR [MO• year-1 ]
log(L14-195keV) [ergs-1] log(L14-195keV) [ergs ]
All (a=0.42)
Type 1 (a=1.05) Type 2 (a=0.11)
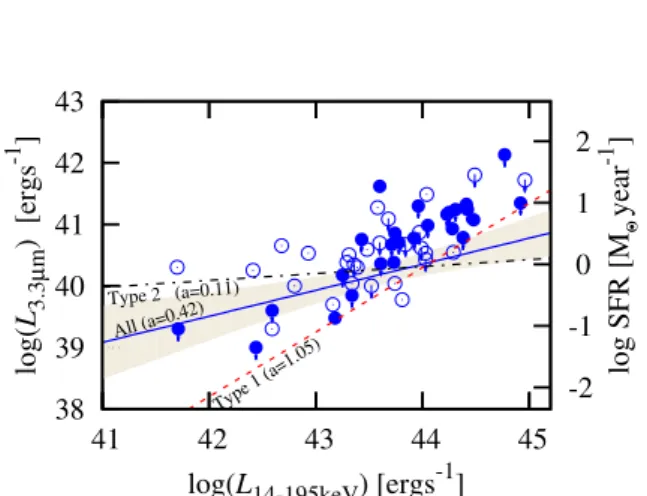
Figure 1. log(L14−195keV) versus log(L3.3µm) relation. On the right vertical axis of panel is the approximate SFR is shown.
Blue filled circles are for optical Seyfert 2 while blue open circles are for Seyfert 1 sources. Arrows are for upper-limits.
2. ANALYSIS AND RESULTS
To test the difference of SF activity between different types of AGN the several correlation analyses have been made. The regression has been made using the E-M algorithm (included in the ASURV package; Isobe et al.
(1986)) to account for upper-limits of the L3.3µm. If the minimum χ2 (bestfit case) is smaller than 2.7 below the χ2 value at f3.3 = 0, we consider the line detected and report the bestfit f3.3. Otherwise, we consider it a non-detection.
We have compared the log(L3.3µm) versus log(L14−195keV) (see Figure 1) and log(L3.3m/MBH) ver- sus log(L14−195keV/MBH) correlations for optical type 1 and type 2 AGN (see Table 1). Strong correlation is found for both cases. We have sub-divided our sample into low- and high-luminosity subsamples (in reference to the mean log(L14−195keV) value of the whole sample).
In order to compare this two sub-populations (for both type 1 and type 2 sources; see Table 2) we have performed the two-sample test under ASURV revealing that for the low-luminosity log(L3.3µm)-log(L14−195keV) space the SFR is more enhanced in type 2/absorbed AGN than type 1/un-absorbed AGN. This finding was also verified using the Bootstrap method.
3. CONLUSIONS
Strong correlation is found between log(L14−195keV) and log(L3.3µm) as well as between log(L14−195keV/MBH) and log(L3.3µm/MBH) for both optical and X-ray classi- fied type 1 AGN. We have found no statistical difference in the mean circum-nuclear star-formation rate (SFR), traced by the PAH 3.3 µm emission, between type 1 and type 2 AGN for our overall sample. Limiting the analysis to low L14−195keV luminosity AGN, however, stronger nuclear starburst activity is found in type 2 AGN than in type 1 AGN. There is no significant dif- ference in the SF activity betwen high L14−195keV type
AKARI OBSERVATION OF AGN: PAH 3.3 µm FEATURE 199
1 and type 2 AGN. A similar trend has been found for the specific SFR, between low and high Eddington ratio samples, although the statistical significance is lower.
Our results suggest that the difference between type 1/type 2 in low L14−195keV luminosity AGN may reflect an evolution sequence, where more obscuring material is available around low L14−195keVluminosity type 2 AGN when the circum-nuclear SF is feeding the central en- gine. At high L14−195keV, the difference between the two types may be mainly from the orientation effect.
ACKNOWLEDGMENTS
This work has been supported by CONACyT Grant 179662 and DGAPA-UNAM Grant PAPIIT IN104113 in Mexico, and from the Ministry of Education, Cul- ture, Sports, Science and Technology of Japan (MEXT) Grant-in-Aid for Scientific Research 23540273 (MI) and 26400228 (YU).
REFERENCES
Castro, A., Miyaji, T., Shirahata, M., Ichikawa, K., Oy- abu, S., Clark, D., Imanishi, M., Nakagawa, T. & Ueda.
Y., 2014, AKARI InfraRed Camera Observations of the 3.3 µm PAH feature in Swift/BAT AGNs, (PASJ in press:arxiv.org/abs/1408.3172)
Ichikawa, K., Ueda, Y., Terashima, Y., Oyabu, S. & Gandhi, P., 2012, Mid- and Far-Infrared properties of a complete sample of local AGNs, ApJ, 754,45
Imanishi, M., Nakagawa, T., Shirahata, M., Ohyama, Y.
& Onaka, T., 2010, AKARI/IRC infrared 2.5-5µm spec- troscopy of a large sample of LIRGs, ApJ, 681, 113 Isobe, T., Feigelson, E. D. & Nelson, P. I., 1986, Statisti-
cal methods for astronomical data with upper limits. II.
Correlation and regression, ApJ, 306, 490-507
Tueller, J., Mushotsky, R., Barthelmy, S., Cannizzo, et al., 2008, The 9-month Swift-BAT All-Sky Hard X-ray Survey, ApJ, 681, 113
Winter, L.M., Mushotzky R., Reynolds, C. & Tueller, J., 2009, X-ray spectral properties of the BAT AGN sample, ApJ, 690, 1322