INTRODUCTION
Prostate cancer (PCa) is the most frequently diagnosed malignancy and the second leading cause of cancer-specific deaths in men in most industrialized Western countries.
A clinicogenetic model to predict lymph node invasion by use of genome-based biomarkers from exome arrays in prostate cancer patients
Jong Jin Oh1, Seunghyun Park2,3, Sang Eun Lee1, Sung Kyu Hong1, Sangchul Lee1, Hak Min Lee1, Jeung Keun Lee1, Jin-Nyoung Ho1,4, Sungroh Yoon2, Seok-Soo Byun1
1Department of Urology, Seoul National University Bundang Hospital, Seongnam, 2Department of Electrical and Computer Engineering, Seoul National University, Seoul,
3School of Electrical Engineering, Korea University, Seoul, 4Biomedical Research Institute, Seoul National University Bundang Hospital, Seongnam, Korea
Purpose: Genetic variations among prostate cancer (PCa) patients who underwent radical prostatectomy (RP) and pelvic lymph node dissection were evaluated to predict lymph node invasion (LNI). Exome arrays were used to develop a clinicogenetic model that combined clinical data related to PCa and individual genetic variations.
Materials and Methods: We genotyped 242,186 single-nucleotide polymorphisms (SNPs) by using a custom HumanExome Bead- Chip v1.0 (Illumina Inc.) from the blood DNA of 341 patients with PCa. The genetic data were analyzed to calculate an odds ratio as an estimate of the relative risk of LNI. We compared the accuracies of the multivariate logistic model incorporating clinical factors between the included and excluded selected SNPs. The Cox proportional hazard models with or without genetic factors for pre- dicting biochemical recurrence (BCR) were analyzed.
Results: The genetic analysis indicated that five SNPs (rs75444444, rs8055236, rs2301277, rs9300039, and rs6908581) were signifi- cant for predicting LNI in patients with PCa. When a multivariate model incorporating clinical factors was devised to predict LNI, the predictive accuracy of the multivariate model was 80.7%. By adding genetic factors in the aforementioned multivariate model, the predictive accuracy increased to 93.2% (p=0.006). These genetic variations were significant factors for predicting BCR after ad- justment for other variables and after adding the predictive gain to BCR.
Conclusions: Based on the results of the exome array, the selected SNPs were predictors for LNI. The addition of individualized ge- netic information effectively enhanced the predictive accuracy of LNI and BCR among patients with PCa who underwent RP.
Keywords: Exome; Genotype; Lymph nodes; Predictive value of tests; Prostate neoplasms
This is an Open Access article distributed under the terms of the Creative Commons Attribution Non-Commercial License (http://creativecommons.org/licenses/by-nc/3.0) which permits unrestricted non-commercial use, distribution, and reproduction in any medium, provided the original work is properly cited.
Korean J Urol 2015;56:109-116.
http://dx.doi.org/10.4111/kju.2015.56.2.109 pISSN 2005-6737 • eISSN 2005-6745
Received: 28 November, 2014 • Accepted: 30 December, 2014 Corresponding Author: Seok-Soo Byun
Department of Urology, Seoul National University Bundang Hospital, 82 Gumi-ro 173beon-gil, Bundang-gu, Seongnam 463-707, Korea TEL: +82-31-787-7342, FAX: +82-31-787-4057, E-mail: [email protected]
ⓒ The Korean Urological Association, 2015
Recently, the incidence of this disease has significantly increased in Asian countries, including Korea, owing to the reported widespread use of prostate-specific antigen (PSA) testing and downward stage migration [1,2]. Nevertheless, recent reports have shown that up to 15% of contemporary
www.kjurology.org
patients still harbor lymph node invasion (LNI) at extended pelvic lymph node dissection (PLND) in PCa [3,4]. Many studies have reported preoperative nomograms for predicting LNI after radical prostatectomy (RP) and PLND, and these predictive models were reconstructed by using an extended PLND procedure [5-9]. Although recent studies have demonstrated a significantly higher rate of LNI in patients undergoing extended PLND relative to patients undergoing only limited PLND, it is a common policy to spare PLND or to perform limited PLND in patients with a low risk of LNI because of the widely applied early detection of PCa and screening programs and the resulting stage migration [9-12]. Therefore, it became necessary to find a preoperative tool for predicting LNI before surgery. There are currently some nomograms for predicting LNI with higher accuracy [11,13].
Recently, genome-wide association studies have iden- tified several genetic variants that are associated with risks for PCa and have provided additional predictive gain to prostate-related prognosis [14,15]. These genetic data have been applied to actual clinical situations and have been validated as genetic biomarkers in PCa. Thus, in the present study, by using 242,186 single-nucleotide polymorphisms (SNPs) in an exome array from 341 Kor- ean patients with PCa who underwent RP and PLND, we investigated significant genetic variants for LNI and showed how additional predictive gain was achieved by reconstructing a clinicogenetic model.
MATERIALS AND METHODS
1. Study population
After we obtained Institutional Review Board appro- val (IRB number, B-1312/232-302), we enrolled 1,002 pati- ents with PCa from November 2003 to July 2013. Blood specimens were prospectively collected from all of the patients, and genomic DNA was extracted by use of PureLink Genomic DNA maxi kits (Invitrogen, Carlsbad, CA, USA). Genomic DNA was diluted to 1 µg/mL and stored at –20°C. We included patients who underwent RP and PLND, and most of the patients had undergone a limited extent of PLND. We excluded patients who had undergone neoadjuvant hormone or radiation therapy, prostate biopsies at another institution, or prostate biopsies with <12 cores taken. We also excluded patients who had a postoperative follow-up of less than 1 year. Accordingly, 341 patients were enrolled with complete records of clinical data including data on LNI and biochemical recurrence (BCR). All 341 patients were stratified into two groups on
the basis of LNI. Transrectal ultrasound-guided multicore (≥12) biopsies were obtained from all male patients by use of a biopsy gun with an automatic firing mechanism. All RP specimens were processed according to the Stanford protocol [16]. All biopsy and RP specimens were analyzed by a single genitourinary pathologist. BCR was defined as two consecutive PSA increases of 0.2 ng/mL or higher within at least 2 months after RP [17].
2. Genotyping and quality control
Study samples were processed on the HumanExome BeadChip 12v1-1 system (Illumina Inc., San Diego, CA, USA), which included 242,901 markers focused on protein- altering variants. Details concerning SNP content and selection strategies can be found at the exome array design webpage (http://genome.sph.umich.edu/wiki/Exome_
Chip_Design). Genotype calling was performed by using Illumina’s GenTrain ver. 2.0 clustering algorithm with the GenomeStudio software (V2011.1). Cluster boundaries were determined by using Illumina’s standard cluster file. After additional visual inspection of SNPs with call rates of <0.99 and SNPs with minor allele frequencies of <0.002, 242,186 of 242,901 attempted markers (99.71%) were successfully genotyped with call rates >95% (average call rate, 99.98%). In total, 1,001 of 1,002 individuals (99.9%) were successfully genotyped (call rate >98%). For the 242,186 SNPs that passed quality control, genotype concordance among the 104 blind duplicate sample pairs was 99.998%. One individual per pair of six known twin pairs and six unknown duplicates were excluded. We performed principal components analysis twice, once excluding HapMap samples to identify population out- liers and a second time including HapMap samples to interpret outliers. To avoid artifacts due to family relatedness, we computed the principal components by using SNP loadings estimated from a subset of 7,304 not- close relatives. We defined close relatives as an estimated genome-wide identical-by-descent proportion of alleles shared of >0.10. We estimated identical-by-descent sharing by using PLINK’s “-genome” option38 and performed principal components analysis by using SMARTPCA37 on a linkage-disequilibrium-pruned set of 22,464 autosomal SNPs. These were obtained by removing large-scale, high-linkage disequilibrium (LD) regions, SNPs with a minimum allele frequency <0.01, or SNPs with a Hardy- Weinberg equilibrium p-value<10−6 and by performing LD pruning by using the PLINK option “--indep-pairwise 50 5 0.2.” After inspecting the first 10 principal components, we identified 12 population outliers, 9 of which had self-
reported non-Finnish ancestry. Thus, we excluded these 12 individuals from subsequent analyses.
3. SNP analysis of the exome array
SNP genotype frequencies were examined for Hardy- Weinberg equilibrium by using the chi-square statistic and all were found to be consistent (p>0.05). The data were analyzed by using an unconditional logistic regression to calculate an odds ratio (OR) as an estimate of the relative risk of LNI associated with SNP genotypes. To determine the association between the genotype and haplotype distributions, a logistic analysis was performed with control for age (continuous value) as a covariate to eliminate or reduce any confounding factors that could influence the findings. Lewontin’s D’ (|D’|) and the LD coefficient r2 were examined to measure LD between all pairs of biallelic loci [18]. The haplotypes were inferred from the successfully genotyped SNPs by using the PHASE algorithm ver. 2.0 [19], and SAS 9.1 (SAS Institute Inc., Cary, NC, USA). The effective number of independent marker loci was calculated by using SNPSpD software (http://www.genepi.qimr.edu.au/general/daleN/SNPSpD/) [20].
4. Statistical analyses
A total of 341 patients were stratified into two gro- ups on the basis of LNI. Comparing patients with and without LNI, we assessed the differences among the clinicopathological profiles of patients by using the chi- square test, Fisher exact test, and the Mann-Whitney test. The multivariate analyses on models adjusted for age, initial PSA, biopsy Gleason scores, clinical stage, percentage of positive core, and maximal tumor length in a core were performed to identify an independent predictor of LNI. The predictive accuracy for this multivariate model was assessed by the receiver operating characteristics-derived area under the curve (AUC) analysis. Another multivariate model was created by using the additional genetic information derived from the exome array, and predictive accuracy was assessed by using the same method. The two AUCs were subsequently compared by using the Mantel-Haenszel test. The Cox proportional hazard model for predicting BCR analyses was conducted by adjusting the clinicopathologic parameters, such as pathologic Gleason scores, extracapsular extension, seminal vesicle invasion, positive surgical margin, and LNI, with or without genetic factors from the exome array. BCR- free survival was measured from the day of surgery to the date of the last follow-up period or until the date of
BCR. The predictive accuracy for predicting BCR from each model was compared by use of similar methods. The SPSS ver. 15.0 (SPSS Inc., Chicago, IL, USA) and Medicalc software ver. 11 (Mariakerke, Belgium) were used to perform the statistical analyses. A two-tailed p<0.05 was considered to be statistically significant for all of the analyses.
RESULTS
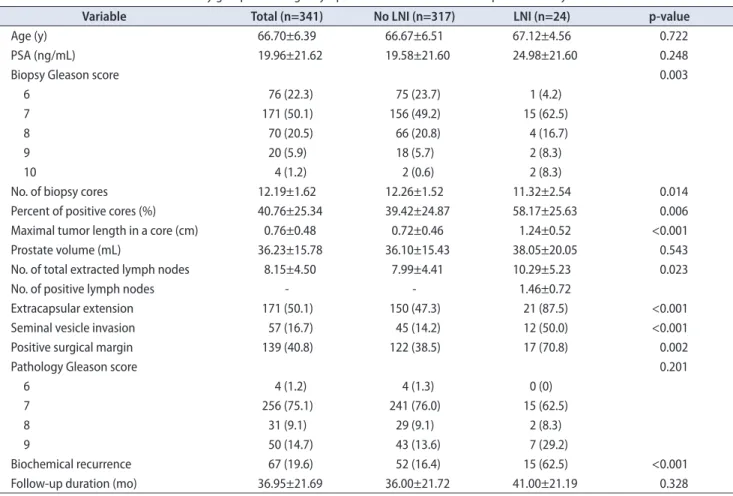
Among 341 patients with PCa, 24 patients (7.04%) had LNI after RP and PLND (Table 1). Patients with LNI displayed significantly higher biopsy Gleason scores, per- centage of positive core, and maximal tumor length in a core before RP. The rates of extracapsular extension, seminal vesicle invasion, positive surgical margin and BCR were higher in the LNI group after RP. The extracted mean total number of LNIs was 8.15±4.50. There was no significant difference in the rate of LNI according to surgical method: open RP, 5.3% (7/131); robotic RP, 8.1%
(17/210).
Genotype frequencies in patients with and without LNI were analyzed by using a logistic regression model (Fig. 1).
The results of genotyping 242,186 SNPs by use of exome arrays showed that five SNPs (rs75444444, rs8055236, rs2301277, rs9300039, and rs6908581) were significantly associated with LNI in men who underwent RP (Table 2). These significant SNPs were all positively correlated with LNI; ORs and significance levels are shown in Table 2; however, the aforementioned SNPs were not significant after multiple testing with false-discovery rate.
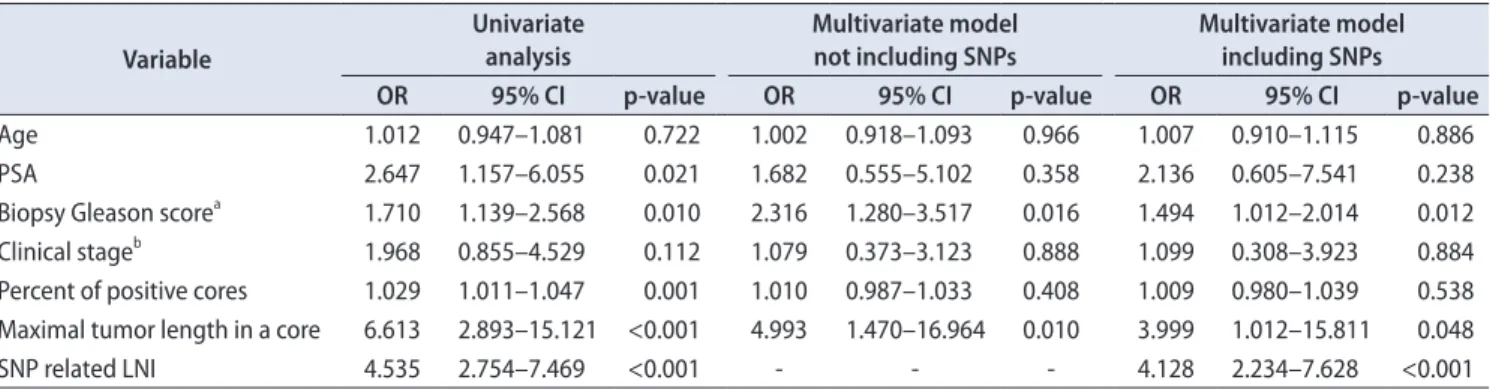
The initial serum PSA levels, biopsy Gleason scores, clinical stage, percentage of positive cores, and maximal tumor length in a core were significant factors for LNI in the univariate analysis. The multivariate models incor- porated these variables and age, including and excluding the SNP variants, as shown in Table 3. The biopsy Gleason scores and maximal tumor length in a core were significant factors for predicting LNI in a multivariate logistic model; the predictive accuracy for this model was 80.7% (95% confidence interval [CI], 0.762–0.847). By adding the genetic variant factors, the clinicogenetic multivariate model showed that predictive accuracy was 93.2% (95%
CI, 0.900–0.956). Thus, the accuracy was increased within a significant level (difference between area, 0.124; 95% CI, 0.0357–0.213; p=0.006) (Fig. 2).
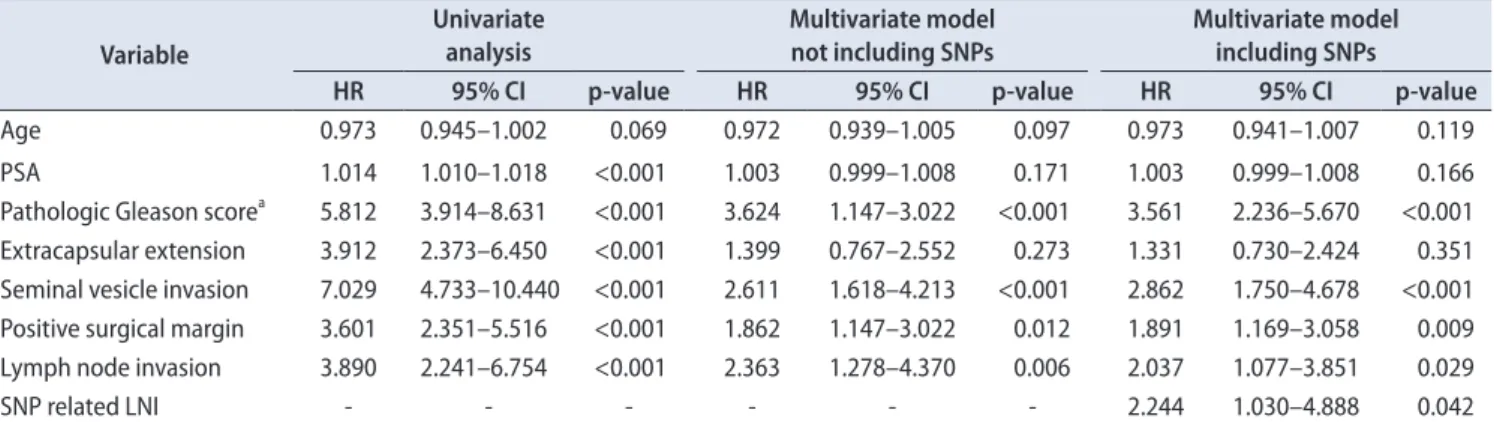
The Cox proportional hazard models for predicting BCR are shown in Table 4. The clinicopathological multi- variate models showed that pathologic Gleason scores,
Table 1. Baseline characteristics of the study group according to lymph node invasion after radical prostatectomy
Variable Total (n=341) No LNI (n=317) LNI (n=24) p-value
Age (y) 66.70±6.39 66.67±6.51 67.12±4.56 0.722
PSA (ng/mL) 19.96±21.62 19.58±21.60 24.98±21.60 0.248
Biopsy Gleason score 0.003
6 76 (22.3) 75 (23.7) 1 (4.2)
7 171 (50.1) 156 (49.2) 15 (62.5)
8 70 (20.5) 66 (20.8) 4 (16.7)
9 20 (5.9) 18 (5.7) 2 (8.3)
10 4 (1.2) 2 (0.6) 2 (8.3)
No. of biopsy cores 12.19±1.62 12.26±1.52 11.32±2.54 0.014
Percent of positive cores (%) 40.76±25.34 39.42±24.87 58.17±25.63 0.006
Maximal tumor length in a core (cm) 0.76±0.48 0.72±0.46 1.24±0.52 <0.001
Prostate volume (mL) 36.23±15.78 36.10±15.43 38.05±20.05 0.543
No. of total extracted lymph nodes 8.15±4.50 7.99±4.41 10.29±5.23 0.023
No. of positive lymph nodes - - 1.46±0.72
Extracapsular extension 171 (50.1) 150 (47.3) 21 (87.5) <0.001
Seminal vesicle invasion 57 (16.7) 45 (14.2) 12 (50.0) <0.001
Positive surgical margin 139 (40.8) 122 (38.5) 17 (70.8) 0.002
Pathology Gleason score 0.201
6 4 (1.2) 4 (1.3) 0 (0)
7 256 (75.1) 241 (76.0) 15 (62.5)
8 31 (9.1) 29 (9.1) 2 (8.3)
9 50 (14.7) 43 (13.6) 7 (29.2)
Biochemical recurrence 67 (19.6) 52 (16.4) 15 (62.5) <0.001
Follow-up duration (mo) 36.95±21.69 36.00±21.72 41.00±21.19 0.328
Values are presented as mean±standard deviation or number (%).
LNI, lymph node invasion; PSA, prostate-specific antigen.
Fig. 1. Manhattan plot of the associa- tion of lymph node invasion among prostate cancer patients who under- went radical prostatectomies from an analysis of 242,186 single-nucleotide polymorphisms on a custom Hu- manExome BeadChip v1.0 (Illumina Inc., San Diego, CA, USA).
rs75444444
log()10p
Chromosome
1 2 3 4 5 6 7 8 9 10 11 12 13 14 15 16 17 18 19 21 24
8
6
4
2
0
rs8055236 rs9300039
rs2301277rs6908581
Table 2. Results of the logistic regression analysis of exome array to predict lymph node invasion after radical prostatectomy SNP ID Chr Alleles Gene Minor allele frequency
OR (95% CI) p-value Adjusted
p-value
No LNI LNI
rs75444444 19 C>T MUC16 0.07692 0.2609 4.235 (2.094–8.566) 1.5e–05 0.3801
rs8055236 16 G>T IER3 0.103 0.2917 3.586 (1.853–6.937) 5.836e–05 0.5776
rs2301277 6 G>A PBX2 0.09375 0.2708 3.59 (1.825–7.062) 8.585e–05 0.5776
rs9300039 11 C>A - 0.2002 0.4375 3.107 (1.715–5.627) 9.238e–05 0.5776
rs6908581 6 C>A - 0.3495 0.6304 3.175 (1.717–5.871) 0.0001139 0.5776
SNP, single-nucleotide polymorphism; Chr, chromosome; LNI, lymph node invasion; OR, odds ratio; CI, confidence interval.
seminal vesicle invasion, positive surgical margin, and LNI were significant factors for predicting BCR. Selected SNP- related LNI was also a significant factor for BCR in the multivariate Cox proportional models (hazard ratio, 2.244;
95% CI, 1.030–4.888; p=0.042). The AUC increased from 71.8% in the model without genetic factors to 72.3% in the model with genetic factors (p=0.346).
DISCUSSION
In the present study, we investigated potential ge- netic biomarkers for predicting LNI among patients with PCa who underwent RP and PLND. The logistic
regression analysis results suggested that five SNPs were significantly associated with the risk for LNI. Moreover, we applied the information derived from the genetic studies to an actual clinical model based on previously established clinical factors and found an additional predictive gain for predicting LNI.
Most of the recent nomograms used to predict LNI have comparable predictive accuracy. The first nomogram introduced by Briganti et al. [11] showed 76% accuracy by adjusting for PSA, clinical stage, and biopsy Gleason scores. In another nomogram that included percentage of positive cores as a covariate, predictive accuracy increa- sed to 81.5% for LNI [13]. Afterwards, many studies that contained external and internal validation results of these nomograms showed a higher accuracy level [6,8,9].
Recent updated nomograms predicting LNI showed 87.6%
accuracy in 588 patients with clinically localized PCa who underwent RP and extended PLND [7]. Hansen et al. [8]
showed externally validated updated nomograms among 1,282 PCa men and showed 82.9% accuracy. In our setting, including biopsy parameters, the multivariate model for predicting LNI was 80.7%; however, with the addition of the genetic parameters to the multivariate model, accuracy was significantly increased to 93.2%.
Although recently published nomograms related to PCa prognosis need to be improved by including new variables, models based on plasma or tissue quantitative biomarkers have recently been proposed [21,22]. However, although associations between SNPs and PCa have been reported, whether including any of these SNPs or a combination might improve the classic nomograms has not been explored [23]. Huang et al. [15] showed that among 320 patients with Table 3. Results of logistic regression models of potential predictors for lymph node invasion of prostate cancer among men who underwent radical prostatectomy and accuracy of established models according to the presence of SNPs
Variable
Univariate
analysis Multivariate model
not including SNPs Multivariate model including SNPs
OR 95% CI p-value OR 95% CI p-value OR 95% CI p-value
Age 1.012 0.947–1.081 0.722 1.002 0.918–1.093 0.966 1.007 0.910–1.115 0.886
PSA 2.647 1.157–6.055 0.021 1.682 0.555–5.102 0.358 2.136 0.605–7.541 0.238
Biopsy Gleason scorea 1.710 1.139–2.568 0.010 2.316 1.280–3.517 0.016 1.494 1.012–2.014 0.012 Clinical stageb 1.968 0.855–4.529 0.112 1.079 0.373–3.123 0.888 1.099 0.308–3.923 0.884 Percent of positive cores 1.029 1.011–1.047 0.001 1.010 0.987–1.033 0.408 1.009 0.980–1.039 0.538 Maximal tumor length in a core 6.613 2.893–15.121 <0.001 4.993 1.470–16.964 0.010 3.999 1.012–15.811 0.048
SNP related LNI 4.535 2.754–7.469 <0.001 - - - 4.128 2.234–7.628 <0.001
SNP, single-nucleotide polymorphism; OR, odds ratio; CI, confidence interval; PSA, prostate-specific antigen; LNI, lymph node invasion.
Areas under curve of each multivariate models: multivariate model not including SNPs, 0.807 (95% CI, 0.762–0.847); multivariate model including SNPs, 0.932 (95% CI, 0.900–0.956).
Comparison of each multivariate models: difference between area, 0.124; 95% CI, 0.0357–0.213; p=0.006.
a:Biopsy Gleason score was categorized into ≤7 vs. >7. b:Clinical stage was categorized into ≤T2 vs. >T2.
Fig. 2. Receiver operating characteristic curves of the multivariate logistic regression model devised for lymph node invasion after radi- cal prostatectomies and pelvic lymph node dissection. The blue line corresponds to a clinical model that excludes genetic information.
The green line corresponds to a clinicogenetic model that includes selected small-nucleotide polymorphisms (difference between areas, 0.124; 95% confidence interval, 0.0357–0.213; p=0.006).
0 20 40 60 80
100
80
60
40
20
100
Sensitivity
100-Specificity 0
PCa after RP, 3 of 20 SNPs were significantly associated with BCR (p<0.02) after ad j u st ment for clinicopathological factors such as age, pre operative PSA, pathologic stage, and surgical margin. Like wise, we performed a broader investigation by analyzing 242,186 SNPs among men who underwent RP by use of a custom HumanExome BeadChip and applied our genetic information from the exome array to the clinical model. As a result, we developed a more accurate model for predicting LNI. Because the action of SNPs is generally understood to be a function of multiple variant combinations and not a single action, it was important to find many potential genetic variant outcomes.
The relationship between the five SNPs selected from our series and PCa has not yet been investigated. rs- 75444444, which is located in chromosome 19 (MUC16), is known as the largest glycoprotein of the mucin family. It is normally expressed in the epithelial lining of various tissues and is elevated in some organ malignancies [24].
The high rs8055236 (IER3) expression revealed in the prostate and bladder was described as being regulated by p53 and involved in the proapoptotic action by the tumor suppressor [25]. rs2301277 (PBX2) works as a transcriptional activator for valosin-containing protein expression in breast cancer and is known to be an important factor for cell survival [26]. However, an accurate mechanism of action of these SNPs in PCa has not been published; it is necessary to confirm the genetic variants and lymph node metastasis in PCa through molecular work. Actually, our selected SNP, which is related to LNI, had significance to PCa-related BCR in the multivariate analysis; these markers or the combination of these markers had a likeli-
hood of being a potential biomarker for PCa.
The present study had several limitations, such as the extent of PLND. Although the ideal candidate for PLND still needs to be defined, general agreement has been reached that if PLND is contemplated, it should be extended to reach an adequate nodal staging accuracy [27,28]. Consequently, if an LNI prediction model is de-
veloped, it must be based on an extended PLND series.
Conversely, applying predictive tools developed on pati- ents treated with limited PLND might significantly underestimate the true risk of LNI [4]. However, LNI was detected even in low-risk patients with PCa in whom PLND is not indicated in the current era; therefore, we need the available nomogram in this real clinical setting.
Our predictive model had a higher accuracy rate above 90% and consisted of preoperative parameters with genetic information obtained from serum. Therefore, by adding a recently published nomogram obtained from an extended PLND setting, the external validation of our selected biomarker exhibited an excellent model for predicting LNI. Owing to the limited extent of PLND, the small number of positive lymph nodes was a limitation.
The sample size was another limitation; however, all men included in this study were of a homogeneous racial population. PCa diagnosed in Asian, American, and European men may have innate differences associated with racial and environmental factors. Because PCa is a hormone-dependent disease, various investigators have suggested that racial variations in the serum levels of testosterone and derivatives may contribute to differences in PCa risks and prognoses among different races [29].
Table 4. Cox proportional hazard models of potential predictors for biochemical recurrence of prostate cancer among men who underwent radi- cal prostatectomy and accuracy of established models according to the presence of SNPs
Variable
Univariate
analysis Multivariate model
not including SNPs Multivariate model including SNPs
HR 95% CI p-value HR 95% CI p-value HR 95% CI p-value
Age 0.973 0.945–1.002 0.069 0.972 0.939–1.005 0.097 0.973 0.941–1.007 0.119
PSA 1.014 1.010–1.018 <0.001 1.003 0.999–1.008 0.171 1.003 0.999–1.008 0.166
Pathologic Gleason scorea 5.812 3.914–8.631 <0.001 3.624 1.147–3.022 <0.001 3.561 2.236–5.670 <0.001 Extracapsular extension 3.912 2.373–6.450 <0.001 1.399 0.767–2.552 0.273 1.331 0.730–2.424 0.351 Seminal vesicle invasion 7.029 4.733–10.440 <0.001 2.611 1.618–4.213 <0.001 2.862 1.750–4.678 <0.001 Positive surgical margin 3.601 2.351–5.516 <0.001 1.862 1.147–3.022 0.012 1.891 1.169–3.058 0.009 Lymph node invasion 3.890 2.241–6.754 <0.001 2.363 1.278–4.370 0.006 2.037 1.077–3.851 0.029
SNP related LNI - - - 2.244 1.030–4.888 0.042
SNP, single-nucleotide polymorphism; HR, hazard ratio; CI, confidence interval; PSA, prostate-specific antigen; LNI, lymph node invasion.
Areas under curve of each multivariate models: multivariate model not including SNPs, 0.718 (95% CI, 0.673–0.760); multivariate model including SNPs, 0.723 (95% CI, 0.679–0.765).
Comparison of each multivariate model: difference between area, 0.005; 95% CI, –0.006–0.0157; p=0.346.
a:Pathologic Gleason score was categorized into ≤7 vs. >7.
Differences in the hormonal milieu and a lack of PSA screening have been speculated to play a role in the ge- nerally more aggressive profile of PCa diagnosed in con- temporary Korean men compared with their Western counterparts [30]. The effects of racial differences may originate from genetic differences. Therefore, our data from an Asian population may differ from the data for a Western population. Another limitation was that our data should be validated in other independent cohorts for persistent significance. Despite these limitations, a potential predictive marker should be judged on the basis of its capacity to improve the preexisting optimized predictive model rather than simply on the basis of its status as an independent variable.
CONCLUSIONS
We showed that five SNPs were significant predictors of LNI. Furthermore, the addition of genetic information from exome arrays effectively enhanced the predictive accuracy of our multivariate model, which incorporated various clinical factors. These results need to be validated in future studies but may lead to the development of an accurate model that predicts LNI in the preoperative setting.
CONFLICTS OF INTEREST
The authors have nothing to disclose.
ACKNOWLEDGMENTS
This work was supported by grant No. 02-2014-016 from the SNUBH (Seoul National University Bundang Hospital) Research Fund and was supported by the Basic Science Research Program through the National Research Foundation of Korea (NRF) funded by the Ministry of Education, Science and Technology (NRF- 2012R1A1A2006392).
REFERENCES
1. Pak S, Park S, Ryu J, Hong S, Song SH, You D, et al. Preopera- tive factors predictive of posterolateral extracapsular extension after radical prostatectomy. Korean J Urol 2013;54:824-9.
2. Cooperberg MR, Moul JW, Carroll PR. The changing face of prostate cancer. J Clin Oncol 2005;23:8146-51.
3. Abdollah F, Suardi N, Gallina A, Bianchi M, Tutolo M, Passoni N, et al. Extended pelvic lymph node dissection in prostate
cancer: a 20-year audit in a single center. Ann Oncol 2013;24:
1459-66.
4. Abdollah F, Sun M, Thuret R, Budaus L, Jeldres C, Graefen M, et al. Decreasing rate and extent of lymph node staging in patients undergoing radical prostatectomy may undermine the rate of diagnosis of lymph node metastases in prostate cancer.
Eur Urol 2010;58:882-92.
5. Abdollah F, Karnes RJ, Suardi N, Cozzarini C, Gandaglia G, Fossati N, et al. Predicting survival of patients with node- positive prostate cancer following multimodal treatment. Eur Urol 2014;65:554-62.
6. Walz J, Bladou F, Rousseau B, Laroche J, Salem N, Gravis G, et al. Head to head comparison of nomograms predicting prob- ability of lymph node invasion of prostate cancer in patients undergoing extended pelvic lymph node dissection. Urology 2012;79:546-51.
7. Briganti A, Larcher A, Abdollah F, Capitanio U, Gallina A, Suardi N, et al. Updated nomogram predicting lymph node invasion in patients with prostate cancer undergoing extended pelvic lymph node dissection: the essential importance of per- centage of positive cores. Eur Urol 2012;61:480-7.
8. Hansen J, Rink M, Bianchi M, Kluth LA, Tian Z, Ahyai SA, et al. External validation of the updated Briganti nomogram to predict lymph node invasion in prostate cancer patients under- going extended lymph node dissection. Prostate 2013;73:211-8.
9. Heidenreich A, Pfister D, Thuer D, Brehmer B. Percentage of positive biopsies predicts lymph node involvement in men with low-risk prostate cancer undergoing radical prostatectomy and extended pelvic lymphadenectomy. BJU Int 2011;107:220-5.
10. Touijer K, Rabbani F, Otero JR, Secin FP, Eastham JA, Scardino PT, et al. Standard versus limited pelvic lymph node dissection for prostate cancer in patients with a predicted probability of nodal metastasis greater than 1%. J Urol 2007;178:120-4.
11. Briganti A, Chun FK, Salonia A, Zanni G, Scattoni V, Vali- quette L, et al. Validation of a nomogram predicting the proba- bility of lymph node invasion among patients undergoing radi- cal prostatectomy and an extended pelvic lymphadenectomy.
Eur Urol 2006;49:1019-26.
12. Abdollah F, Schmitges J, Sun M, Tian Z, Briganti A, Shariat SF, et al. A critical assessment of the value of lymph node dissec- tion at radical prostatectomy: A population-based study. Pros- tate 2011;71:1587-94.
13. Briganti A, Karakiewicz PI, Chun FK, Gallina A, Salonia A, Zanni G, et al. Percentage of positive biopsy cores can improve the ability to predict lymph node invasion in patients undergo- ing radical prostatectomy and extended pelvic lymph node dis- section. Eur Urol 2007;51:1573-81.
14. Eeles RA, Olama AA, Benlloch S, Saunders EJ, Leongamornlert DA, Tymrakiewicz M, et al. Identification of 23 new prostate
cancer susceptibility loci using the iCOGS custom genotyping array. Nat Genet 2013;45:385-91, 391e1-2.
15. Huang SP, Huang LC, Ting WC, Chen LM, Chang TY, Lu TL, et al. Prognostic significance of prostate cancer susceptibility variants on prostate-specific antigen recurrence after radical prostatectomy. Cancer Epidemiol Biomarkers Prev 2009;18:
3068-74.
16. McNeal JE, Redwine EA, Freiha FS, Stamey TA. Zonal distribu- tion of prostatic adenocarcinoma. Correlation with histologic pattern and direction of spread. Am J Surg Pathol 1988;12:897- 906.
17. Cookson MS, Aus G, Burnett AL, Canby-Hagino ED, D'Amico AV, Dmochowski RR, et al. Variation in the definition of bio- chemical recurrence in patients treated for localized prostate cancer: the American Urological Association Prostate Guide- lines for Localized Prostate Cancer Update Panel report and recommendations for a standard in the reporting of surgical outcomes. J Urol 2007;177:540-5.
18. Hedrick PW. Gametic disequilibrium measures: proceed with caution. Genetics 1987;117:331-41.
19. Stephens M, Smith NJ, Donnelly P. A new statistical method for haplotype reconstruction from population data. Am J Hum Genet 2001;68:978-89.
20. Nyholt DR. A simple correction for multiple testing for single- nucleotide polymorphisms in linkage disequilibrium with each other. Am J Hum Genet 2004;74:765-9.
21. Donovan MJ, Hamann S, Clayton M, Khan FM, Sapir M, Bay- er-Zubek V, et al. Systems pathology approach for the predic- tion of prostate cancer progression after radical prostatectomy.
J Clin Oncol 2008;26:3923-9.
22. Svatek RS, Jeldres C, Karakiewicz PI, Suardi N, Walz J, Roeh-
rborn CG, et al. Pre-treatment biomarker levels improve the accuracy of post-prostatectomy nomogram for prediction of biochemical recurrence. Prostate 2009;69:886-94.
23. Witte JS. Prostate cancer genomics: towards a new understand- ing. Nat Rev Genet 2009;10:77-82.
24. Williams KA, Terry KL, Tworoger SS, Vitonis AF, Titus LJ, Cramer DW. Polymorphisms of MUC16 (CA125) and MUC1 (CA15.3) in relation to ovarian cancer risk and survival. PLoS One 2014;9:e88334.
25. Arlt A, Schafer H. Role of the immediate early response 3 (IER3) gene in cellular stress response, inflammation and tu- morigenesis. Eur J Cell Biol 2011;90:545-52.
26. Qiu Y, Morii E, Tomita Y, Zhang B, Matsumura A, Kitaichi M, et al. Prognostic significance of pre B cell leukemia transcrip- tion factor 2 (PBX2) expression in non-small cell lung carci- noma. Cancer Sci 2009;100:1198-209.
27. Heidenreich A, Bellmunt J, Bolla M, Joniau S, Mason M, Mat- veev V, et al. EAU guidelines on prostate cancer. Part 1: screen- ing, diagnosis, and treatment of clinically localised disease. Eur Urol 2011;59:61-71.
28. Briganti A, Blute ML, Eastham JH, Graefen M, Heidenreich A, Karnes JR, et al. Pelvic lymph node dissection in prostate can- cer. Eur Urol 2009;55:1251-65.
29. van Houten ME, Gooren LJ. Differences in reproductive endo- crinology between Asian men and Caucasian men: a literature review. Asian J Androl 2000;2:13-20.
30. Song C, Ro JY, Lee MS, Hong SJ, Chung BH, Choi HY, et al.
Prostate cancer in Korean men exhibits poor differentiation and is adversely related to prognosis after radical prostatec- tomy. Urology 2006;68:820-4.