pISSN 2288-9272 eISSN 2383-8493 J Oral Med Pain 2019;44(3):112-117 https://doi.org/10.14476/jomp.2019.44.3.112
Assessment of the Thickness of the Roof of the Glenoid Fossa Using Cone Beam Computed Tomography in Asymptomatic Korean Adult Patients
Hyun-Jeong Park
1, Yo-Seob Seo
2, A-Hyang Yoon
1, Ji Hoo Kim
1, Ji-Won Ryu
11
Department of Oral Medicine, School of Dentistry, Chosun University, Gwangju, Korea
2
Department of Oral and Maxillofacial Radiology, School of Dentistry, Chosun University, Gwangju, Korea
Received September 3, 2019 Revised September 4, 2019 Accepted September 4, 2019
Purpose: The aim of this study was to assess the thickness of the roof of the glenoid fossa (RGF) in Korean adult population without symptoms of temporomandibular disorder (TMD) using cone-beam computed tomography (CBCT).
Methods: CBCT Data from 111 Korean adult patients aged ≥25 years (55 males and 56 fe- males) without signs and symptoms of TMD were analyzed retrospectively in this study. The thickness of the RGF was determined as the perpendicular distance between the ‘glenoid fossa line’ and ‘middle cranial fossa line’ on parasagittal and paracoronal reconstructions, respectively. The thickness of the RGF according to sex and age was analyzed using t-tests (p<0.05). Differences were also examined between the right and left sides, and between the paracoronal and parasagittal sides.
Results: The mean thickness of the RGF in all subjects was 0.75±0.39 mm; there was no sig- nificant difference in thickness between male (0.78±0.36 mm) and female (0.72±0.30 mm).
We found no correlation between age and the mean thickness of the RGF, when age was grouped by decade. However, when subjects were divided into >40 years and ≤40 years age groups, the thickness of the RGF was significantly different between the groups.
Conclusions: We found that the thickness of the RGF did not differ by sex, but might be af- fected by aging. Further studies with larger numbers of subjects are needed to confirm the results of this study.
Key Words: Adult; Cone-beam computed tomography; Roof of glenoid fossa; Sex; Tem- poromandibular joint
Correspondence to:
Ji-Won Ryu
Department of Oral Medicine, School of Dentistry, Chosun University, 309 Pilmun- daero, Dong-gu, Gwangju 61452, Korea Tel: +82-62-220-3897
Fax: +82-62-234-2119 E-mail: [email protected]
https://orcid.org/0000-0002-5586-8195 This study was supported by research fund from Chosun University, 2017.
JOMP
Journal of Oral Medicine and PainCopyright
Ⓒ2019 Korean Academy of Orofacial Pain and Oral Medicine. All rights reserved.
CC
This is an open-access article distributed under the terms of the Creative Commons Attribution Non-Commercial License (http://creativecommons.org/licenses/by-nc/4.0/),
INTRODUCTION
Temporomandibular disorders (TMDs) encompass a group of musculoskeletal and neuromuscular pathologic condi- tions that involve the temporomandibular joints (TMJs), the masticatory muscles, and all associated structures [1].
The TMJs consist of osseous components (condyle, glenoid fossa, and articular eminence) and soft tissues (articular disc and joint capsule) [2]. The glenoid fossa, located at the inferior aspect of the squamous part of temporal bone, is
regarded as the temporal component of the TMJs [3].
Previous studies of TMJ osseous components have fo- cused on the mandibular condyle, in terms of its relation- ship with the articular disc, its position in the joint cavity, and degenerative bone changes. However, the zygomatic bone and zygomatic process of the temporal bone together constitute an essential component of the masticatory appa- ratus, and are subjected to strains and stresses induced by masticatory muscles [4].
Although there is a lack of interest in the role of the
temporal bone in TMD, the thickness of the roof of the gle- noid fossa (RGF) may be clinically significant in many re- spects. First, because of its proximity to vital structures, the bone thickness of the RGF is clinically relevant for TMJ sur- geries and other procedures involving this area [5]. Second, sufficient thickness of the RGF is crucial to prevent disloca- tion of the mandibular condyle into the middle cranial fos- sa in cases of traumatic injury [6]. Finally, the thickness of the RGF could increase when the TMJ undergoes degenera- tive osteoarthritic changes, in addition to disc displacement or disc perforation [7].
To evaluate the relationship between degenerative bone changes and the thickness of the RGF, it is necessary to measure the thickness of the RGF in patients who do not exhibit arthritic changes. To the best of our knowledge, no studies have been conducted on the thickness of the RGF in Korean population.
Cone-beam computed tomography (CBCT) images are considered very useful for visualizing the TMJ, because of the need for a relatively low radiation dose but with high diagnostic quality [5]. Therefore, CBCT may be regarded as the imaging technique of choice for investigating bony changes of the TMJ [8]. The aim of this study was to assess the thickness of the RGF in Korean adult patients without symptoms of TMD using CBCT.
MATERIALS AND METHODS
1. Subjects
This retrospective study was approved by the Institutional Review Committee of the Chosun University Dental Hospital (CUDH) (IRB no. 1901/013). CBCT data from Korean adult patients aged ≥25 years, obtained in preparation for third molar extraction, were retrospectively analyzed. These data were obtained from the archive of the Department of Oral and Maxillofacial Radiology, CUDH. Based on patients’
medical records, those with a history of orthodontics, any signs or symptoms of TMD, a history of TMD treatment, and/or a history of local or systemic bone disease were ex- cluded from the study. In addition, images were excluded if they showed degenerative bone changes in the mandibu- lar condyle or the glenoid fossa, fractures (including of the mandible) that affected the condyle or its position, missing
teeth in molar areas affecting the vertical dimension, and/
or were of poor quality. Demographic data (age and sex) were obtained and assessed in terms of their relationship with the thickness of the RGF. All data sets were acquired using the CS9300 3D CBCT device (Carestream Health Inc., Rochester, NY, USA) at CUDH. The following exposure pa- rameters were used: tube potential, 85-90 kV; tube current, 4-5 mA; and field of view, 17×13 cm with a 0.3-mm voxel and 17×11 cm with a 0.25-mm voxel.
2. Image Analysis
Three-dimensional imaging software (OnDemand3D;
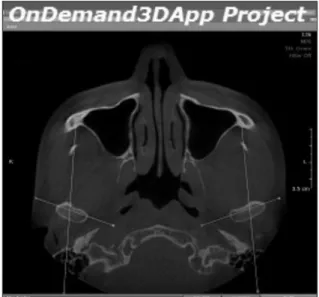
CyberMed Co., Seoul, Korea) was used to prepare images of the glenoid fossa of the temporal bone. The images were reconstructed based on the individual angle of the condy- lar head. Paracoronal sections were obtained parallel to the horizontal axis of the condylar head, and parasagittal sec- tions were reconstructed parallel to the line connecting the center point of the condylar head with the coronoid pro- cess, with 1-mm slice thickness and a 1-mm slice interval (Fig. 1). The reconstructed data sets were exported as Digital Imaging and Communications in Medicine image stacks.
3. Measurement of the Thickness of the RGF
Images of the central region of the glenoid fossa in para- sagittal and paracoronal sections were used for the study
Fig. 1. Axial reconstruction of a cone beam computed tomography
image.
measurements in conjunction with the G3 image program (Infinitt Healthcare, Seoul, Korea). The images were as- sessed in a darkened room on a personal computer with a 32-inch LCD monitor. The contrast and brightness of the images were adjusted using the image processing tool in- cluded in the G3 software to ensure optimal visualization.
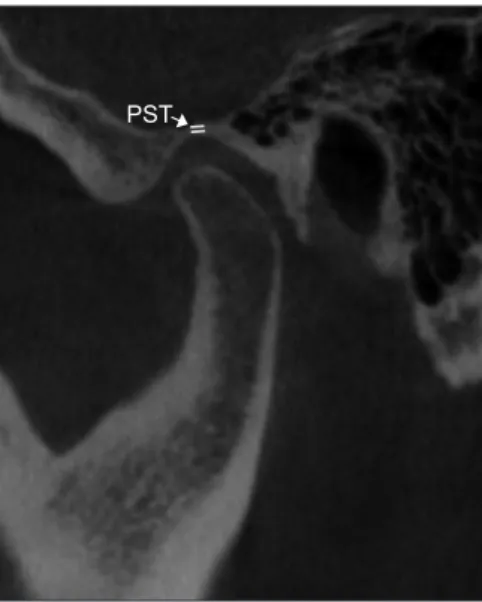
The thickness of the RGF was determined as the perpen- dicular distance between the ‘glenoid fossa line’ and ‘middle cranial fossa line’ on parasagittal (Fig. 2) and paracoronal
reconstructions (Fig. 3) [9].
Measurements of the thickness of the RGF were made three times by a single investigator (JR) at the thinnest part of the glenoid fossa, as identified on the monitor among multiple slices, and the mean value was calculated for sta- tistical analysis [10]. Two weeks after the initial evaluation, 30% of the sample images were reassessed to determine the intra-examiner agreement. In addition, a reliability analy- sis was carried out using 10% of the sample images, which were chosen at random. Measurements were performed by two clinicians (HP and JR), and the inter-examiner reliabil- ity was calculated.
4. Statistical Analysis
Statistical analyses were performed using IBM SPSS Statistics for Windows, Version 25.0 (IBM Co., Armonk, NY, USA). A p-value <0.05 was regarded as statistical- ly significant. All quantitative variables are described as means±standard deviations. Intra- and inter-examiner agreement with respect to measure the RGF thickness was evaluated using the intraclass correlation coefficient (ICC).
Analyses of the RGF thickness according to sex and age were performed using t-tests; the thickness was also com- pared between the right and left sides, and between the paracoronal and parasagittal sides.
RESULTS
Finally, 111 patients (55 male and 56 female; mean age, 33.66±8.19 years) were included in the study. The clini- cal characteristics of the subjects are shown in Table 1. The ICCs for intra- and inter-examiner agreement were 0.975 and 0.947, respectively (p<0.05), which denoted excellent reproducibility and reliability with respect to measurement
Fig. 2. Parasagittal reconstructions of cone beam computed to- mography images. PST, parasagittal thickness of the roof of the glenoid fossa.
PST
Fig. 3. Paracoronal reconstructions of cone beam computed to- mography images. PCT, paracoronal thickness of the roof of the glenoid fossa.
PCT
Table 1. Demographic characteristics of the subjects
Age group Male Female
Age (y)
25-30 y 20 29
31-40 y 21 20
41-50 y 11 5
>51 y 3 2
Total 55 56
Values are presented as number only.
of the thickness of the RGF.
The mean thickness values of the RGF according to sex are shown in Table 2. The mean thickness of the RGF in all subjects was 0.75±0.39 mm. The mean thickness of the RGF for male and female was 0.78±0.36 mm and 0.72±0.30 mm, respectively. There was no significant difference in the RGF thickness between sex (p>0.05, t-test). We also compared the mean RGF thickness between the parasagittal and para- coronal reconstruction images; these did not show a sta- tistically significant difference. The mean thickness of the RGF was greater on the left side (0.77±0.44 mm) than on the right side (0.74±0.33 mm), but the difference was not statistically significant.
To assess the relationship between age and the RGF thick- ness, subject age was stratified by decade (Table 3). Overall, the RGF thickness did not differ significantly according to age. However, the mean thickness of the RGF measured on right paracoronal images was significantly different
between patients aged 31-40 years versus those aged 41-50 years. In addition, the thickness measured on left parasagit- tal images was significantly different between patients aged 21-30 years versus those aged over 51 years. Therefore, the subjects were regrouped based on a cutoff age of 40 years (Table 4); the two groups showed a statistically significant difference in RGF thickness.
DISCUSSION
In this study, the mean thickness of the RGF in asymp- tomatic Korean adults was 0.75 mm (0.75 mm for male and 0.72 mm for female). These findings are similar to those of a Japanese autopsy study [11]. In contrast, the mean thick- ness was 0.97 mm for Europeans [10] and 1.12 mm for Iranians [12]. Although the mean thickness of the RGF is known to vary from 0.5 to 1.5 mm [13], these variations could be due to age differences among subjects. In the present study, adults aged ≥25 years were selected as the study group. In contrast, the European and Iranian stud- ies included children or adolescents, as well as adults. We enrolled adults aged ≥25 years because mandibular height growth is known to be completed after 20 years of age [14].
Although the growth of the temporal bone, including the articular eminence, is morphologically complete around pu- berty [15], the mandibular condyle and glenoid fossa can
Table 2. The mean thickness of the roof of the glenoid fossa according to sex
Sex Rt. Paracoronal (mm) Lt. paracoronal (mm) Rt. Parasagittal (mm) Lt. parasagittal (mm) Total (mm)
Male 0.76±0.37 0.82±0.41 0.76±0.31 0.80±0.48 0.78±0.36
Female 0.73±0.31 0.69±0.40 0.71±0.32 0.73±0.28 0.72±0.30
Total 0.74±0.34 0.78±0.47 0.73±0.31 0.76±0.39 0.75±0.39
Rt, right; Lt, left.
Values are presented as mean±standard deviation.
p>0.05, t-test.
Table 3. The mean thickness of the roof of the glenoid fossa according to age
Age group Rt. Paracoronal (mm) Lt. paracoronal (mm) Rt. Parasagittal (mm) Lt. parasagittal (mm) Total (mm)
25-30 y 0.75±0.33 0.80±0.39 0.73±0.35 0.81±0.41 0.77±0.37
31-40 y 0.69±0.24 0.69±0.33 0.69±0.23 0.65±0.18 0.68±0.24
41-50 y 0.85±0.31 0.81±0.38 0.84±0.34 0.79±0.27 0.82±0.32
>51 y 0.78±0.40 1.10±0.54 0.79±0.44 1.26±0.70 0.98±0.52
Rt, right; Lt, left.
Values are presented as mean±standard deviation.
p>0.05, t-test.
Table 4. The mean thickness of the RGF according to revised age groups
Age group Total RGF thickness (mm) p-value
≤40 y 0.73±0.32 0.011
a>40 y 0.86±0.37
RGF, roof of the glenoid fossa.
Values are presented as mean±standard deviation.
a