ISSN 0378-6471 (Print)⋅ISSN 2092-9374 (Online)
http://dx.doi.org/10.3341/jkos.2016.57.3.361
Original Article
위수정체안에서 자동각막굴절계와 이중샤임플러그에 의한 난시의 상관관계 분석
Astigmatic Correlation between the Automated Refractometry and Dual Scheimpflug Analyzer in Pseudophakic Eyes
박승훈1⋅송인석2⋅성민철1⋅조희윤1⋅강민호1
Seung Hun Park, MD1, In Seok Song, MD, PhD2, Min Cheol Seong, MD, PhD1, Hee Yoon Cho, MD, PhD1, Min Ho Kang, MD, PhD1
한양대학교 의과대학 한양대학교구리병원 안과학교실1, 한양대학교 의과대학 한양대학교병원 안과학교실2 Department of Ophthalmology, Hanyang University Guri Hospital, Hanyang University College of Medicine1, Guri, Korea
Department of Ophthalmology, Hanyang University Hospital, Hanyang University College of Medicine2, Seoul, Korea
Purpose: To examine the relationship between the refractive astigmatism by automated refractometry and the corneal astigma- tism by a dual Scheimpflug analyzer in pseudophakic eyes.
Methods: Prospectively, 75 patients (100 eyes) were enrolled in the present study. Refractive astigmatism was obtained by auto- mated refraction. Corneal astigmatism was obtained using automated keratometry (ARK-530A®) and dual Scheimpflug scanning analysis (Galilei G4®). All refractive values were converted to the power vector components J0 and J45 for comparison and re- gression analysis of refractive versus corneal astigmatism. Bland-Altman plots were created to estimate the agreement between measurements.
Results: The average astigmatism from each measurement was -1.11 ± 1.44 D (refractive astigmatism from automated re- fraction), -0.77 ± 1.06 D (corneal astigmatism from automated keratometry), -0.93 ± 1.02 D (simulated K from Galilei G4®), and -1.11 ± 1.48 D (total corneal power from Galilei G4®). Refractive J0 and keratometric J0 were significantly correlated (r = 0.557, p ≤ 0.001), as well as the corresponding J45 values (r = 0.655, p = 0.025). Refractive astigmatism and total corneal power com- ponents were also significantly correlated (J0: r = 0.618, p ≤ 0.001; J45: r = 0.608, p = 0.04). In the Bland-Altman plots, kerato- metric J0 and total corneal power J0 showed the best agreement.
Conclusions: The accuracy of measurements for corneal refraction and astigmatism in pseudophakic eyes is higher using the dual Scheimpflug analyzer, especially for total corneal power. This value of astigmatism can take into account the refractive as- tigmatism of pseudophakic eyes and can be used in evaluating postoperative corneal astigmatism.
J Korean Ophthalmol Soc 2016;57(3):361-368
Keywords: Dual Scheimpflug analyzer, Galilei G4®, Pseudophakia, Refractive and keratometric astigmatism
■Received: 2015. 5. 22. ■ Revised: 2015. 10. 6.
■Accepted: 2015. 12. 12.
■Address reprint requests to Min Ho Kang, MD, PhD Department of Ophthalmology, Hanyang University Guri Hospital, #153 Gyeongchun-ro, Guri 11923, Korea Tel: 82-31-560-2350, Fax: 82-31-564-9479 E-mail: [email protected]
* This study was presented as a narration at the 111th Annual Meeting of the Korean Ophthalmological Society 2014.
ⓒ2016 The Korean Ophthalmological Society
This is an Open Access article distributed under the terms of the Creative Commons Attribution Non-Commercial License (http://creativecommons.org/licenses/by-nc/3.0/) which permits unrestricted non-commercial use, distribution, and reproduction in any medium, provided the original work is properly cited.
굴절난시는 이론적으로는 각막 앞면, 각막 뒷면, 수정체, 미세한 망막요소에 의해 결정된다.1,2 망막요소가 임상적으 로 큰 비중을 차지하지는 않으므로, 굴절난시에 크게 기여 하는 두 가지 해부학적 구조는 각막과 수정체이다. 따라서 백내장 수술로 수정체 요소가 없어졌을 때 이론적으로 굴 절난시와 각막난시는 일치해야 한다. 그러나 둘은 다른 값 으로 측정되며, 각막난시는 굴절난시의 30% 정도를 설명
할 수 있는 것으로 보고된 바 있다.2
기존의 연구에서 각막굴절력 측정에 자동각막굴절계, 각 막지형도가 높은 재현성을 보인다고 알려져 있다.3-5 자동각 막굴절계는 각막이 구형이라는 가정하에 3.3 mm의 직경 안에서 반사상을 카메라가 인지하여 각막곡률을 측정한다.
이중샤임플러그 전안부 촬영기인 Galilei G4®는 placido imaging과 dual camera Scheimpflug imaging을 결합한 방 식으로, 2개의 샤임프러그 카메라가 눈의 반대편에서 자연 스럽게 이미지를 얻고, 중심이탈을 보정한다. 나아가 Placido disk로부터 각막의 전면곡률을 측정할 수 있고, 홍채상에 기반한 움직임 교정법으로 각막굴절률을 정확하게 측정할 수 있는 장점이 있다.3,6,7 이러한 장점을 기반으로 각막, 동 공, 전방 등의 영상과 생채 계측치를 얻을 수 있다.
위수정체안에서 굴절난시 값이 Galilei G4®로 측정한 수 치 중 ray tracing 법으로 측정된 total cornea power가 자동 각막굴절계의 굴절난시값과 일치하지 않기에 저자들은, Galilei G4®를 이용해 위수정체안의 각막 난시를 측정하고 이를 자동굴절계로 측정된 굴절난시 및 각막난시와 비교하 여 연관성을 확인하여 위수정체안의 난시의 양과 축을 가 장 잘 반영하는 것이 어떤 수치인지 알아보고자 하였다.
대상과 방법
본 연구는 한양대학교 구리병원 임상시험 심사위원회의 심의 및 승인을 받았다(심사승인번호 2014-11-002). 한양대 학교 구리병원에서 2014년 11월부터 2014년 12월까지의 의무기록을 후향적으로 분석하여, 수정체초음파유화술 및 인공수정체삽입술을 시행 받은 75명(100안)의 환자를 대상 으로 하였다. 모든 수술은 동일한 한 명의 술자(MH Kang) 에 의해 투명 각막 절개로 이루어졌다. 절개창은 2.8 mm이 며, 수술 전 자동굴절각막계의 굴절난시 값이 0.5D 이하인 경우 이측 투명 각막 절개를 시행하였고, 0.5D 초과인 경우 가파른 각막난시 축에 따라 절개를 시행하였다. 적어도 3개 월 이상 추적 관찰이 된 경우만 포함하였으며 백내장 수술 전과 한 달 후의 굴절난시, 각막난시를 측정하였다. 모든 환자는 술 전 및 술 후에 자동각막곡률검사 및 Galilei G4®, 세극등현미경검사를 시행하였고 굴절난시와 각막난시의 변화를 분석하였다. 외상, 혼탁, 심한 건성안으로 인한 각막 병변이 있는 환자와 수술 중 후낭파열이 있거나 인공수정 체를 후낭에 삽입 못한 경우는 제외하였다.
망막검영법으로 현성 굴절검사를 시행하였으며 굴절값 은 power vector analysis를 사용하여 디옵터(diopter)에서 벡터값(Vector)으로 변환되었다.8 구면렌즈값을 M, 원주렌 즈값에 대한 0도 축 벡터에서의 Jackson cross cylinder 값을
J0, 45도 축 벡터에서의 Jackson cross cylinder 값을 J45로 설 정하였으며, J45는 사선 난시를 의미하게 된다.9 구면렌즈, 원 주렌즈, 축의 값을 벡터로 변환하는 공식은 다음과 같다.
M=S+C/2
J0=(-C/2) cos (2α) J45=(-C/2) cos (2α)
(M=spherical equivalent; S=spherical; C=cylinder; α=axis)
각막 굴절력 측정
검사안에 대해 자동각막굴절계(ARK-530A®, NIDEK, Gamagori, Japan), 각막지형도(Galilei G4®, Zeimer, Port, Switzerland) 검사를 통한 각막 굴절력을 측정하였다. 자동 각막굴절계의 굴절난시와 각막난시, Galilei G4®의 simu- lated keratometry (Sim K)와 total corneal power (TCP) 등 네 개의 지표를 구하였다.
Galilei G4®의 Sim K는 각막 중심 1.0 mm에서 4.0 mm 영역의 각막전면 곡률(curvature)과 각막굴절상수(1.3375) 를 이용하여 구현하였다. TCP는 스넬의 법칙을 기반으로, 각막 중심 1.0 mm에서 4.0 mm 영역을 각막전면과 각막후 면을 통하여 ray tracing 기법으로 측정하였다.
파면수차 분석
Galilei G4®에서 얻은 각막파면수차값을 이용하여 자동 각막굴절계의 굴절난시와 일치도가 높을 때와 낮을 때 파 면수차의 의미 있는 차이가 있는지 확인하였다.
통계분석
자동각막굴절계의 굴절난시와 각막난시, Galilei G4®의 Sim K와 TCP 등 네 항목을 비교하기 위해 Spearman rank correlation을 사용하였다. Bland–Altman plot을 이용하여 항목 간 일치성을 평가하였다. 95% 신뢰구간에서 평균차 이는 ±1.96 SD였다. p값이 0.05 이하인 경우 통계적으로 의 미 있는 차이로 간주하였다. 통계적인 분석은 SPSS v 18.0 for Windows (SPSS Inc., Chicago, IL, USA)를 사용하였다.
결 과
대상 환자는 75명 100안이었고 남자가 28명(37.3%), 여 자가 47명(62.7%)이었으며, 평균 연령은 69.1 ± 12.0세였 다. 위수정체안의 자동굴절각막계의 굴절난시 -1.11 ± 0.72D, 각막난시 -0.77 ± 0.52D, Galilei G4®의 Sim K는 -0.93 ± 0.51D, TCP는 -1.11 ± 0.64D였다(Table 1). 굴절난시, TCP, Sim K, 각막난시 순으로 높게 측정되었다(각각 p<0.001,
Table 1. Characteristics of patients included
N Mean 95% Confidence interval Range
Age (years) 75 69.14 66.68~71.46 40~92
Cylinder
AR 100 -1.11 ± 0.72 D -1.26~-0.98 -4.0~0
AK 100 -0.77 ± 0.52 D -0.87~-0.67 -3.25~0
TCP 100 -1.11 ± 0.64 D -1.27~-0.97 -4.22~0.87
Sim K 100 -0.93 ± 0.51 D -1.02~-0.83 -2.89~-0.06
J0
AR 100 -0.37 ± 0.48 D -0.47~-0.28 -1.96~1.50
AK 100 -0.01 ± 0.40 D -0.09~0.07 -1.43~1.58
TCP 100 -0.29 ± 0.51 D -0.38~-0.19 -2.10~0.75
Sim K 100 -0.1 ± 0.43 D -0.19~-0.01 -1.44~0.92
J45
AR 100 0.05 ± 0.25 D 0~0.10 -0.59~0.75
AK 100 0.05 ± 0.23 D 0~0.10 -0.39~0.74
TCP 100 0.03 ± 0.33 D -0.04~0.09 -0.86~1.11
Sim K 100 0.01 ± 0.28 D -0.05~0.06 -0.84~0.83
Values are presented as mean ± SD unless otherwise indicated.
AR = automated refractive astigmatism; AK = automated keratometric astigmatism; TCP = total corneal power; Sim K = simulated K; D
= diopter.
Table 2. Difference between dual Scheimpflug analyzer readings and automated K readings
Parameter Difference (D) p-value
Mean ± SD 95% Confidence interval
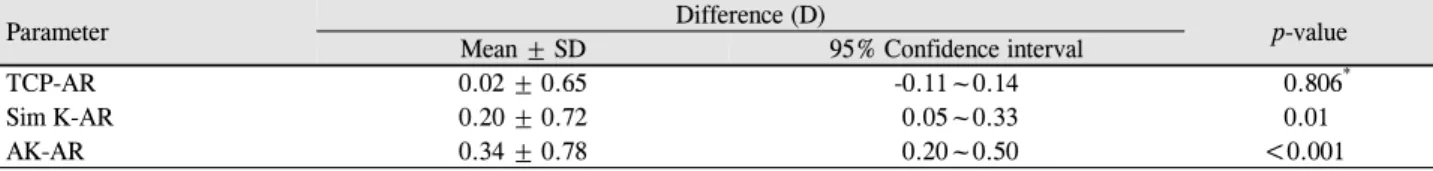
TCP-AR 0.02 ± 0.65 -0.11~0.14 0.806*
Sim K-AR 0.20 ± 0.72 0.05~0.33 0.01
AK-AR 0.34 ± 0.78 0.20~0.50 <0.001
Values are presented as mean ± SD unless otherwise indicated.
D = diopter; SD = standard deviation; TCP = total corneal power; AR = automated refractive astigmatism; Sim K = simulated K; AK = automated keratometric astigmatism.
*No statistically significant difference.
Figure 1. Difference between corneal astigmatism measured
by autokerotometer (ARK-530A, NIDEK, Gamagori, Japan) and dual Scheimpflug analyzer in pseudophakic eyes. Note that astigmatism is measured more in total corneal power of Scheimpflug analyzer than keratometric astigmatism of autokero- tometer and simulated K of Scheimpflug analyzer (respectively p<0.001, p<0.001, paired t-test).p=0.018, paired t-test) (Fig. 1).
Paired t-test 결과 각막난시와 굴절난시 차이(95% 신뢰구 간 0.20~0.50D), Sim K와 굴절난시 차이(95% 신뢰구간 0.05~0.33D)는 통계적으로 유의하며(p<0.001, p=0.01), TCP 와 굴절난시 차이(95% 신뢰구간 -0.11~0.14D)는 유의하지 않았다(p=0.806) (Table 2).
난시축을 비교하였을 때, 자동각막굴절계의 굴절난시축 은 81.2 ± 34.0o, 각막난시축은 71.8 ± 55.6o였으며, Galilei G4®의 Sim K는 84.8 ± 49.6o, TCP는 81.6 ± 42.5o였다.
Axis distribution을 보여주는 산점도에서는 각막난시 -1.00D, 난시축 90o에 많이 분포하는 양상이었다(Fig. 2).
굴절난시와 자동각막곡률계 난시의 비교
J0과 J45의 굴절난시와 각막난시 간 선형회귀분석을 시 행하였다. J0에서 굴절난시와 각막난시는 유의한 상관관계 가 있었고(r=0.557, p<0.001; Fig. 3A), J45에서도 같은 결과 였다(r=0.655, p=0.025; Fig. 3B). Bland-Altman plot에서 굴 절난시 J0와 각막난시 J0 사이의 95% 신뢰도는 -0.78~0.06
Figure 2. Axis distribution (degrees) of refractive astigma-
tism, keratometric astigmatism, simulated K and total corneal power of Scheimpflug analyzer. Most of them are distributed in 90 degree axis and -1.0 diopter astigmatism. Astig = astigma- tism; Sim K = simulated K; total = total corneal power; Ref= refractive astigmatism; kerato = keratometric astigmatism.
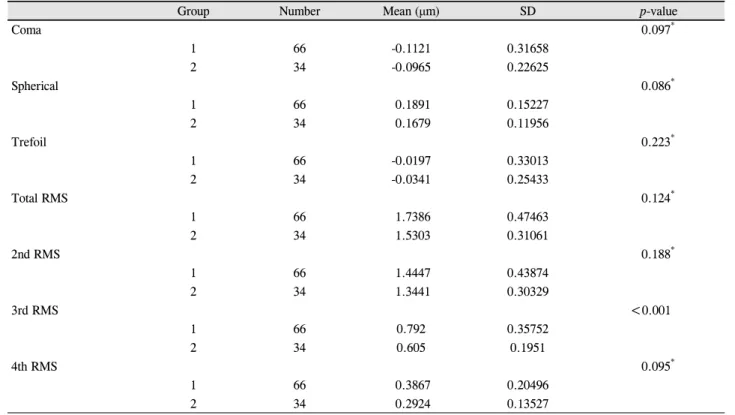
Table 3. The predictive aberration parameters for the total corneal power
Group Number Mean (μm) SD p-value
Coma 0.097*
1 66 -0.1121 0.31658
2 34 -0.0965 0.22625
Spherical 0.086*
1 66 0.1891 0.15227
2 34 0.1679 0.11956
Trefoil 0.223*
1 66 -0.0197 0.33013
2 34 -0.0341 0.25433
Total RMS 0.124*
1 66 1.7386 0.47463
2 34 1.5303 0.31061
2nd RMS 0.188*
1 66 1.4447 0.43874
2 34 1.3441 0.30329
3rd RMS <0.001
1 66 0.792 0.35752
2 34 0.605 0.1951
4th RMS 0.095*
1 66 0.3867 0.20496
2 34 0.2924 0.13527
Group 1 means ΔJ0 ≥ 0.25 or ΔJ0 ≤ -0.25, and Group 2 means -0.25 < ΔJ0 < 0.25 D.
SD = standard deviation; RMS = root mean square.
*No statistically significant difference.
이며(Fig. 4A), J45에서는 -0.20~0.20이었다(Fig. 4B).
굴절난시와 Simulated K의 비교
J0에서 굴절난시와 Sim K는 유의한 상관관계가 있었고 (r=0.623, p<0.001; Fig. 3C), J45에서도 같은 결과였다 (r=0.585, p=0.025; Fig. 3D). Galilei G4®의 Simulated K 역 시 굴절난시를 유추하는 데 도움이 됨을 알 수 있다. Bland- Altman plot에서 굴절난시 J0와 Sim K J0 사이의 95% 신 뢰도는 -0.66~0.12이며(Fig. 4C), J45에서는 -0.20~0.28이었 다(Fig. 4D).
굴절난시와 total corneal power의 비교
J0에서 굴절난시와 TCP는 유의한 상관관계가 있었고 (r=0.618, p<0.001; Fig. 3E), J45에서도 유의한 상관관계를 보였다(r=0.608, p=0.04; Fig. 3F). Bland-Altman plot에서 굴절난시 J0와 TCP J0 간 95% 신뢰도는 -0.49~0.31이며 (Fig. 4E), J45에서는 -0.23~0.29였다(Fig. 4F).
Total corneal power와 파면수차의 비교
굴절난시 J0와 TCP J0의 차이가 ±0.25D보다 클 경우와 작 은 경우로 나누어 파면수차와의 관계를 확인하였다(Table 3).
A B
C D
E F
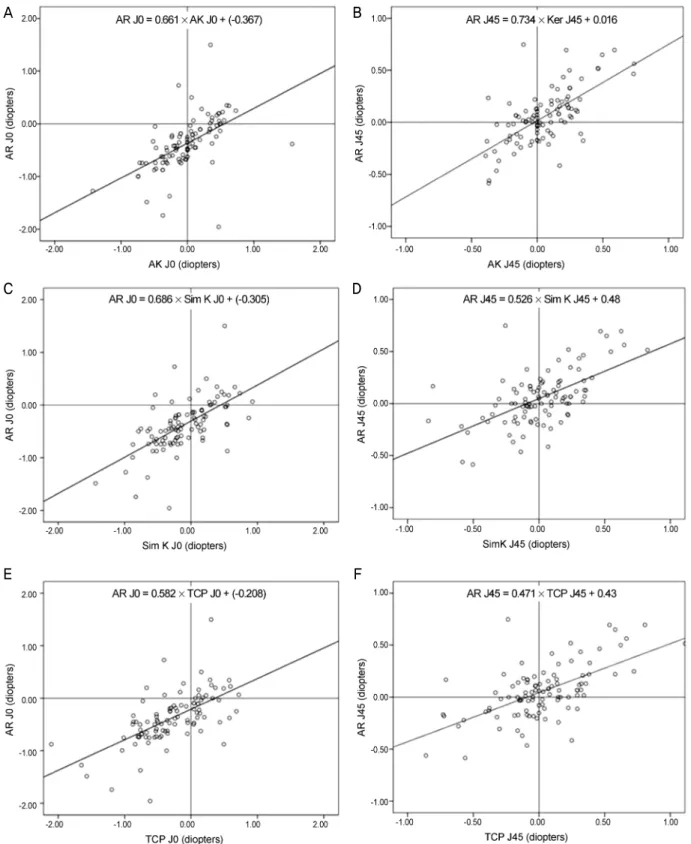
Figure 3. Regression lines between refractive astigmatism J0 and keratometric astigmatism J0 (A) and J45 (B), refractive astigma-
tism J0 and Simulated K J0 (C) and J45(D) and refractive astigmatism J0 and total corneal power J0 (E) and J45 (F) by Jackson vec- tor analysis. Refractive and keratometric astigmatism J0 were significantly correlated (r = 0.557, p < 0.001; A), and also the corre- sponding J45 values (r = 0.655, p = 0.025; B). Refractive and Simulated K astigmatic components were significantly correlated (J0: r = 0.623, p < 0.001; J45: r = 0.585, p = 0.025) (C, D). Refractive and total corneal power astigmatic components were sig- nificantly correlated (J0: r = 0.618, p < 0.001; J45: r = 0.608, p = 0.04) (E, F). AR= refractive astigmatism; AK = keratometric astigmatism; Sim K = simulated K; TCP = total corneal power.A B
C D
E F
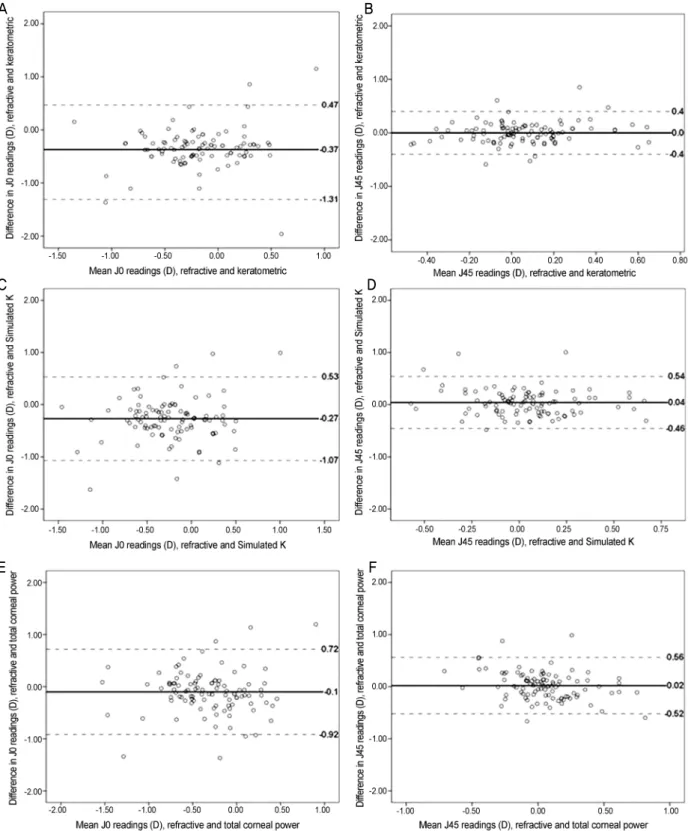
Figure 4. Bland–Altman plots (solid line: mean, dotted lines: mean ± 1.96 SD) of the difference between refractive astigmatism J0
and keratometric astigmatism J0 against their mean (A), between refractive astigmatism J0 and Simulated K J0 against their mean (C), between refractive astigmatism J0 and total corneal power J0 by ray-tracing against their mean (E) and J45 (B, D, F), respectively. Bland-Altman plots show good agreement between refractive and keratometric J0 (difference: -0.78~0.06) and J45 astigmatic components (difference: -0.20~0.20; A, B, respectively). Agreement between refractive and simulated K J0 (difference:-0.66~0.12) and J45 (difference: -0.20~0.28) astigmatic components was good (C, D, respectively). Agreement between re- fractive and total corneal power J0 (difference:-0.49~-0.31) and J45 (difference: -0.23~ 0.29) astigmatic components was good E, F, respectively). SD = standard deviation; D=diopters.
66안이 굴절난시 J0와 TCP J0 차이가 ±0.25D보다 크거나 같았고(group 1), 34안이 ±0.25D보다 작았다(group 2). 2차 root mean square (RMS) (p=0.188), 4차 RMS (p=0.095)에 서 두 그룹 간 의미 있는 차이는 없었고, 3차 RMS의 평균 에서 의미 있는 차이가 있었다(p<0.001).
고 찰
백내장 수술 후 나안 시력의 향상이 환자의 수술 만족도 에 영향을 끼치고 있으며, 이를 위해서는 술 후 굴절상태에 대한 예측이 중요하다. 백내장 수술기법의 발전과 난시교 정 인공수정체의 도입, 인공수정체 도수계산 공식의 다양 화로 수술 후 각막난시의 예측이 가능해지고 있다. 최근 자 동각막굴절계, 각막지형도, IOL Master®가 이용되면서 난시 예측이 정확해졌으며, 여러 연구에서 보고된 바 있다.3,5,10 그 러나 Koch et al11은 각막후면의 난시를 고려하지 않으면 전체 각막 난시의 예측이 부정확하다고 했다. Thibos and Horner8와 Thibos et al9은 Pentacam®을 이용하여 각막후면 난시를 고려해 전체 각막난시를 계산하였으나 위수정체안 의 난시 예측이 부정확한 것으로 나타났다.
Han et al5은 위수정체안을 대상으로 자동굴절검사, IOL Master, 각막지형도의 simulated K를 이용하여 각막난시를 측정하였다. 각각의 각막난시는 -0.97 ± 0.81D, -1.07 ± 0.82D, -0.99 ± 0.75D로 자동굴절검사보다 각막지형도의 simulated K가 더 높게 측정되었으며 이는 기기마다 측정 범위가 다르고 측정지점이 달라 생길 것으로 생각된다. 굴 절난시와 다른 세 개의 지표 차이의 유의성을 보았을 때 굴 절난시와 total corneal power는 통계적으로 유의한 차이가 없었고(p=0.806) 굴절난시와 simulated K, 굴절난시와 각막 난시 각각은 유의하게 차이가 있었다(p=0.01, p<0.001).
위수정체안의 각막난시에 대한 기존 연구는 수술로 유발 된 각막 난시에 초점을 두었고,12-14 본 연구에서는 위수정 체안을 대상으로 각막난시를 벡터변환법에 의해 J0, J45로 변환하여 분석하였으며, 수직, 수평 또는 사선 경선의 가장 가파른 축을 분석할 수 있었다. Tejedor and Guirao15의 연 구에서 자동굴절각막계의 굴절난시 J0, J45 각각은 -0.10D, 0D였고 Pentacam®의 simulated K J0, J45 각각은 -0.09D, -0.11D, 자동각막굴절계의 각막난시 J0, J45는 0.05D, -0.02D였다. 굴절난시, simulated K는 본 연구와 비슷하였 고, 자동각막굴절계의 각막난시는 직난시, 도난시 양상이 다른 점이 있었으나 이는 임상적 의의는 크지 않을 것으로 보였다. 벡터변환법 후 J0, J45에 대한 선형회귀분석상 굴 절난시와 각막난시, 굴절난시와 TCP, 굴절난시와 Sim K 간의 연관성이 있음을 확인하였다(Fig. 3).
Bland-Altman plot으로 나타낸 지표 간의 일치도에서 모 든 지표들은 95% 신뢰도가 -1.31~+0.72D에 있었으며 특히 굴절난시 J45와 각막난시 J45, 굴절난시 J45와 Sim K J45 의 95% 신뢰도 1.0D 이하의 범위 안에 있어 높은 일치도를 보였다(Fig. 4). 굴절난시 J0와 TCP J0 간 차이의 평균이 굴 절난시 J0와 각막난시 J0 또는 굴절난시 J0와 Sim K J0의 차 이의 평균보다 적게 나왔고, TCP 값이 더 일치하게 나왔지 만 일치한다고 보기에는 표준편차가 크게 측정되었다.
저자들은 표준편차가 작을 경우 TCP J0와 굴절난시 J0 가 좀 더 일치할 것으로 생각하여, ±0.25D, ±0.50D, ±0.75D 기준으로 파면수차와의 관계를 분석해 보았다. 그 결과 TCP J0와 굴절난시 J0의 차이를 ±0.25D 기준으로 편차가 크고 작은 그룹으로 나누어 파면수차를 분석했을 때 3차 RMS의 평균값에서 두 그룹 간 유의한 차이가 있었다. 편차가 작은 그룹(평균=0.605)보다 편차가 큰 그룹(평균=0.792)에서 3 차 RMS 평균이 더 높음을 알 수 있으며, 따라서 3차 RMS 가 0.70보다 작을 때, 위수정체안에서 TCP J0와 굴절난시 J0의 일치도가 높으면서 편차는 적을 것으로 사료된다. 그 러나 3차 RMS에는 coma, trefoil 등의 개념이 포함되는데 본 연구에서는 coma와 trefoil에서 차이가 없지만, 전체적인 3차 RMS에서는 두 그룹 간 차이가 있다는 점에서 수술 전 난시상태 및 surgically induced astigmatism 등이 파면수차 에 영향을 미쳤을 수도 있어 이에 대한 추가적인 연구가 필 요할 것으로 사료된다.
본 연구에서는 위수정체안에서 자동굴절각막계로 측정 한 각막난시, Galilei G4®로 측정한 TCP, Sim K를 굴절난 시와 비교하였다. 이전 각막후면 난시와 관련된 연구와의 차이점은 이중샤임플러그 분석기를 사용했다는 것과 계산 하여 구하지 않고 ray tracing에 의해 측정된 값을 사용했다 는 것, 벡터 변환법을 이용해 수직 또는 수평 경선의 난시 나 사선의 난시 축을 분석했다는 점과 파면수차와 연관지 었다는 점이다.
Galilei G4®의 Total corneal power 각막난시가 자동각막 곡률계의 굴절난시와 비교적 높은 일치도를 보이나, 일부 일치하지 않은 경우는 측정 시 눈물층의 불안정이나 검사 시 환자의 협조 등에 의해 영향을 받을 수 있을 것으로 생 각된다. 또한 3차 RMS 평균이 0.7보다 작을 경우 total cor- neal power의 난시 벡터값이 0도 혹은 90도에서 자동각막 곡률계의 난시와 일치도가 높은 경향이 있어 각막수차의 영향이 있을 것으로 생각된다.
결론적으로, Galilei G4®, 자동각막곡률계의 검사값에 더 불어 추가적인 각막지형도검사의 값을 고려한다면 백내장 수술 후 각막난시의 예측에 도움이 될 것이다. 특히 수차 분석 후 3차 RMS 평균이 0.7보다 작을 경우 total corneal
= 국문초록 =
위수정체안에서 자동각막굴절계와 이중샤임플러그에 의한 난시의 상관관계 분석
목적: 자동각막굴절계와 이중샤임플러그 전안부 촬영기(Galilei G4®)에서 제공하는 다양한 각막난시 수치의 상관관계를 분석하여 위수 정체안에서 굴절난시와 일치도가 높은 수치에 대해 알아보았다.
대상과 방법: 백내장 수술을 받고 한 달 이상 경과된 75명 100안을 대상으로 굴절난시, 각막난시를 자동각막굴절계(ARK-530A®), 이 중샤임플러그 전안부 촬영기(Galilei G4®)를 이용하여 측정하였다. 자동각막굴절계의 굴절난시(automated refractive astigmatism), 각 막난시(automated keratometric astigmatism)와 Galilei G4®에서 측정된 total corneal power (TCP), simulated K (Sim K)를 구하였으 며, Jacksons cross cylinder를 이용하여 vector 분석을 시행하였다. 통계 분석은 Spearman rank correlation으로 선형상관관계 분 석을 하였고, Bland-Altman plot으로 검사 간 일치도를 분석하였다.
결과: 자동각막굴절계의 굴절난시의 평균은 -1.11 ± 1.44D, 각막난시는 -0.77 ± 1.06D였고, Galilei G4®의 각막난시는 Sim K에서는 -0.93 ± 1.02D, TCP는 -1.11 ± 1.48D였다. Vector 분석에서는 자동각막굴절계의 굴절난시와 각막난시, Galilei G4®의 Sim K, TCP 모두 유의한 선형상관관계를 보였다. Bland-Altman graph에서 난시축과 난시값의 굴절난시와의 차이의 평균과 표준편차가 TCP에서 가장 작았다.
결론: 위수정체안에서 Galilei G4®의 난시 측정값 중 굴절난시를 ray tracing을 통해 측정한 각막난시가 굴절난시를 가장 잘 나타낸다.
이 지표는 위수정체안에서의 굴절 난시를 설명하고 백내장 수술 후 각막난시를 평가하는 데 도움이 될 것으로 생각된다.
<대한안과학회지 2016;57(3):361-368>
power 값이 자동각막곡률계의 난시값과 일치도가 높아 참 고가 될 것으로 판단된다.
REFERENCES
1) Ho JD, Liou SW, Tsai RJ, Tsai CY. Effects of aging on anterior and posterior corneal astigmatism. Cornea 2010;29:632-7.
2) Teus MA, Arruabarrena C, Hernández-Verdejo JL, et al. Correlation between keratometric and refractive astigmatism in pseudophakic eyes. J Cataract Refract Surg 2010;36:1671-5.
3) Shirayama M, Wang L, Koch DD, Weikert MP. Comparison of ac- curacy of intraocular lens calculations using automated kera- tometry, a Placido-based corneal topographer, and a combined Placido-based and dual Scheimpflug corneal topographer. Cornea 2010;29:1136-8.
4) Butcher JM, O'Brien C. The reproducibility of biometry and kera- tometry measurements. Eye (Lond) 1991;5(Pt 6):708-11.
5) Han JM, Choi HJ, Kim MK, et al. Comparative analysis of corneal refraction and astigmatism measured with Autokeratometer, IOL master, and topography. J Korean Ophthalmol Soc 2011;52:1427-33.
6) Shirayama M, Wang L, Weikert MP, Koch DD. Comparison of cor- neal powers obtained from 4 different devices. Am J Ophthalmol 2009;148:528-35.e1.
7) Menassa N, Kaufmann C, Goggin M, et al. Comparison and re-
producibility of corneal thickness and curvature readings obtained by the Galilei and the Orbscan II analysis systems. J Cataract Refract Surg 2008;34:1742-7.
8) Thibos LN, Horner D. Power vector analysis of the optical out- come of refractive surgery. J Cataract Refract Surg 2001;27:80-5.
9) Thibos LN, Wheeler W, Horner D. Power vectors: an application of Fourier analysis to the description and statistical analysis of re- fractive error. Optom Vis Sci 1997;74:367-75.
10) Findl O, Drexler W, Menapace R, et al. High precision biometry of pseudophakic eyes using partial coherence interferometry. J Cataract Refract Surg 1998;24:1087-93.
11) Koch DD, Ali SF, Weikert MP, et al. Contribution of posterior cor- neal astigmatism to total corneal astigmatism. J Cataract Refract Surg 2012;38:2080-7.
12) Axt JC, McCaffery JM. Reduction of postoperative against- the-rule astigmatism by lateral incision technique. J Cataract Refract Surg 1993;19:380-6.
13) Kohnen S, Neuber R, Kohnen T. Effect of temporal and nasal un- sutured limbal tunnel incisions on induced astigmatism after phacoemulsification. J Cataract Refract Surg 2002;28:821-5.
14) Masket S, Wang L, Belani S. Induced astigmatism with 2.2- and 3.0-mm coaxial phacoemulsification incisions. J Refract Surg 2009;25:21-4.
15) Tejedor J, Guirao A. Agreement between refractive and corneal as- tigmatism in pseudophakic eyes. Cornea 2013;32:783-90.