INTRODUCTION
Calcium plays essential roles in neural excitation, muscle contraction, blood conjugation, bone formation, hormone secre- tion, cell adhesion, and enzyme activation. Blood concentra- tion of calcium is tightly controlled within a narrow range by harmonious cooperation between three organs; kidney, bone, and intestine.
The kidneys contribute to calcium homeostasis by control- ling calcium excretion. Only unbound calcium, which is 60
% of total calcium, is filtered and most of the filtered calci- um is reabsorbed in the proximal tubule (PT) and the thick ascending limb (TAL) passively via paracellular pathway driv- en by sodium and water reabsorption (1-3). Fine regulation of calcium excretion occurs in the distal nephron, where small fraction of filtered calcium is reabsorbed by active transcellu- lar calcium transport. Transporters involved in this process include transient receptor potential vanilloid 5 (TRPV5) and transient receptor potential vanilloid 6 (TRPV6) on the lumi-
nal membrane, calbindin-D28Kin the cytoplasm, and Na+-Ca2+
exchanger type 1 (NCX1) and plasma membrane Ca2+-ATP ase (PMCA) on the basolateral membrane (4). TRPV5 has been considered to play the most important role in active calcium reabsorption and its coexistence with calbindin-D28K, NCX1, and PMCA has been proved by immunohistochemistry (5).
Renal loss of calcium is one of the proposed mechanisms of idiopathic hypercalciuria. Idiopathic hypercalciuria is char- acterized by urinary calcium excretion of >0.1 mM/kg/day (>4 mg/kg/day) without a definite underlying cause (6, 7).
Despite being named by Albright about 50 yr ago (8), the pathophysiology is still unclear and diagnosis remains exclu- sive. Proposed pathogenic mechanisms are increased intesti- nal calcium reabsorption, increased renal loss, and augment- ed bone resorption (9, 10).
Thiazide diuretics, which inhibit sodium-chloride cotrans- porter (NCC) in the distal convoluted tubule, have been adopt- ed as a treatment of choice for idiopathic hypercalciuria due to their hypocalciuric effect (11). Although several reports de-
S161
Hye Ryoun Jang, Sejoong Kim, Nam Ju Heo, Jeong Hwan Lee, Hyo Sang Kim, Soren Nielsen*, Un Sil Jeon�, Yun Kyu Oh, Ki Young Na, Kwon Wook Joo, and Jin Suk Han
Department of Internal Medicine, Seoul National University College of Medicine, Seoul, Korea; Institute of Anatomy*, University of Aarhus, The Water and Salt Research Center, Aarhus, Denmark; Postech Biotech Center�, Pohang University of Science & Technology, Pohang, Korea
Address for correspondence Jin Suk Han, M.D.
Department of Internal Medicine, Seoul National University, 28, Yeongeon-dong, Jongno-gu, Seoul 110-744, Korea
Tel : +82.2-2072-2392, Fax : +82.2-3673-2392 E-mail :[email protected]
*This work was supported by Grant 04-2006-117 from the SNUH (Seoul National University Hospital) Research Fund and partly by Grant R01-2003-000- 10665-0 from the Basic Research Program of the Korea Science & Engineering Foundation.
DOI: 10.3346/jkms.2009.24.S1.S161
Effects of Thiazide on the Expression of TRPV5, Calbindin-D
28K, and Sodium Transporters in Hypercalciuric Rats
TRPV5 is believed to play an important role in the regulation of urinary calcium excre- tion. We assessed the effects of hydrochlorothiazide (HCTZ) on the expression of TRPV5, calbindin-D28K, and several sodium transporters in hypercalciuric rats. Sp- rague-Dawley rats were divided into 4 groups; control, HCTZ, high salt, and high salt with HCTZ group in experiment 1; control, HCTZ, high calcium (Ca), and high Ca with HCTZ group in experiment 2. To quantitate the expression of TRPV5, cal- bindin-D28K, and sodium transporters, western blotting was performed. In both experi- ments, HCTZ significantly decreased urinary calcium excretion. TRPV5 protein abun- dance decreased in all hypercalciuric rats, and restored by HCTZ in both high salt with HCTZ and high Ca with HCTZ group. Calbindin-D28Kprotein abundance increased in the high salt and high salt with HCTZ groups, but did not differ among groups in experiment 2. Protein abundance of NHE3 and NKCC2 decreased in all hypercal- ciuric rats, and were restored by HCTZ in only high Ca-induced hypercalciuric rats.
In summary, protein abundance of TRPV5, NHE3, and NKCC2 decreased in all hyper- calciuric rats. The hypocalciuric effect of HCTZ is associated with increased protein abundance of TRPV5 in high salt or calcium diet-induced hypercalciuric rats.
Key Words : Hypercalciuria; Thiazides; Transporters
Received : 29 April 2008 Accepted : 28 November 2008
monstrated that thiazides increase bone mineral density and consequently reduce the risk of fracture (12-14), the mecha- nism of the hypocalciuric effect of thiazides and its effects on calcium transporters in the distal convoluted tubule are still controversial.
The purpose of this study was to elucidate mechanisms of the hypocalciuric effect of thiazides in high salt diet or high calcium diet-induced hypercalciuric rats. We analyzed the expression of TRPV5, calbindin-D28K, and sodium transporters of the PT and TAL in hypercalciuric rats and the changes of them after hydrochlorothiazide (HCTZ) administration.
MATERIALS AND METHODS
Experimental protocols and measurement of physiologic variables
Forty specific pathogen-free male Sprague-Dawley rats (6 weeks, 160-180 g; SLC, Shizuoka, Japan) were placed in sep- arate metabolic cages 3 days before the beginning of the study.
All rats were provided with fixed amount of finely ground regular rat chow (14.7 g/200 g of body weight per day) con- taining 0.3% (0.05 mM/g) NaCl and 1.3% (0.16 mM/g) CaCO3. The rats were allowed free access to drinking water containing 0.8% NaCl and 0.1% KCl. All studies were appr- oved by the institutional board for animal research (IACUC).
Experiment 1
Twenty rats were randomly allocated to the control (N1) group (NaCl 0.05 mM/g of chow, n=5), the HCTZ (T1) group (NaCl 0.05 mM/g of chow & HCTZ 7 mg/day, n=5), the high salt (S) group (NaCl 1.32 mM/g of chow, n=5), and the high salt with HCTZ (ST) group (NaCl 1.32 mM/g of chow &
HCTZ 7 mg/day, n=5). Rats in the S and ST groups were provided with rat chow containing 8% (1.32 mM/g) NaCl (Sigma, St. Louis, MO, U.S.A.) of chow (14.7 g/200 g of body weight per day). Rats in the N1 and T1 groups were given the same amount of regular rat chow. Osmotic minipumps (model 2ML1, Alzet, Palo Alto, CA, U.S.A.) were implant- ed subcutaneously in the T1 and ST groups to deliver 7 mg/
day HCTZ for 7 days. HCTZ was dissolved in 1.7% ethan- olamine. And the osmotic minipumps containing vehicle only were implanted in the N1 and S groups. On day 7, all rats were sacrificed after bilateral nephrectomy and blood sampling under anesthesia using ethyl carbamate (33 g in 100 mL PBS, 0.5 cc/200 g body weight, intraperitoneal injection).
Experiment 2
Twenty rats were randomly allocated to the control (N2) group (CaCO30.16 mM/g of chow, n=5), the HCTZ (T2) group (CaCO30.16 mM/g of chow & HCTZ 7 mg/day, n=
5), the high Ca (calcium diet; C) group (CaCO30.74 mM/g of chow, n=5), and the high Ca with HCTZ (CT) group (Ca
CO30.74 mM/g of chow & HCTZ 7 mg/day, n=5). Rats in the C and CT groups were provided with rat chow contain- ing 5% (0.74 mM/g) CaCO3(Sigma) of chow (14.7 g/200 g of body weight per day). Rats in the N2 and T2 groups were given the same amount of regular rat chow. Osmotic minipumps (model 2ML1, Alzet) were implanted subcutaneously in the T2 and CT groups to deliver 7 mg/day HCTZ for 7 days. And the osmotic minipumps containing only vehicle were implant- ed in the N2 and C groups. On day 7, all rats were sacrificed after bilateral nephrectomy and blood sampling under anes- thesia using ethyl carbamate.
In both experiments, body weight, water intake, and urine volume were measured daily. Urinary calcium was measured using Automated Electrolyte Analyzer EA07S (A&T, Yoko- hama-shi, Knagawa, Japan) and urinary creatinine was mea- sured using Automatic Anaylzer 7170 (HITACHI, Ibaraki, Japan) in the first and last 24-hr urine. Calcium excretion was expressed as the calcium to creatinine ratio. Also, serum sodi- um and calcium levels were measured using Toshiba 200FR- 1 (Toshiba, Tokyo, Japan) and hematocrit levels were measured using Automated Hematology Analyzer XE-2100 (Sysmex, Kobe, Japan).
Semiquantitative immunoblotting
The kidneys were dissected into small pieces and placed in a chilled isolation buffer containing 0.3 M sucrose, 10 mM triethanolamine (Sigma), 1 μg/mL leupeptin (Sigma), and 0.1 mg/mL phenylmethylsulfonylfluoride (Sigma) titrated to pH 7.6. Then the pieces were homogenized at 15,000 rpm with three stokes for 15 sec with a tissue homogenizer (Power Gun 125, Fisher Scientific, Pittsburgh, PA, U.S.A.). After homogenization, total protein concentration of the homogenate was measured by Bicinchoninic acid protein assay method (BCA Reagent Kit; Sigma) and diluted to 2.50 μg/mL using the isolation buffer solution. The samples were then stabi- lized by heating to 60℃for 15 min after adding 1 vol 5×
Laemmli sample buffer/4 vol sample.
Initially, “loading gels” were done on each sample set to calculate the exact loading amount that would guarantee equal loading on subsequent immunoblots. Ten micrograms of pro- tein from each sample were loaded into each individual lane and electrophoresed on 12% polyacrylamide-SDS minigels by using Mini-PROTEIN III electrophoresis apparatus (Bio- Rad, Hercules, CA, U.S.A.) and then were stained with Co- omassie blue dye (0.025% solution made in 4.5% methanol and 1% acetic acid; G-250, Bio-Rad). Selected bands from these gels were scanned with image analyzer (Vilber Lourmat, Marne la Vallee, France) to semiquantitatively determine densi- ty with LabWorks version 4.5 software (Ultra-Violet Products, Cambridge, U.K.) and relative amounts of protein loaded in each lane. Protein concentrations were corrected to reflect these measurements by repeating the process as described above.
For semiquantitative immunoblotting, the proteins elec-
′
trophoresed on gels were transferred from unstained gels to nitrocellulose membrane (Bio-Rad) using the electroelution method. After being blocked with 5% skim milk in PBS-T (80 mM Na2HPO4, 20 mM NaH2PO4, 100 mM NaCl, and 0.1% Tween-20, pH 7.5) for 30 min, membranes were probed overnight at 4℃with the respective primary antibodies. Affin- ity-purified immunoglobulin against TRPV5 (CHEMICON International, Temecula, CA, U.S.A.) and affinity-purified polyclonal antibodies for calbindin-D28K (ALPHA DIAG- NOSTIC International, San Antonio, CA, U.S.A.) were used.
The affinity-purified polyclonal antibodies against sodium- potassium-chloride cotransporter type 2 (NKCC2) and NCC were provided by Dr. HM Kwon (University of Maryland, Baltimore, MD, U.S.A.), and the antibodies against sodium- hydrogen exchanger 3 (NHE3) were provided by Dr. MA Knepper (NIH, Bethesda, MD, U.S.A.). Affinity-purified polyclonal antibodies against sodium-glucose cotransporter 1 (SGLT1) (CHEMICON International) were also used. For probing blots, all primary antibodies were diluted into a solu- tion containing 150 mM NaCl, 50 mM sodium phosphate, 10 mg/dL sodium azide, 50 mg/dL Tween 20, and 0.1 g/dL bovine serum albumin (pH 7.5). Then, the membranes were cleaned with PBS-T and probed with secondary antibodies for 1 hr at room temperature. The secondary antibody was horseradish peroxidase-conjugated donkey anti-rabbit IgG (31458; Pierce, Rockford, IL) diluted to 1:3,000 except for calbindin-D28K. The secondary antibody for calbindin-D28K was horseradish peroxidase-conjugated rabbit anti-mouse IgG (31452; Pierce, Rockford, IL, U.S.A.) diluted to 1:5,000.
Antibody-antigen reaction sites were viewed with enhanced chemiluminescence system (ECLTM RPN 2106; Amersham Pharmacia Biotech, Buckinghamshire, U.K.) before expos- ing to radiography films (Hyperfilm, Amersham Pharmacia Biotech, Little Chalfont, U.K.). Band density was measured by densitometry with Lab Works version 4.5 software (Ultra- Violet Products, Cambridge, U.K.) and calculated as a value relative to the average value of the control group.
Statistical analysis
All values are expressed as mean±standard deviation (SD).
Band density values were normalized by dividing them with
the average value of the control group. Thus the mean for the control group was defined as 100%. Group means of physi- ologic data were compared with ANOVA followed by New- man-Keuls post hoc analysis using GraphPad Prism version 4 (GraphPad Software, San Diego, CA, U.S.A.). Group means of protein abundance obtained from immunoblotting were compared with Mann-Whitney test using SPSS 12.0K. A p- value <0.05 was considered statistically significant.
RESULTS
Hypercalciuria induced by high salt diet Urinary excretion of calcium
There was no significant difference in body weight, hema- tocrit, and serum sodium concentration among groups (Table 1).
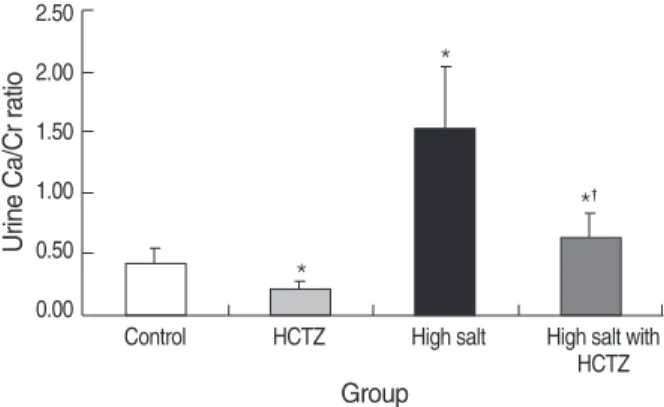
Urine Ca/Cr on day 0 was not significantly different among groups. On day 7, urine Ca/Cr was significantly increased in the high salt group, and decreased in the high salt with HCTZ group when compared to the high salt group (control vs. HCTZ vs. high salt vs. high salt with HCTZ, 0.39±0.15 vs. 0.19
±0.07 vs. 1.52±0.51 vs. 0.62±0.19; p<0.05). Urine Ca/
Cr in the high salt with HCTZ group was 41% of the level
N1 (Control) T1 (HCTZ) S (High salt) ST (High salt with HCTZ)
Body weight gain (g) 35.00±6.78 37.00±3.70 41.60±5.13 37.80±4.32
Urine volume (mL) 10.35±3.92 21.52±3.48* 93.22±20.46* 95.95±13.88*
Serum Ca (mg/dL) 9.40±1.01 9.50±2.49 8.68±1.09 9.34±1.15
Serum Na (mM/L) 141.75±0.96 142.00±3.16 138.25±4.03 136.50±3.11
Hematocrit (%) 49.47±3.00 50.60±6.23 49.90±5.62 43.30±4.95
Values are means±SD (standard deviation).
*p<0.05 when compared to the control group.
Table 1. Body weight gain, urine volume, hematocrit, and serum sodium concentration in high salt diet-induced hypercalciuric rats (n=
5 in each group)
Fig. 1. Urine Ca/Cr ratio on day 7 in high salt diet-induced hyper- calciuric rats. Urine Ca/Cr was significantly increased in the high salt group, and decreased in the high salt with HCTZ group when compared to the high salt group.
*p<0.05 when compared to the control group; �p<0.05 when com- pared to the high salt group.
Urine Ca/Cr ratio
2.50 2.00 1.50 1.00 0.50 0.00
Control HCTZ High salt High salt with HCTZ Group
*
*
*�
in the high salt group (Fig. 1). Urine Ca/Cr is summarized in Table 2.
Protein abundance using semiquantitative immunoblotting
TRPV5 protein abundance was significantly increased in the HCTZ group, decreased in the high salt group, and restored in the high salt with HCTZ group when compared to the high salt group (band density [%]; control vs. HCTZ vs. high salt vs. high salt with HCTZ, 100±18.02 vs. 184.27±41.49 vs. 69.07±15.18 vs. 78.29±33.57; Fig. 2). Calbindin-D28K protein abundance was significantly increased in the high salt
and the high salt with HCTZ groups (band density [%]; con- trol vs. HCTZ vs. high salt vs. high salt with HCTZ, 100± 42.33 vs. 94.10±12.79 vs. 222.63±12.24 vs. 258.44± 92.26; Fig. 3). Protein abundance of NHE3, SGLT1, NKCC2, and NCC increased in the HCTZ group, but protein abun- dance of NHE3 and NKCC2 decreased in the high salt group (band density: control vs. HCTZ vs. high salt vs. high salt with HCTZ, NHE3 [%]; 100±31.83 vs. 126.59±21.68 vs. 5.36±1.13 vs. 1.33±0.69, SGLT1 [%]; 100±22.23 vs. 182.45±22.66 vs. 146.53±5.26 vs. 125.61±12.67, NKCC2 [%]; 100±11.14 vs. 139.48±8.60 vs. 61.15± 19.89 vs. 54.56±13.73, NCC [%]; 100±4.74 vs. 133.11
±17.22 vs. 98.61±9.40 vs. 66.60±14.15; Fig. 4).
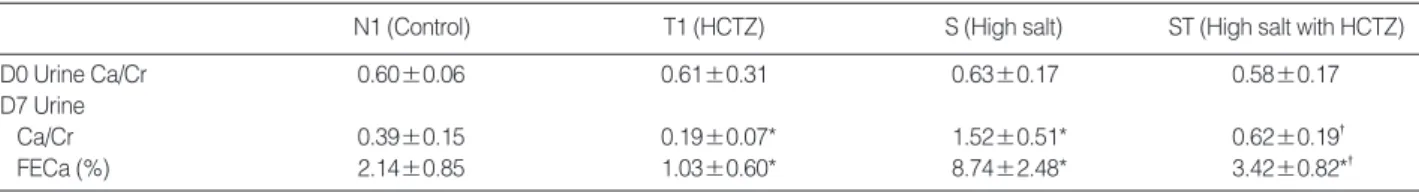
N1 (Control) T1 (HCTZ) S (High salt) ST (High salt with HCTZ)
D0 Urine Ca/Cr 0.60±0.06 0.61±0.31 0.63±0.17 0.58±0.17
D7 Urine
Ca/Cr 0.39±0.15 0.19±0.07* 1.52±0.51* 0.62±0.19�
FECa (%) 2.14±0.85 1.03±0.60* 8.74±2.48* 3.42±0.82*�
Values are means±SD (standard deviation).
*p<0.05 when compared to the control group; �p<0.05 when compared to the high salt group.
FECa, Fractional excretion of calcium.
Table 2. Urinary excretion of calcium in high salt diet-induced hypercalciuric rats Fig. 2. TRPV5 expression in high salt diet-induced hypercalciuric rats.
TRPV5 protein abundance was significantly increased in the HCTZ group, decreased in the high salt group, and increased in the high salt with HCTZ group when compared to the high salt group.
*p<0.05 when compared to the control group; �p<0.05 when com- pared to the high salt group.
(%)
250 200 150 100 50 0
Control HCTZ High salt High salt with HCTZ Control HCTZ High salt High salt with HCTZ 105 kDa
75 kDa
*
*
�
Fig. 3. Calbindin-D28Kexpression in high salt diet-induced hypercalci- uric rats. Calbindin-D28Kprotein abundance was significantly increased in both high salt and high salt with HCTZ groups.
*p<0.05 when compared to the control group.
(%)
400 350 300 250 200 150 100 50 0
Control HCTZ High salt High salt with HCTZ Control HCTZ High salt High salt with HCTZ 30 kDa
25 kDa
*
*
N2 (Control) T2 (HCTZ) C (High Ca) CT (High Ca with HCTZ)
Body weight gain (g) 28.00±6.88 28.15±4.34 29.20±5.63 24.20±2.59
Urine volume (mL) 11.35±3.83 22.72±3.49* 9.97±1.95 22.38±2.84*
Serum Ca (mg/dL) 9.43±1.08 9.55±2.43 10.85±0.92 9.48±1.63
Serum Na (mM/L) 141.65±1.46 142.00±3.23 138.50±1.73 142.70±4.35
Hematocrit (%) 50.40±3.00 50.60±4.53 53.80±4.56 50.07±1.60
Values are mean±SD (standard deviation).
*p<0.05 when compared to the control group.
Table 3. Body weight gain, urine volume, hematocrit, and serum sodium concentration in high calcium diet-induced hypercalciuric rats (n=5 in each group)
Hypercalciuria induced by high calcium diet Urinary excretion of calcium
Changes in body weight, hematocrit, and serum sodium con- centration did not differ significantly among groups (Table 3).
Urine Ca/Cr on day 0 was not significantly different among groups. On day 7, urine Ca/Cr was significantly increased in the high Ca group (Fig. 5). In the high Ca with HCTZ group,
urine Ca/Cr was decreased to about 47% levels of high Ca group (control vs. HCTZ vs. high Ca vs. high Ca with HCTZ, 0.40±0.16 vs. 0.19±0.08 vs. 2.49±0.51 vs. 1.17±0.05;
p<0.05). Urine Ca/Cr is summarized in Table 4.
Protein abundance using semiquantitative immunoblotting
Immunoblotting for TRPV5 revealed significantly decreased band density in the high Ca group and restored band densi-
Fig. 4. Protein abundance of sodium transporters in high salt diet-induced hypercalciuric rats. Protein abundance of NHE3 and NKCC2 was increased in the HCTZ group, but decreased in the high salt group. NCC protein abundance increased in the HCTZ group, but was not changed in the high salt group. SGLT1 protein abundance increased in both HCTZ group and high salt group.
*p<0.05 when compared to the control group.
A
(%)
160 140 120 100 80 60 40 20 0
Control HCTZ High salt High salt with HCTZ
NHE3 SGLT1
Control HCTZ High salt High salt with HCTZ 105 kDa
75 kDa
*
* *
B
(%)
250.00 200.00 150.00 100.00 50.00
0.00 Control HCTZ High salt High salt with HCTZ Control HCTZ High salt High salt with HCTZ 75 kDa
*
*
C
(%)
160 140 120 100 80 60 40 20 0
Control HCTZ High salt High salt with HCTZ Control HCTZ High salt High salt with HCTZ 250 kDa
160 kDa
*
* *
D
(%)
160 140 120 100 80 60 40 20 0
Control HCTZ High salt High salt with HCTZ
*
*
Control HCTZ High salt High salt with HCTZ 250 kDa
160 kDa
NKCC2 NCC
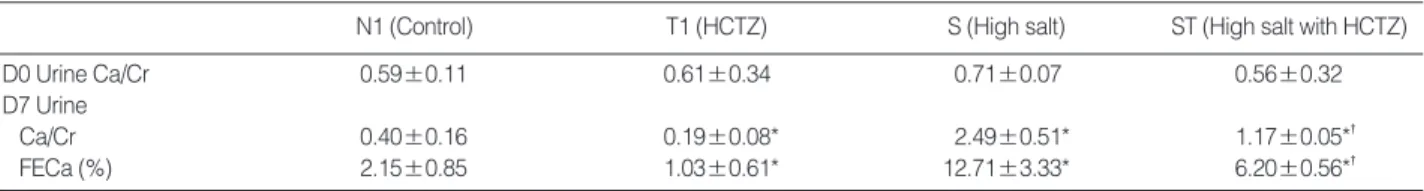
N1 (Control) T1 (HCTZ) S (High salt) ST (High salt with HCTZ)
D0 Urine Ca/Cr 0.59±0.11 0.61±0.34 0.71±0.07 0.56±0.32
D7 Urine
Ca/Cr 0.40±0.16 0.19±0.08* 2.49±0.51* 1.17±0.05*�
FECa (%) 2.15±0.85 1.03±0.61* 12.71±3.33* 6.20±0.56*�
Values are means±SD (standard deviation).
*p<0.05 when compared to the control group; �p<0.05 when compared to the high salt group.
FECa, Fractional excretion of calcium.
Table 4. Urinary excretion of calcium in high calcium diet-induced hypercalciuric rats
ty in the high Ca with HCTZ group (band density [%]; con- trol vs. HCTZ vs. high Ca vs. high Ca with HCTZ, 100± 18.92 vs. 168.04±29.83 vs. 60.06±9.31 vs. 123.77±23.90;
Fig. 6). Protein abundance of calbindin-D28Kdid not differ significantly among groups (band density [%]; control vs.
HCTZ vs. high Ca vs. high Ca with HCTZ, 100±22.18 vs. 102.68±11.42 vs. 101.66±24.24 vs. 94.54±29.38;
Fig. 7). Protein abundance of NHE3, SGLT1, and NKCC2 was significantly decreased in the high Ca group and restored in the high Ca with HCTZ group (band density: control vs.
HCTZ vs. high Ca vs. high Ca with HCTZ, NHE3 [%]; 100
±11.91 vs. 116.20±11.11 vs. 8.63±4.26 vs. 45.77± 26.29, SGLT1 [%]; 100±45.47 vs. 240.07±11.08 vs. 51.73
±8.05 vs. 95.60±25.47, NKCC2 [%]; 100±8.66 vs. 123.08
±1.56 vs. 66.05±4.72 vs. 80.16±17.66, NCC [%]; 100
±26.18 vs. 161.07±30.44 vs. 62.49±28.93 vs. 67.14± 9.93; Fig. 8).
DISCUSSION
To reveal the mechanisms of hypocalciuric effect of thiazide, we analyzed and compared changes of TRPV5 and major sodium transporters before and after HCTZ administration in both normal and hypercalciuric conditions induced by diet intervention. Regarding hypocalciuric effect of thiazide, there has been no report examining both major calcium and sodi- um transporters.
Protein abundance of TRPV5, NHE3, and NKCC2 was significantly decreased in all hypercalciuric rats. Our results imply that hypercalciuria may be caused by dysregulation of several stages of calcium transportation in the kidneys (15).
Approximately 70% of calcium reabsorption occurs in the proximal tubule, predominantly through paracellular path- ways with salt and water carrying calcium from the lumen to the interstitium by solvent drag. Approximately 20% of filtered calcium is reabsorbed in the TAL of the loop of Henle via both paracellular and transcellular processes. In the TAL, the driving force for paracellular transport of calcium is pro- vided by a lumen-positive voltage generated by the NKCC2.
The remaining approximately 10% of filtered calcium is reab- sorbed in the distal convoluted tubule and connecting tubule;
reabsorption in these segments is predominantly mediated by active transcellular transport under hormonal regulation (3, 16-18).
TRPV5 is confined to the apical domain of the epithelial cells lining the distal part of the distal convoluted tubule and the connecting tubule (5, 19). Other proteins involved in cal- cium transport such as calbindin-D28K, Na+-Ca2+exchanger type 1, and plasma membrane Ca2+-ATPase 1b are also locat- ed in these segments, but they are distributed in the cytoplasm or on the basolateral membrane (5). Although TRPV6 is also expressed in these segments, it is concentrated in the small
Fig. 5. Urine Ca/Cr ratio on day 7 in high calcium diet-induced hyper- calciuric rats. Urine Ca/Cr was significantly increased in the high Ca group. In the high Ca with HCTZ group, urine Ca/Cr was decreased to about 47% of the high Ca group.
*p<0.05 when compared to the control group; �p<0.05 when com- pared to the high Ca group.
Urine Ca/Cr ratio
3.50 3.00 2.50 2.00 1.50 1.00 0.50 0.00
Control HCTZ High Ca High Ca with
HCTZ Group
*
*
*�
Fig. 6. TRPV5 expression in high calcium diet-induced hypercal- ciuric rats. TRPV5 protein abundance was significantly decreased in the high Ca group, but restored in the high Ca with HCTZ group.
*p<0.05 when compared to the control group; �p<0.05 when com- pared to the high Ca group.
(%)
250 200 150 100 50 0
Control HCTZ High Ca High Ca with
HCTZ
Control HCTZ High Ca High Ca with HCTZ
105 kDa 75 kDa
*
*
�
Fig. 7. Calbindin-D28Kexpression in high calcium diet-induced hypercalciuric rats. Protein abundance of calbindin-D28Kwas not different among groups.
(%)
140 120 100 80 60 40 20 0
Control HCTZ High Ca High Ca with
HCTZ Control HCTZ High Ca High Ca with HCTZ 30 kDa
25 kDa
intestine and the affinity to calcium is 1/100 of that of TRPV5 (4). Therefore, TRPV5 can be expected to have a major role in active calcium reabsorption in the distal convoluted tubule.
Our results coincide with the basic phenomena mentioned above showing significant decrease of TRPV5, NHE3, and NKCC2 protein abundance in all hypercalciuric rats. Although protein abundance of NHE3 and NKCC2 was decreased in all hypercalciuric rats regardless of experimental protocols, there seemed to be different underlying mechanisms. In experi- ment 1, abundance of sodium and chloride may have result- ed in significant decrease of NHE3 and NKCC2. On the other hand, in experiment 2, abundant carbon dioxide released from CaCO3may have induced alkalemic condition, and consequent- ly facilitated bicarbonate excretion by down-regulation of NHE3 and NKCC2 because the normovolemic condition was maintained by providing electrolyte solution. It is already well known that bicarbonate excretion will rise only if the stimulus to sodium and chloride retention is removed by the
restoration of normovolemia, and acid-base balance has influ- ence on NHE3 and NKCC2 (2). However, some reported contradictory results about the changes of NHE3 in dietary NaCl intake and of NKCC2 in saline loading (20, 21). Dis- crepancy between our data and their results seemed to be caus- ed from different experiment protocols, specifically, NaCl amount. In our experiment 1, we loaded much more salt than previous studies.
Changes of calbindin-D28Kprotein abundance differed sig- nificantly depending on the protocols used to induce hyper- calciuria. Calbindin-D28Kprotein abundance did not change in high calcium diet-induced hypercalciuric rats, but signif- icantly increased in high salt diet-induced hypercalciuric rats suggesting that transporters on the luminal side may play a more substantial role in the regulation of calcium excretion and calbindin-D28Kmay not be a critical determining factor of hypercalciuria. One previous report using calbindin-D28K knockout mice also demonstrated that calbindin-D28Kdid not
Fig. 8. Protein abundance of sodium transporters in high calcium diet-induced hypercalciuric rats. Protein abundance of NHE3, SGLT1, NKCC2, and NCC was decreased in the high Ca group. Protein abundance of NHE3, SGLT1, and NKCC2 was increased by HCTZ in the high Ca with HCTZ group when compared to the high Ca group.
*p<0.05 when compared to the control group; �p<0.05 when compared to the high Ca group.
A
(%)
140 120 100 80 60 40 20 0
Control HCTZ High Ca High Ca with
HCTZ NHE3
Control HCTZ High Ca High Ca with HCTZ
105 kDa 75 kDa
*
*
*
B
(%)
300 250 200 150 100 50 0
Control HCTZ High Ca High Ca with
HCTZ SGLT1
Control HCTZ High Ca High Ca with HCTZ
75 kDa
*
*
�
C
(%)
140 120 100 80 60 40 20
0 Control HCTZ High Ca High Ca with
HCTZ
Control HCTZ High Ca High Ca with HCTZ
105 kDa 75 kDa
*
*
�
D
(%)
Control HCTZ High Ca High Ca with
HCTZ
*
* *
Control HCTZ High Ca High Ca with HCTZ
250 kDa 160 kDa
NKCC2 NCC
250 200 150 100 50 0
play an important role in the development of hypercalciuria (22). In that study, calbindin-D28Kknockout mice did not show hypercalciuria, whereas TRPV5 knockout mice and TRPV5/
calbindin-D28Kdouble knockout mice showed similar degrees of hypercalciuria. Our results also imply that major transporters participating in both active and passive calcium reabsorption are associated with the development of hypercalciuria. Fur- ther studies are needed to elucidate the functional correlation between TRPV5 and calbindin-D28Kafter HCTZ treatment in hypercalciuria.
Although the degree of hypercalciuria induced by high salt diet was less severe than that by high calcium diet, high salt diet itself caused significant hypercalciuria. The clinically harm- ful effect of high salt diet on urinary calcium excretion was already proposed in the 1960’s (23, 24). Borghi et al. (25) reported that animal protein and salt increased calcium excretion. Our results support the previous clinical observa- tion providing a possible physiologic explanation.
In the HCTZ group, protein abundance of NHE3, SGLT1, NKCC2, and NCC was increased. Upregulation of NCC pro- tein abundance after chronic HCTZ treatment was previous- ly reported (26). Protein abundance of TRPV5 was signifi- cantly increased in the HCTZ group. Changes in protein abundance of TRPV5 and major sodium transporters of the PT and TAL coincide with the hypocalciuric effect of HCTZ, and imply that both TRPV5 and sodium transporters col- laborate reducing calcium excretion in rats fed with normal diet after HCTZ administration.
HCTZ resulted in significant reduction of urinary calcium excretion in all hypercalciuric rats, and the degree of hypocal- ciuric effect was similar regardless the protocols inducing hyper- calciuria; in the high salt with HCTZ group, urine Ca/Cr de- creased to about 41% of the high salt group; in the high Ca with HCTZ group, urine Ca/Cr decreased to about 47% of the high Ca group.
Several distinct hypotheses have been proposed concerning the hypocalciuric effect of HCTZ. Nijenhuis et al. reported that HCTZ-induced hypocalciuria is accompanied by a decrease in TRPV5, Na+-Ca2+exchanger, and calbindin-D28Kin rat kidneys and that extracellular volume contraction is a criti- cal determinant of HCTZ-induced hypocalciuria (27). Lee et al. proposed that HCTZ induces hypocalciuria through different mechanisms depending on volume status (28). Nijen- huis et al. suggested that enhanced passive calcium reabsorp- tion is more important for HCTZ-induced hypocalciuria than active calcium reabsorption (29). In this study, the rats were provided with drinking water containing 0.8% NaCl and 0.1% KCl to prevent volume depletion, and measured data such as weight gain, hematocrit, and serum sodium concen- tration showed no difference among groups, reflecting a com- parable volume status.
Protein abundance of TRPV5 was increased by HCTZ in all hypercalciuric rats fed with high salt or high calcium diet.
However, protein abundance of NHE3, SGLT1, and NKCC2
was increased by HCTZ in the high Ca with HCTZ group, but was not affected by HCTZ in the high salt with HCTZ group. Despite the different effect of HCTZ on NHE3, SGLT1, and NKCC2 in hypercalciuric rats, HCTZ showed a similar hypocalciuric effect in both experiments; about 50% reduction of calcium excretion by HCTZ. This suggests that TRPV5 has a more crucial function in the regulation of calcium excre- tion in hypercalciuric conditions. Our results are compatible with the previous report by Hoenderop et al. (30) demonstrat- ing the essential role of TRPV5 in calcium homeostasis using TRPV5-null mice, and the report by Gkika et al. (22) show- ing that the gatekeeper function of TRPV5 is the rate-limit- ing step in active calcium reabsorption using single- and dou- bleknockout mice lacking TRPV5 and calbindin-D28K.
In conclusion, decreased protein abundance of TRPV5, NHE3, and NKCC2 is associated with the development of hypercalciuria, and changes in protein abundance of TRPV5 may be related to the HCTZ-induced hypocalciuric effect in both normal and hypercalciuric conditions. Our data suggest that TRPV5 is a critical determinant of the hypocalciuric effect of chronic HCTZ treatment.
ACKNOWLEDGMENTS
We would like to thank Dr. HM Kwon and Dr. Mark A.
Knepper for providing the antibodies for this study. We also thank MK Park for technical assistance.
REFERENCES
1. Suki W. Calcium transport in the nephron. Am J Physiol (Lond) 1979;
237: F1-F6.
2. Rose, Post. Proximal tubule: renal physiology. Clinical physiology of acid-base and electrolyte disorders. New York: McGraw-Hill, 2001;
71-103.
3. Hoenderop JG, Nilius B, Bindels RJ. Molecular mechanism of active ca2+ reabsorption in the distal nephron. Annu Rev Physiol 2002; 64:
529-49.
4. Hoenderop JG, Nilius B, Bindels RJ. Epithelial calcium channels:
from identification to function and regulation. Pflugers Arch 2003;
446: 304-8.
5. Hoenderop JG, Hartog A, Stuiver M, Doucet A, Willems PH, Bindels RJ. Localization of the epithelial ca (2+) channel in rabbit kidney and intestine. J Am Soc Nephrol 2000; 11: 1171-8.
6. Bataille P, Fardellone P, Ghazali A, Cayrolle G, Hottelart C, Achard JM, Fournier A. Pathophysiology and treatment of idiopathic hyper- calciuria. Curr Opin Rheumatol 1998; 10: 373-88.
7. Lemann J Jr, Gray RW. Idiopathic hypercalciuria. J Urol 1989; 141:
715-8.
8. Albright F HP, Benedict PH, Forebes AP. Idiopathic hypercalciuria:
a preliminary report. Proc B Soc Med London (Biol) 1953; 46: 1077- 108.
9. Backman U, Danielson BG, Johansson G, Ljunghall S, Wikstrom B.
Incidence and clinical importance of renal tubular defects in recur- rent renal stone formers. Nephron 1980; 25: 96-101.
10. Martinez ME, Villa E, Vazquez Martul M, Sanchez-Cabezudo MJ, Sanchez JA, Villa JR. Influence of calcium intake on calcitriol levels in idiopathic hypercalciuria in children. Nephron 1993; 65: 36-9.
11. Costanzo LS, Weiner IM. On the hypocalciuric action of chlorothiazide.
J Clin Invest 1974; 54: 628-37.
12. Ray WA, Griffin MR, Downey W, Melton LJ 3rd. Long-term use of thiazide diuretics and risk of hip fracture. Lancet 1989; 1: 687-90.
13. LaCroix AZ, Wienpahl J, White LR, Wallace RB, Scherr PA, George LK, Cornoni-Huntley J, Ostfeld AM. Thiazide diuretic agents and the incidence of hip fracture. N Engl J Med 1990; 322: 286-90.
14. Reid IR, Ames RW, Orr-Walker BJ, Clearwater JM, Horne AM, Evans MC, Murray MA, McNeil AR, Gamble GD. Hydrochlorothiazide reduces loss of cortical bone in normal postmenopausal women: a randomized controlled trial. Am J Med 2000; 109: 362-70.
15. Frick KK, Bushinsky DA. Molecular mechanisms of primary hyper- calciuria. J Am Soc Nephrol 2003; 14: 1082-95.
16. Bushinsky. Disorders of calcium and phosphorus homeostasis. In:
Greenberg Primer on kidney diseases. San Diego: academic Press, 2001; 107-15.
17. Scheinman SJ, Guay-Woodford LM, Thakker RV, Warnock DG.
Genetic disorders of renal electrolyte transport. N Engl J Med 1999;
340: 1177-87.
18. Reilly RF, Ellison DH. Mammalian distal tubule: physiology, patho- physiology, and molecular anatomy. Physiol Rev 2000; 80: 277-313.
19. Loffing J, Loffing-Cueni D, Valderrabano V, Klausli L, Hebert SC, Rossier BC, Hoenderop JG, Bindels RJ, Kaissling B. Distribution of transcellular calcium and sodium transport pathways along mouse distal nephron. Am J Physiol Renal Physiol 2001; 281: F1021-7.
20. Eladari D, Leviel F, Pezy F, Paillard M, Chambrey R. Rat proximal nhe3 adapts to chronic acid-base disorders but not to chronic changes in dietary nacl intake. Am J Physiol Renal Physiol 2002; 282: F835- 43.
21. Ecelbarger CA, Terris J, Hoyer JR, Nielsen S, Wade JB, Knepper MA. Localization and regulation of the rat renal na(+)-k(+)-2cl- cotransporter, bsc-1. Am J Physiol 1996; 271: F619-28.
22. Gkika D, Hsu YJ, van der Kemp AW, Christakos S, Bindels RJ, Hoen- derop JG. Critical role of the epithelial ca2+ channel trpv5 in active ca2+ reabsorption as revealed by trpv5/calbindin-d28k knockout mice.
J Am Soc Nephrol 2006; 17: 3020-7.
23. Kleeman CR, Bohannan J, Bernstein D, Ling S, Maxwell MH. Effect of variations in sodium intake on calcium excretion in normal humans.
Proc Soc Exp Biol Med 1964; 115: 29-32.
24. Phillips MJ, Cooke JN. Relation between urinary calcium and sodium in patients with idiopathic hypercalciuria. Lancet 1967; 1: 1354-7.
25. Borghi L, Schianchi T, Meschi T, Guerra A, Allegri F, Maggiore U, Novarini A. Comparison of two diets for the prevention of recurrent stones in idiopathic hypercalciuria. N Engl J Med 2002; 346: 77-84.
26. Na KY, Oh YK, Han JS, Joo KW, Lee JS, Earm JH, Knepper MA, Kim GH. Upregulation of na+ transporter abundances in response to chronic thiazide or loop diuretic treatment in rats. Am J Physiol Renal Physiol 2003; 284: F133-43.
27. Nijenhuis T, Hoenderop JG, Loffing J, van der Kemp AW, van Os CH, Bindels RJ. Thiazide-induced hypocalciuria is accompanied by a decreased expression of ca2+ transport proteins in kidney. Kidney Int 2003; 64: 555-64.
28. Lee CT, Shang S, Lai LW, Yong KC, Lien YH. Effect of thiazide on renal gene expression of apical calcium channels and calbindins. Am J Physiol Renal Physiol 2004; 287: F1164-70.
29. Nijenhuis T, Vallon V, van der Kemp AW, Loffing J, Hoenderop JG, Bindels RJ. Enhanced passive ca2+ reabsorption and reduced mg2+
channel abundance explains thiazide-induced hypocalciuria and hypo- magnesemia. J Clin Invest 2005; 115: 1651-8.
30. Hoenderop JG, van Leeuwen JP, van der Eerden BC, Kersten FF, van der Kemp AW, Merillat AM, Waarsing JH, Rossier BC, Vallon V, Hummler E, Bindels RJ. Renal ca2+ wasting, hyperabsorption, and reduced bone thickness in mice lacking trpv5. J Clin Invest 2003; 112:
1906-14.
![Fig. 6). Protein abundance of calbindin-D 28K did not differ significantly among groups (band density [ % ] ; control vs.](https://thumb-ap.123doks.com/thumbv2/123dokinfo/5133187.90376/6.892.91.423.123.333/protein-abundance-calbindin-differ-significantly-groups-density-control.webp)

