INTRODUCTION
Atherosclerotic plaque progression may lead to coronary artery disease (1), stroke (2), peripheral artery disease (3), and sudden cardiac death (SCD) (4) in humans. However, the me- chanism of plaque growth, destabilization, and rupture has not been fully established.
Atherosclerotic plaque assessment has been conducted in the past using histopathology in autopsy specimens (5, 6).
Recently, serum biomarker studies (7, 8) and imaging stud- ies such as computerized tomography (9), magnetic resonance imaging (10), intima-media thickness (11), coronary angiog- raphy (12), optical coherence tomography (13), intravascu- lar ultrasound (IVUS) (14, 15), and virtual histology IVUS (VH-IVUS) (16, 17) have been used to assess plaques. IVUS and VH-IVUS are the most commonly used tools in the eval- uation of vulnerable plaques.
Nogo-B (reticulon 4 B) has been recently discovered as a member of the reticulon family of proteins. The biological role of Nogo-B is not well understood. Some animal data sug- gest that Nogo-B is associated with the promotion of endo- thelial migration and the inhibition of vascular smooth mus-
cle cell migration, resulting in homeostasis and remodeling of vascular structures (18). However, there is limited human data, and the relationship between Nogo-B and the progres- sion of fibroatheromas (FA) or vulnerable plaques is not well understood. Thus, the purpose of this study was to evaluate the relationship between Nogo-B, and FA or plaque progres- sion in human coronary arteries using VH-IVUS.
MATERIALS AND METHODS Definition of fibroatheromas
Early FA was defined as a necrotic core (NC) area of <0.1 mm2and <10% in the presence of a plaque burden of >40%, and late FA was defined as a NC area of 0.1-1.0 mm2and
>10% of the NC area in the presence of a plaque burden of
>40% (19). Thin-cap FA (TCFA) was defined as a NC >10%
of the plaque area with a plaque burden of >40%, as well as NC in contact with the lumen for at least 3 consecutive image slices. Thick-cap FA (TkCFA) was defined as NC >10% of the plaque area with a plaque burden of >40%, as well as
596
Wang-Soo Lee1, Sang-Wook Kim1, Soon-Auck Hong2, Tae-Jin Lee2, Eon-Sub Park2, Hyoung-Joong Kim3, Kwang Je Lee1, Tae Ho Kim1,
Chee Jeong Kim1, and Wang Seong Ryu1
Departments of Internal Medicine1and Pathology2, College of Medicine, Chung-Ang University, Seoul;
National Institute of Scientific Investigation3, Seoul, Korea
Address for correspondence Wang-Soo Lee, M.D.
Department of Internal Medicine, Chung-Ang University Yongsan Hospital, 65-207 Hangangro 3-ga, Yongsan-gu, Seoul 140-757, Korea Tel : +82.2-748-9885, Fax : +82.2-790-2068 E-mail : wslee1227@dreamwiz.com DOI: 10.3346/jkms.2009.24.4.596
Atherosclerotic Progression Attenuates the Expression of Nogo-B in Autopsied Coronary Artery: Pathology and Virtual Histology
Intravascular Ultrasound Analysis
The relation of Nogo-B to atherosclerotic plaque progression is not well understood.
Thus, the purpose of this study was to assess the expression of Nogo-B in fibro- atheromas (FA) of different stages, classified using virtual histology intravascular ultrasound (VH-IVUS) analysis in 19 autopsied cases of non-sudden cardiac death.
VH-IVUS imaging analysis was performed 30 mm from the ostium of each coronary artery. VH-IVUS revealed 11 early FAs (34.5±8.3 yr), 12 late FAs (42.6±16.6 yr), 8 thick-cap FAs (TkCFAs) (46.4±11.1 yr), and 6 thin-cap FAs (TCFAs) (51.8±
6.8 yr). TkCFAs and TCFAs were defined as advanced FA. FA progression advan- ced with age (P=0.04). VH-IVUS analysis of small, early FAs showed smaller necrot- ic cores and relatively less calcium compared to more advanced FAs with large ne- crotic cores (P<0.001). Histopathology and immunohistochemical stains demon- strated that early or late FAs had smaller necrotic cores, less empty space of decal- cification, and greater Nogo-B expression compared to advanced FAs (vs. early FA, P=0.013; vs. late FA, P=0.008, respectively). These findings suggest that FA progression is inversely associated with Nogo-B expression. Local reduction of Nogo-B may contribute to plaque formation and/or instability.
Key Words : Atherosclerosis; Nogo Protein; Ultrasonography, Interventional; Autopsy
Received : 9 February 2009 Accepted : 24 June 2009
NC without contact with the lumen in the image slices (20).
TkCFA and TCFA were defined as advanced FA, in contrast to early FA or late FA.
Study subjects
Human coronary arteries were collected from 22 autop- sied samples at the National Institute of Scientific Investi- gation in Korea. Autopsies were performed within 8 hr after death, and the collected coronary arteries were immediately stored in phosphate-buffered saline at 4℃. Three cases of SCD were excluded from 22 autopsied samples because of a difficulty in collection of SCD samples. Of them 26 coro- nary arteries were also excluded because of failure to pass a guide wire for IVUS. The other reasons of exclusion were IVUS imaging artifact, inadequate pathology, and failure to meet criteria (including overlapping) for a definition of early or late FA. Ultimately, data were acquired from 31 coronary arteries, and 37 lesions were analyzed. This study was appro- ved by the institutional review board of the Chung-Ang Uni- versity Medical Center.
VH-IVUS
IVUS imaging was performed beginning from 50 mm dis- tal to the left main coronary artery and right coronary artery ostium in a bath of 0.9% saline at a temperature of 37℃. VH- IVUS examination was performed with a dedicated console (20 MHz, 2.9 F monorail, electronic Eagle Eye Gold IVUS catheter, Volcano Therapeutics, Rancho Cordova, CA, U.S.A.).
The automated pull-back system had a speed of 0.5 mm/sec.
The time between death and IVUS imaging did not exceed 48 hr. All VH-IVUS images were recorded on a DVD-ROM and later analyzed offline within 30 mm.
Histopathology
Tissue samples were fixed in 10% buffered-formalin and cut every 3 mm perpendicular to the long axis of the coro- nary artery. They were then dehydrated in 70% ethanol, em- bedded in paraffin, and cut at 3 μm thickness using a micro- tome. They were stained with hematoxylin-eosin (H-E) and Masson’s trichrome for fibrosis and von Kossa stain for calci- fication.
Immunohistochemistry
Embedded paraffin tissues were deparaffinized and rehy- drated using xylene and ethanol. The sections were treated with 0.5% H2O2for 20 min and washed with distilled water.
After the sections were deposited with 10 mM citrate (pH 6.0) to suppress nonspecific binding of the antibodies and cooled at room temperature to increase the exposure of anti- gens, they were treated with TBS (pH 7.2-7.4) and incubated
with normal goat serum at room temperature to suppress en- dogenous peroxidase activity. The sections were then reacted with primary antibodies, such as anti-CD68 and anti-CD31 (Lab Vision Corp., Fremont, CA, U.S.A.), anti-neurite out- growth inhibitor B (Nogo-B; Chemicon International Inc., Temecula, CA, U.S.A.), and anti-matrix metalloproteinase- 9 (MMP-9; Lab Vision Corp) at room temperature overnight and washed with TBS. Biotin-conjugated secondary anti- bodies (Zymed Laboratories Inc., South San Francisco, CA, U.S.A.) were used along with the primary antibodies for 1 hr, after which the sections were treated with streptavidin- peroxidase for 20 min. The sections were treated with AEC (3-amino-9-ethylcarbazole) chromogen and counterstained with Mayer’s hematoxylin, then assessed using light micro- scopy. Control tissues were treated with normal serum.
VH-IVUS and histopathologic data analysis
VH-IVUS analysis was conducted by two experienced car- diologists who were blinded to patient information. VH-IVUS used spectral analysis of IVUS radiofrequency data to con- struct tissue maps that correlated with a specific spectrum of the radiofrequency signal. The contour of both the lumen and the media-adventitia interface was identified using auto- matic edge detection and was manually corrected when nec- essary. VH-IVUS automatically classified the plaque into 4 major components: fibrous (labeled green color), fibro-fatty (labeled greenish-yellow color), necrotic core (labeled red color), and dense calcium (labeled white color). The ratio of each plaque component was expressed as a percentage of the total plaque volume and as an absolute area.
Histopathologic analysis was performed by two patholo- gists who were blinded to VH-IVUS information. SPOT Insight 4MP firewell color 3-shot (Diagnostic instruments Inc., Sterling Heights, MI, U.S.A.), SPOT software 4.6 and BX51 microscope (Olymphus, Tokyo, Japan) was used for computer-based morphometry. Each group was evaluated by the quantitative analysis as areas of calcium and necrotic core in plaques. The expression level of MMP-9 and CD68 were compared by the areas of the positive staining. Nogo- B activity was analyzed as percentage of positive areas in the total plaques. The numbers of CD31 positive microvessel, microvessel densities, in the fibroatheromas were counted on the medium power.
Statistical analysis
Quantitative data are presented as means±standard devia- tion (SD), and categorical data are expressed as frequencies.
Continuous variables were compared using the two-tailed unpaired t-test for normally distributed variables and the Mann-Whitney U-test for skewed distributed variables. AN- OVAR testing was used to compare data among more than three groups. Differences between categorical groups were
compared using the chi-square test. Simple correlations were examined using Pearson’s coefficient of correlation for con- tinuous variables. P values less than 0.05 (2-sided) were con- sidered statistically significant. Statistical analyses were con- ducted with SPSS software, version 11.5 (Statistical Package for the Social Science, SPSS Inc., Chicago, IL, U.S.A.).
RESULTS Study population
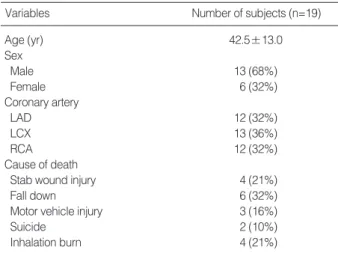
Demographic data and characteristics for the study popu- lation are presented in Table 1. The mean age of the subjects was 42.5±13.0 yr. Males made up 68% of the study popu- lation. The distribution of analytic sites was as follows: left anterior descending artery in 32% of subjects, left circumflex
artery in 36%, and right coronary artery in 32%. Non-car- diac causes of death included fall injury (32%), stab wound injury (21%), inhalation burn (21%), motor vehicle injury (16%), and suicide (10%).
Atherosclerotic lesions by VH-IVUS
Coronary FAs were classified into 4 groups: early FA (n=
11), late FA (n=12), TkCFA (n=8), and TCFA (n=6), by VH- IVUS (Fig. 1). There were significant differences in the mean age of FA progression (early FA 34.5±8.3 yr, late FA 42.6
±16.6 yr, TkCFA 46.4±11.1 yr, and TCFA 51.8±6.8 yr, respectively, P=0.04). However, the relationship between NC and the age was not significant (r=0.087, P=0.609).
VH-IVUS analysis demonstrated that early FAs with small- er necrotic core had also relatively less calcium (P<0.001) compared to more advanced FAs with larger necrotic cores (Table 2). Furthermore, the relative amounts of fibrotic and fibrofatty tissue decreased as the necrotic core increased (r=
0.755, P<0.001 and r=0.667, P<0.001, respectively, figure not shown), while the relative size of the dense calcium area increased as the size of the necrotic core increased (r=0.739, P<0.001, figure not shown). In comparison analysis between TkCFA and TCFA, mean age (P=0.310), plaque burden (P=
0.594), percent of fibrofatty component (P=0.531), and NC component (P=0.055) were not different, respectively. How- ever, percent of fibrous component was lower (P<0.001) and dense calcium was higher (P<0.001) in the TCFA rather than TkCFA. Thus, VH-IVUS analysis showed that dense calcium component might be associated with plaque progression in addition to larger necrotic cores.
Pathologic characteristics and immunohistochemical activity
H-E staining with VH-IVUS analysis showed that advan-
Values are n (%).
LAD, left anterior descending artery; LCX, left circumflex artery; RCA, right coronary artery.
Variables Number of subjects (n=19)
Age (yr) 42.5±13.0
Sex
Male 13 (68%)
Female 6 (32%)
Coronary artery
LAD 12 (32%)
LCX 13 (36%)
RCA 12 (32%)
Cause of death
Stab wound injury 4 (21%)
Fall down 6 (32%)
Motor vehicle injury 3 (16%)
Suicide 2 (10%)
Inhalation burn 4 (21%)
Table 1. Study population
F area 4.9 mm2 FF area 1.0 mm2 NC area 0.1 mm2 DC area 0.0 mm2
F area 6.0 mm2 FF area 1.5 mm2 NC area 0.4 mm2 DC area 0.2 mm2
F area 6.4 mm2 FF area 1.0 mm2 NC area 2.0 mm2 DC area 0.8 mm2
F area 2.5 mm2 FF area 0.3 mm2 NC area 2.3 mm2 DC area 0.7 mm2 Fig. 1. Classification of fibroatheromas by virtual histology intravascular ultrasound. Early fibroatheromas (A) had less extensively necrotic cores (red color) and greater fibrous (green color) composition, while thick-cap fibroatheromas (C) and thin-cap fibroatheromas (D) had larger necrotic cores and more extensive calcium (white color) deposition.
F, fibrous; FF, fibrofatty; NC, necrotic core; DC, dense calcium.
A B C D
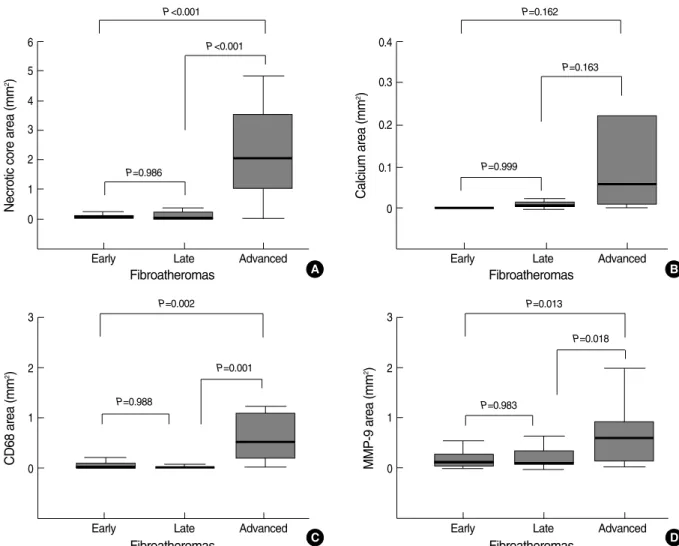
ced FAs had larger necrotic cores than early FAs (P<0.001) and late FAs (P<0.001) did (Fig. 2A, B, F, G; Fig. 3A).
Von Kossa staining revealed increased plaque calcifications and larger emptying spaces of decalcification in advanced FA (Fig. 2C, H), but quantitative analysis did not demonstrate a statistically significant difference (Fig. 3B).
Immunohistochemistry demonstrated that CD68-positive macrophage infiltration was more significant in advanced FA than it was in early FA (P=0.002) or late FA (P=0.001) (Fig. 2D, I; Fig. 3C). MMP-9 activity was also increased in advanced FA compared to early FA (P=0.013) and late FA (P=0.018) (Fig. 2E, J; Fig. 3D).
There were few CD31-positive microvessels in the plaques
in early FA and late FA, while there were more microvessels in the plaques in TkCFA and TCFA (figure not shown).
Pathology and VH-IVUS correlation
A correlation analysis between pathology and VH-IVUS was performed in 37 coronary lesions. The NC areas of early FA were 0.08±0.04 mm2 in VH-IVUS and 0.08±0.09 mm2in the pathology respectively. The NC areas of late FA were 0.35±0.17 mm2in VH-IVUS and 0.15±0.23 mm2 in the pathology, respectively (Table 3). The correlation of NC between VH-IVUS and pathology was r=0.71 (P=0.005) (Fig. 4). Thirty-four of 37 FAs (94%) were matched correct-
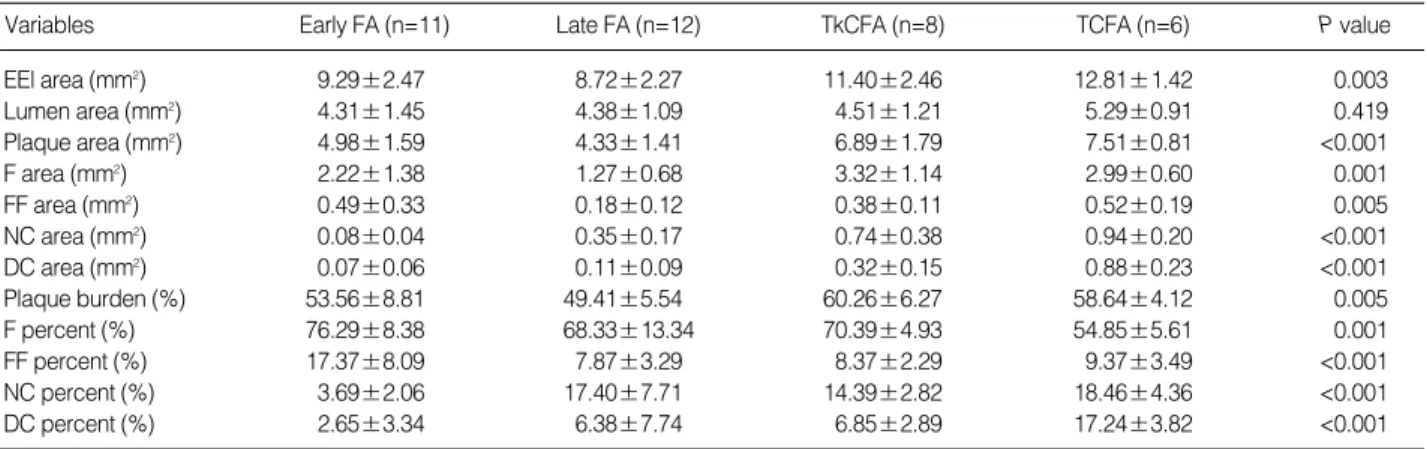
Values are means±SD. ANOVAR was used to compare data between groups. P values <0.05 were considered statistically significant.
FA, fibroatheroma; TkCFA, thick-cap fibroatheroma; TCFA, thin-cap fibroatheroma; EEL, external elastic lamina; F, fibrous; FF, fibro-fatty; NC, necrotic core; DC, dense calcium.
Variables Early FA (n=11) Late FA (n=12) TkCFA (n=8) TCFA (n=6) P value
EEl area (mm2) 9.29±2.47 8.72±2.27 11.40±2.46 12.81±1.42 0.003
Lumen area (mm2) 4.31±1.45 4.38±1.09 4.51±1.21 5.29±0.91 0.419
Plaque area (mm2) 4.98±1.59 4.33±1.41 6.89±1.79 7.51±0.81 <0.001
F area (mm2) 2.22±1.38 1.27±0.68 3.32±1.14 2.99±0.60 0.001
FF area (mm2) 0.49±0.33 0.18±0.12 0.38±0.11 0.52±0.19 0.005
NC area (mm2) 0.08±0.04 0.35±0.17 0.74±0.38 0.94±0.20 <0.001
DC area (mm2) 0.07±0.06 0.11±0.09 0.32±0.15 0.88±0.23 <0.001
Plaque burden (%) 53.56±8.81 49.41±5.54 60.26±6.27 58.64±4.12 0.005
F percent (%) 76.29±8.38 68.33±13.34 70.39±4.93 54.85±5.61 0.001
FF percent (%) 17.37±8.09 7.87±3.29 8.37±2.29 9.37±3.49 <0.001
NC percent (%) 3.69±2.06 17.40±7.71 14.39±2.82 18.46±4.36 <0.001
DC percent (%) 2.65±3.34 6.38±7.74 6.85±2.89 17.24±3.82 <0.001
Table 2. Gray scale IVUS and VH-IVUS parameters in fibroatheromas
Fig. 2. Comparative VH-IVUS and microscopic findings between early fibroatheromas (FA) or late FAs and advanced FAs. Early FAs (A, B) had smaller necrotic cores compared to advanced FAs (F, G) with larger lipid pools. Late FAs (C) had few calcium components, while advanced FAs (H) had a large amount of calcium and decalcified empty spaces (arrows). The expression of CD68-positive macrophages (arrows) was strong in advanced FA (I) rather than in late FA (D). MMP-9 activity (arrows) was also prominent in advanced FA (J) as opposed to late FA (E). (B and G, H&E staining at ×40 magnification; C and H, von Kossa staining at ×40 and ×100 magnification, respectively;
D and I, CD68 immunohistochemical staining at ×100 magnification; E and J, MMP-9 immunohistochemical staining at ×100 magnifica- tion).
A
F G H I J
B C D E
ly by pathology and VH-IVUS.
Expression of Nogo-B and correlation with plaque components
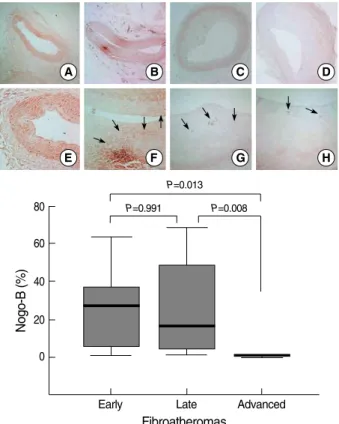
Immunohistochemical stainings for Nogo-B demonstrat- ed that early FA had a diffuse expression of Nogo-B (as much as the control). Nogo-B expression was weaker in late FA, but not significantly weaker compared to that in early FA (P=
0.991). The expression of Nogo-B in advanced FA was much weaker than that in early FA (P=0.013) or late FA (P=0.008).
The immunohistochemical staining patterns of Nogo-B in late or advanced FA were different from that in early FA.
Nogo-B was focally distributed in atherosclerotic plaques in late and advanced FA (Fig. 5).
Fig. 3. Quantitative graphs of necrotic cores, calcium, CD68-positive macrophages, and MMP-9 activity in various stages of FA.
Necrotic core area (mm2) 6 5 4 3 2 1 0
Early Late Advanced
Fibroatheromas
P<0.001
P<0.001
P=0.986
CD68 area (mm2) 3
2
1
0
Early Late Advanced
Fibroatheromas
P=0.002
P=0.001
P=0.988
MMP-9 area (mm2) 3
2
1
0
Early Late Advanced
Fibroatheromas
P=0.013
P=0.018
P=0.983
Calcium area (mm2) 0.4
0.3
0.2
0.1
0
Early Late Advanced
Fibroatheromas
P=0.162
P=0.163
P=0.999
A B
C D
Values are means±SD. ANOVAR was used to compare data between groups. P values <0.05 were considered statistically significant.
FA, fibroatheroma; VH-IVUS, virtual histology intravascular ultrasound.
Early FA Late FA Advanced FA P value VH-IVUS 0.08±0.04 0.35±0.17 0.80±0.33 <0.001 Pathology 0.08±0.09 0.15±0.23 2.19±1.57 <0.001 Table 3. Measurements of necrotic core areas (mm2) by VH-IVUS and pathology
VH-IVUS NC area (mm2) 1.0 0.8 0.6
0.4 0.2 0
0 0.2 0.4 0.6 0.8 1.0 1.2 1.4 1.6 Pathologic core area (mm2)
r=0.710 P=0.005
Fig. 4. The correlation of necrotic core area between VH-IVUS and pathology in human autopsied coronary arteries.
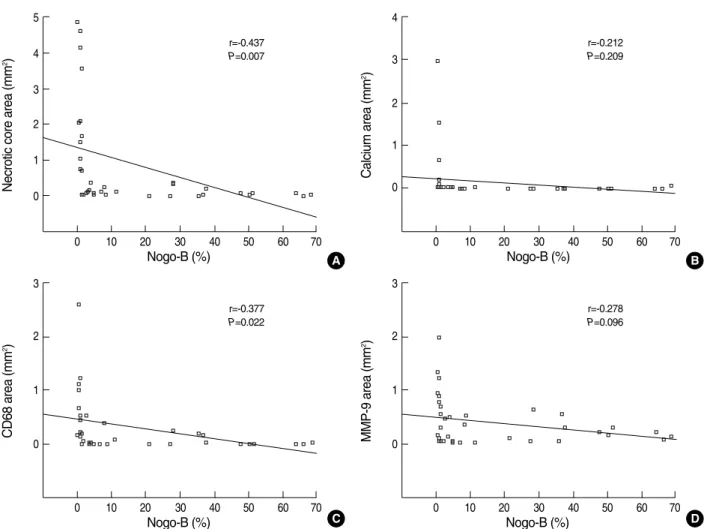
There was a significant inverse relationship between Nogo- B expression and both core necrosis area (r=-0.437, P=0.007) and plaque area (r=-0.398, P=0.015, figure not shown here).
However, the relationship between Nogo-B expression and the calcium component or age was not significant (r=-0.212, P=0.209; r=0.038, P=0.821, respectively). In terms of the inflammatory response of atherosclerosis, which not fully es- tablished yet, there was a significant inverse correlation bet- ween Nogo-B expression and CD68 activity (r=-0.377, P=
0.022), while not MMP-9 activity (r=-0.278, P=0.096) (Fig. 6).
DISCUSSION
The present study demonstrated the inverse relation bet- ween Nogo-B expression and FA progression in autopsied coronary arteries. This is the first human study assessing the correlation between Nogo-B and plaque composition ana- lyzed by VH-IVUS. Our data revealed decreased expression
of Nogo-B in advanced FA, including vulnerable TCFA pla- ques.
Nogo proteins are composed of three alternative splice forms:
1192-residue Nogo-A, 373-residue Nogo-B, and 199-residue Nogo-C. Despite their significantly different N-terminal lengths, they share a conserved C-terminal reticulon-homol- ogy domain consisting of two transmembrane fragments, a 66-residue extracellular loop (Nogo-66) and a 38-residue C- tail carrying an endoplasmic reticulum retention motif. Nogo- A has the largest N-terminus (1016 residues), while Nogo- B has an N-terminus almost identical to the first 200 residues of Nogo-A (18).
Rodriguez-Feo et al. (21) previously reported that Nogo-B levels in carotid plaques are inversely related with the pres- ence of large lipid pools. However, they classified roughly two groups based on a degree of carotid stenosis of 90% and a fat content of 40%. This is insufficient to analyze the relation between Nogo-B and plaque progression over time.
We classified atherosclerotic plaques into 4 groups using VH-IVUS. Early FA with NC area <0.1 mm2and late FA with NC area 0.1-1.0 mm2were defined in the present study based on a previous investigation by Virmani et al. (19). They performed morphometric plaque analysis and suggested four groups based on NC: pathologic intimal thickening without NC, early core FA with NC area 0.06±0.02 mm2, late core FA with NC area 0.84±0.08 mm2, and thin-cap atheroma.
TkCFA and TCFA are widely used VH-IVUS plaque clas- sifications since the pathologic confirmation based on these classifications is very high, as the predictive accuracy is appro- ximately 93.4% for fibrous, 94.6% for fibrofatty tissue, 95.1%
for NC, and 96.8% for dense calcium (22). However, vali- dation of VH-IVUS has a controversy yet. An animal study by Granada et al. demonstrated that the sensitivity of IVUS- VH for the detection of fibrous, fibrofatty, and necrotic core tissue was 76.1%, 46%, and 41.1% respectively (23). In the present study, the correlation of NC and coincidence of FA classification between VH-IVUS and pathology were 71%, and 94% respectively. The study for validation and accuracy of VH-IVUS will be needed more in future.
Atherosclerotic plaques are caused by abnormal cellular proliferation and migration, lipid deposition, and extracel- lular matrix accumulation (24). Rupture-prone, vulnerable TCFAs are associated with a high inflammatory component and a large necrotic core accompanied by elevated proteolyt- ic activity (1, 25).
VH-IVUS revealed that core necrosis and calcification were more significant in advanced FA compared to early FA and late FA. There have been many studies looking at the posi- tive correlation between coronary artery calcification and athe- rosclerosis progression or coronary artery disease (26-28). Pre- vious data have shown that the N-terminal regions of both Nogo-A and -B have a putative calcium binding site (18).
Therefore, we deduced that decreased expression of Nogo-B proteins could play a role in coronary artery calcification. How-
Fig. 5. Nogo-B expression with plaque growth. Early fibroathero- mas (FA) (B and F) showed diffuse Nogo-B expression (arrows) comparable to that seen in controls (A and E). Late FAs (C and G) had weaker, focal expression (arrows) of Nogo-B compared to early FAs. Advanced FA (D and H) demonstrated much weak- er focal Nogo-B activity (arrows) compared to that seen in early FA or late FA. I, quantitative graphs of Nogo-B expression in vari- ous FA stages. (Immunohistochemical staining for Nogo-B, A to D, ×40 magnification, E to H, ×100 magnification).
Nogo-B (%)
80
60
40
20
0
Early Late Advanced
Fibroatheromas
P=0.013 P=0.008 P=0.991
A
E
B
F
C
G
D
H
ever, our data showed that only three factors, such as plaque burden, core necrosis, and CD68 activity, were significantly negatively correlated with Nogo-B activity, while calcifica- tion, age, and fibrosis were not related with Nogo-B expres- sion. These findings imply that the principal pathology of plaque progression and instability is increased core necrosis and inflammation, rather than increased calcium deposition.
The role of calcium in atherosclerotic plaque progression is more complicated than we initially thought it to be.
We also found the expression pattern of Nogo-B to be in- teresting. Diffuse Nogo-B distribution was noted in early FA and in healthy arteries containing non-atherosclerotic plaques, while focal distribution was noted in diseased arteries con- taining atherosclerotic plaques, such as late FA and advanced FA. The mechanism of this differing distribution pattern is unclear, but some mechanisms have been proposed. One is endothelial shear stress (29). Pressure, but not cellular stretch, has been associated with Nogo-B up-regulation in nonvas- cular cells. Low endothelial shear stress is a powerful local sti- mulus for atherogenesis, as well as formation and progression of early atherosclerotic plaques and differentiation of high-
risk plaques. Thus, high Nogo-B expression presents in heal- thy arteries with continuous pulsatile and unidirectional endo- thelial shear stress. Disturbed laminar flow develops, and the pulsatile flow generates low and/or oscillatory endothelial shear stress, which induces low Nogo-B expression. Anoth- er possible mechanism is a complicated local inflammation, which not fully established yet (30). Nogo-B expression was significantly negatively correlated with CD68 activity, but not with MMP-9 activity in the present study. Despite the overall reduced Nogo-B levels in plaques, local accumulation of Nogo-B is noted in macrophage-rich areas. Nogo-B also seems to be concentrated in macrophages or foam cells. Hen- ce, new materials inhibiting local inflammation and prevent- ing Nogo-B reduction (e.g., through a Nogo-B eluting stent) might be helpful in managing coronary artery disease in the future.
There are several limitations to the present study. We could not investigate circulating levels of Nogo-B. Thus, we could not determine if it serves as a surrogate biomarker of human atherosclerosis. Another limitation of our study is the rela- tively small sample size. Furthermore, we could not exclude
Fig. 6. The correlation between immunohistochemical Nogo-B activity, and plaque composition and CD68/MMP-9 expression. Nogo-B ex- pression carried a significant negative correlation with core necrosis (A), but not with calcification (B). Nogo-B expression had a significant negative correlation with the number of CD68-positive cells (C), but not with MMP-9 expression (D).
A B
C D
Necrotic core area (mm2) 5
4
3 2
1
0
0 10 20 30 40 50 60 70
Nogo-B (%)
r=-0.437 P=0.007
CD68 area (mm2) 3
2
1
0
0 10 20 30 40 50 60 70
Nogo-B (%)
r=-0.377 P=0.022
MMP-9 area (mm2) 3
2
1
0
0 10 20 30 40 50 60 70
Nogo-B (%)
r=-0.278 P=0.096
Calcium area (mm2) 4
3
2
1
0
0 10 20 30 40 50 60 70
Nogo-B (%)
r=-0.212 P=0.209
the effect of current medication or atherosclerotic risk factors, such as diabetes, smoking, or hypercholesterolemia. How- ever, the study population included subjects who suffered non-cardiac deaths, such as motor vehicle injury, stab wound injury, and fall injury. Hence, the study population appeared to represent the general population, and we believe our data accurately indicated the natural course of atherosclerosis and its relation to Nogo-B.
In conclusion, the present study shows that Nogo-B expres- sion is down-regulated and inversely correlated with FA pro- gression. This is specifically represented by the increasing size of the necrotic core. Our findings support the hypothe- sis that local Nogo-B reduction may contribute to plaque formation and/or vulnerability.
REFERENCES
1. Virmani R, Burke AP, Farb A, Kolodgie FD. Pathology of the vul- nerable plaque. J Am Coll Cardiol 2006; 47 (8 Suppl): C13-8.
2. Sen S, Hinderliter A, Sen PK, Simmons J, Beck J, Offenbacher S, Ohman EM, Oppenheimer SM. Aortic arch atheroma progression and recurrent vascular events in patients with stroke or transient is- chemic attack. Circulation 2007; 116: 928-35.
3. Doonan AL, Karha J, Carrigan TP, Bavry AA, Begelman SM, Ellis SG, Yadav J, Bhatt DL. Presence of carotid and peripheral arterial disease in patients with left main disease. Am J Cardiol 2007; 100:
1087-9.
4. Virmani R, Burke AP, Farb A. Sudden cardiac death. Cardiovasc Pathol 2001; 10: 275-82.
5. Kolodgie FD, Narula J, Burke AP, Haider N, Farb A, Hui-Liang Y, Smialek J, Virmani R. Localization of apoptotic macrophages at the site of plaque rupture in sudden coronary death. Am J Pathol 2000;
157: 1259-68.
6. Schmermund A, Schwartz RS, Adamzik M, Sangiorgi G, Pfeifer EA, Rumberger JA, Burke AP, Farb A, Virmani R. Coronary atheroscle- rosis in unheralded sudden coronary death under age 50: histo-patho- logic comparison with ‘healthy’ subjects dying out of hospital. Athero- sclerosis 2001; 155: 499-508.
7. Tardif JC, Heinonen T, Orloff D, Libby P. Vascular biomarkers and surrogates in cardiovascular disease. Circulation 2006; 113: 2936- 42.
8. Koenig W, Khuseyinova N. Biomarkers of atherosclerotic plaque in- stability and rupture. Arterioscler Thromb Vasc Biol 2007; 27: 15- 26.
9. Motoyama S, Kondo T, Sarai M, Sugiura A, Harigaya H, Sato T, In- oue K, Okumura M, Ishii J, Anno H, Virmani R, Ozaki Y, Hishida H, Narula J. Multislice computed tomographic characteristics of cor- onary lesions in acute coronary syndromes. J Am Coll Cardiol 2007;
50: 319-26.
10. Briley-Saebo KC, Mulder WJ, Mani V, Hyafil F, Amirbekian V, Ag- uinaldo JG, Fisher EA, Fayad ZA. Magnetic resonance imaging of vulnerable atherosclerotic plaques: current imaging strategies and molecular imaging probes. J Magn Reson Imaging 2007; 26: 460-
79.
11. Riccio SA, House AA, Spence JD, Fenster A, Parraga G. Carotid ul- trasound phenotypes in vulnerable populations. Cardiovasc Ultra- sound 2006; 4: 44-52.
12. Hamdan A, Assali A, Fuchs S, Battler A, Kornowski R. Imaging of vulnerable coronary artery plaques. Catheter Cardiovasc Interv 2007;
70: 65-74.
13. Kawasaki M, Bouma BE, Bressner J, Houser SL, Nadkarni SK, Mac- Neill BD, Jang IK, Fujiwara H, Tearney GJ. Diagnostic accuracy of optical coherence tomography and integrated backscatter intravas- cular ultrasound images for tissue characterization of human coro- nary plaques. J Am Coll Cardiol 2006; 48: 81-8.
14. Sano K, Kawasaki M, Ishihara Y, Okubo M, Tsuchiya K, Nishigaki K, Zhou X, Minatoguchi S, Fujita H, Fujiwara H. Assessment of vul- nerable plaques causing acute coronary syndrome using integrated backscatter intravascular ultrasound. J Am Coll Cardiol 2006; 47:
734-41.
15. DeMaria AN, Narula J, Mahmud E, Tsimikas S. Imaging vulnerable plaque by ultrasound. J Am Coll Cardiol 2006; 47 (8 Suppl): C32-9.
16. Nasu K, Tsuchikane E, Katoh O, Vince DG, Virmani R, Surmely JF, Murata A, Takeda Y, Ito T, Ehara M, Matsubara T, Terashima M, Suzuki T. Accuracy of in vivo coronary plaque morphology assess- ment: a validation study of in vivo virtual histology compared with in vitro histopathology. J Am Coll Cardiol 2006; 47: 2405-12.
17. Nair A, Kuban BD, Tuzcu EM, Schoenhagen P, Nissen SE, Vince DG. Coronary plaque classification with intravascular ultrasound radiofrequency data analysis. Circulation 2002; 106: 2200-6.
18. Dodd DA, Niederoest B, Bloechlinger S, Dupuis L, Loeffler JP, Sch- wab ME. Nogo-A, -B, and -C are found on the cell surface and inter- act together in many different cell types. J Biol Chem 2005; 280:
12494-502.
19. Virmani R, Kolodgie FD, Burke AP, Finn AV, Gold HK, Tulenko TN, Wrenn SP, Narula J. Atherosclerotic plaque progression and vul- nerability to rupture: angiogenesis as a source of intraplaque hem- orrhage. Arterioscler Thromb Vasc Biol 2005; 25: 2054-61.
20. Rodriguez-Granillo GA, Garci@a-Garci@a HM, McFadden EP, Valgi- migli M, Aoki J, de Feyter P, Serruys PW. In vivo intravascular ultra- sound-derived thin-cap fibroatheroma detection using ultrasound radiofrequency data analysis. J Am Coll Cardiol 2005; 46: 2038-42.
21. Rodriguez-Feo JA, Hellings WE, Verhoeven BA, Moll FL, de Klei- jn DP, Prendergast J, Gao Y, van der Graaf Y, Tellides G, Sessa WC, Pasterkamp G. Low levels of Nogo-B in human carotid atheroscle- rotic plaques are associated with an atheromatous phenotype, reste- nosis, and stenosis severity. Arterioscler Thromb Vasc Biol 2007; 27:
1354-60.
22. Ko_nig A, Klauss V. Virtual histology. Heart 2007; 93: 977-82.
23. Granada JF, Wallace-Bradley D, Win HK, Alviar CL, Builes A, Lev EI, Barrios R, Schulz DG, Raizner AE, Kaluza GL. In vivo plaque characterization using intravascular ultrasound-virtual histology in a porcine model of complex coronary lesions. Arterioscler Thromb Vasc Biol 2007; 27: 387-93.
24. Ross R. Atherosclerosis-an inflammatory disease. N Engl J Med 1999;
340: 115-26.
25. Sluijter JP, de Kleijn DP, Pasterkamp G. Vascular remodeling and
protease inhibition-bench to bedside. Cardiovasc Res 2006; 69: 595- 603.
26. Kondos GT, Hoff JA, Sevrukov A, Daviglus ML, Garside DB, Devries SS, Chomka EV, Liu K. Electron-beam tomography coronary artery calcium and cardiac events: a 37-month follow-up of 5635 initially asymptomatic low- to intermediate-risk adults. Circulation 2003; 107:
2571-6.
27. Keelan PC, Bielak LF, Ashai K, Jamjoum LS, Denktas AE, Rumber- ger JA, Sheedy II PF, Peyser PA, Schwartz RS. Long-term prognos- tic value of coronary calcification detected by electron-beam com- puted tomography in patients undergoing coronary angiography.
Circulation 2001; 104: 412-7.
28. Ostrom MP, Gopal A, Ahmadi N, Nasir K, Yang E, Kakadiaris I,
Flores F, Mao SS, Budoff MJ. Mortality incidence and the severity of coronary atherosclerosis assessed by computed tomography angio- graphy. J Am Coll Cardiol 2008; 52: 1335-43.
29. Chatzizisis YS, Coskun AU, Jonas M, Edelman ER, Feldman CL, Stone PH. Role of endothelial shear stress in the natural history of coronary atherosclerosis and vascular remodeling: molecular, cel- lular, and vascular behavior. J Am Coll Cardiol 2007; 49: 2379-93.
30. Paszkowiak JJ, Maloney SP, Kudo FA, Muto A, Teso D, Rutland RC, Westvik TS, Pimiento JM, Tellides G, Sessa WC, Dardik A. Evidence supporting changes in Nogo-B levels as a marker of neointimal expan- sion but not adaptive arterial remodeling. Vascul Pharmacol 2007;
46: 293-301.