Lifestyle and Dietary Factors Associated with Serum 25-Hydroxyvitamin D Levels in Korean Young Adults
Inadequate vitamin D status is highly prevalent in the Korean population, especially among young adults. Nonetheless, correlates of suboptimal vitamin D levels in young adults are not well defined. This study aimed to investigate potentially modifiable determinants of vitamin D levels in young adults in Korea. This cross-sectional study was based on health check-up data from 3,450 healthy male and female university students aged 18-29 yr in Seoul between April and May 2013. Serum 25-hydroxyvitamin D [25(OH)D] levels were determined using chemiluminescent immunoassay. Anthropometric data were measured, and lifestyle, dietary, and sociodemographic factors were obtained through self-
administered questionnaires. General linear regression was used to assess correlates of serum 25(OH)D levels. The mean serum 25(OH)D level was 11.1 ng/mL, and the prevalence of 25(OH)D levels less than 10 ng/mL was 44.7% (39.5% in men, 50.2% in women). In a final multivariable model, significant positive correlates of serum 25(OH)D were older age, male sex, increased physical activity, sunlight exposure ≥ 30 min/day, eating breakfast regularly, consumption of dairy and fatty fish, and use of vitamin D-containing supplements. In contrast, significant inverse correlates were obesity (body mass index, BMI ≥ 25 kg/m2) or underweight (BMI < 18.5 kg/m2), abdominal obesity, increased sedentary time, and frequent consumption of instant noodles and sugar-sweetened beverages. In conclusion, many modifiable lifestyle and dietary factors were associated with low serum 25(OH)D levels in Korean young adults. Further studies on potential mechanisms of the correlates and optimal strategies to improve vitamin D status in this vulnerable subpopulation are warranted.
Keywords: Vitamin D; Young Adult; Life Style; Thinness; Obesity; Breakfast; Instant Noodle; Sugar-sweetened Beverage
Hee-Kyung Joh,1,2 Chun Soo Lim,3 and BeLong Cho4,5,6
1Department of Medicine, Seoul National University College of Medicine, Seoul; 2Department of Family Medicine, Seoul National University Health Service Center, Seoul; 3Department of Internal Medicine, Seoul National University Boramae Medical Center, Seoul; 4Department of Family Medicine and Health Promotion Center, Seoul National University Hospital, Seoul; 5Advanced Institutes of
Convergence Technology, Seoul National University, Seoul; 6Institute on Aging, Seoul National University College of Medicine, Seoul, Korea
Received: 11 April 2015 Accepted: 12 May 2015 Address for Correspondence:
BeLong Cho, MD
Department of Family Medicine, Seoul National University Hospital, 101 Daehak-ro, Jongno-gu, Seoul, 110-744, Korea Tel: +82.2-2072-2195, Fax: +82.2-766-3276 E-mail: [email protected]
http://dx.doi.org/10.3346/jkms.2015.30.8.1110 • J Korean Med Sci 2015; 30: 1110-1120
INTRODUCTION
Vitamin D insufficiency is emerging as a global health problem (1), and a high proportion of Koreans are suffering from this condition. According to the Korea National Health and Nutri- tion Examination Survey 2008, the prevalence of vitamin D in- sufficiency, defined as a serum 25-hydroxyvitamin D [25(OH) D] level below 20 ng/mL, was 47.3% in men and 64.5% in wom- en (2). Contrary to the common belief that vitamin D insuffi- ciency is more prevalent in the elderly population, young adults in their 20s had both the lowest 25(OH)D levels and the highest prevalence of 25(OH)D insufficiency (65.0% in men and 79.9%
in women) among all age groups in Korea (2, 3). National sur- veys conducted in Canada (4) and the United Kingdom (UK) (5) revealed similar patterns of a high prevalence of vitamin D in- sufficiency in young adults. In Canada, young adults aged 20 to 39 yr had the lowest mean serum 25(OH)D levels (65 nM/L) and the highest prevalence of vitamin D deficiency (< 27.5 nM/
L) among all age groups (4). Likewise, the prevalence of low vi-
tamin D status in the UK during 1992-2001 was the highest in young adults aged 19 to 24 yr among the non-Asian community dwelling population, with a range of 20%-40% (5). These data imply that vitamin D insufficiency is an important health con- cern among young adults in many countries (2).
Vitamin D is critical to bone mineral metabolism. Severe vita- min D deficiency is associated with rickets in children and os- teomalacia in adults (1). Recent studies reveal that mild vitamin D deficiency increases parathyroid hormone levels and may also deteriorate bone health (1, 6). Furthermore, accumulating evidence suggests that vitamin D plays beneficial roles in can- cer, cardiovascular diseases, diabetes, pregnancy complications, infections, and mortality (7-10). Even when we take only bone health into consideration, among many aspects of vitamin D- related health outcomes, a sufficient level of vitamin D is crucial in young adulthood. Peak bone mass is achieved between the ages of 18 and 25 (11), and individuals who have higher peak bone mass at these ages are less likely to develop osteoporosis later in life (11).
Endocrinology, Nutrition & Metabolism
http://jkms.org 1111
http://dx.doi.org/10.3346/jkms.2015.30.8.1110
Nonetheless, the causes of high prevalence of vitamin D in- sufficiency among young adults are not clear. The established risk factors for low vitamin D status include limited sun expo- sure, low intake of vitamin D-rich foods, and obesity (12, 13).
Presumably, behavioral factors such as indoor lifestyle, sun- screen use, or unfavorable dietary habits in young adulthood may partly contribute to low vitamin D status (14). In fact, high education levels and indoor occupations were associated with low vitamin D status in the Korean population as well as in a pooled cohort of multiple countries (2, 3, 13, 15). Few studies, however, have been undertaken on the correlates of vitamin D levels in young adults. Information on potentially modifiable determinants of vitamin D status in this age group may help the effort to develop promising interventions to achieve optimal vi- tamin D status. We aimed to: (i) evaluate vitamin D status in a large group of university students aged 18-29 yr in Seoul, South Korea; and (ii) investigate the associations between serum 25(OH)D levels and broad-ranges of sociodemographic, life- style, and dietary factors.
MATERIALS AND METHODS Study population
The present cross-sectional study was based on health check- up data from healthy male and female students of a university in Seoul (latitude 37°N), South Korea during 3 weeks in April and May 2013. The health check-up consisted of a comprehen- sive health examination and self-administered questionnaires.
Health examination data were obtained with standardized methods using the same equipment for all measurements in a single medical center on a campus.
A total of 4,390 students participated in the health check-up.
For our purposes, we excluded students aged less than 18 or more than 30 yr (n = 195), those who did not have a valid serum 25(OH)D measurement (n = 17), those who did not complete questionnaires (n = 319), and individuals who did not give con- sent to participate in the study (n = 231). We also excluded non- Korean students (n = 178) because of the differences in race. Af- ter this exclusion, 3,450 participants remained for the current analysis.
Data collection Anthropometry
All anthropometric measurements were performed by trained staff. Weight and height were measured in light clothing without shoes. Body mass index (BMI) was calculated as weight in kilo- grams divided by the square of height in meters (kg/m2). Stan- dard BMI cut-points for the Korean population (16) were used to categorize weight status: underweight (< 18.5 kg/m2), normal (18.5-22.9 kg/m2), overweight (23-24.9 kg/m2), and obese (≥ 25.0 kg/m2). Waist circumference was measured in centimeters us-
ing an un-stretched measuring tape placed around the mid- points between the lowest rib margin and the uppermost bor- ders of the iliac crest at the end of a normal expiration. Accord- ing to the Korean abdominal obesity cut-points (90 cm in men, 85 cm in women), waist circumference was dichotomized into normal and abdominal obesity (17).
Covariates
Participants completed a web-based self-administered ques- tionnaire on sociodemographic, lifestyle, and dietary factors.
Sociodemographic factors included age, sex, academic status (undergraduate, master’s course, or doctoral course), home- town (Seoul, urban, rural, or foreign country), residence and marital status (living with parents, boarding oneself, dormitory, married and living with a partner, or others), parents’ education levels, and household income.
Lifestyle factors included physical activity (low/moderate/
high), sedentary time, duration of sunlight exposure, use of sun-blocking products or protective long sleeved clothing (yes/
no), alcohol consumption (none/moderate/heavy), and smok- ing status (none/past/current). Physical activity [metabolic equivalent (MET)-minutes/week] was assessed using the Short Version of the International Physical Activity Questionnaire (18). Highly active individuals were those who practiced a) vig- orous activity on at least 3 days/week and a total physical activi- ty at least 1,500 MET-minutes/week or b) total physical activity at least 3,000 MET-minutes/week. Moderately active individu- als were those who practiced a) vigorous activities at least 20 min/day on at least 3 days/week or b) moderate activities or walking at least 30 min/day at least 5 days/week and whose to- tal activity levels were lower than highly active individuals. Sed- entary time included time spent sitting at a desk, chatting in a cafe, reading, traveling on a bus, and watching television on weekdays, and was categorized into quartiles. To assess sun- light exposure, the following question was asked: “How much exposure to sunlight did you have outdoors on average in a day (e.g., outdoor walking or exercise, moving around classrooms during daytime)?” and duration of sunlight exposure was di- chotomized into < 30 min/day and ≥ 30 min/day. To assess sun-avoidance habits, participants were asked “Do you wear sunscreen, a brimmed hat, or long sleeves to avoid sunlight ex- posure? (yes/no)” Heavy drinking was defined as consuming
≥ 14 drinks/week in men and ≥ 7 drinks/week in women, and moderate drinking was defined as less than these amounts.
Participants provided information on dietary habits, includ- ing breakfast eating (days/week), average meal frequencies per day, and use of vitamin D-containing supplements (vitamin D as single-ingredient or combined with calcium) or multivita- min. A brief qualitative food frequency questionnaire (FFQ) with 8 food items was used to assess usual dietary intake over the preceding year. Although there is no valid vitamin D data-
base in Korea, consumption frequencies of fatty fish (mackerel, saury, tuna, or salmon) and dairy (milk, yogurt) were asked be- cause both are major food sources of vitamin D in the Korean population (19). In addition, fruit and vegetable intake frequen- cies were asked as proxies for an overall healthy diet; high-fat or processed meat, instant noodle, refined carbohydrates, and sugar-sweetened beverage (SSB) intake frequencies were asked as proxies for unhealthy diet. Consumption frequency was clas- sified into 9 categories ranging from less than once a month to 3 or more times per day.
Measurement of serum 25(OH)D levels
Serum 25(OH)D is considered the best indicator of vitamin D status in the body because it has a relatively long half-life (ap- proximately 3 weeks), is unregulated by a homeostatic system in the body, and accounts for multiple determinants (e.g., sun exposure, skin pigmentation, and dietary intake) (20). Partici- pants were asked to fast for at least 12 hr, whereupon venous blood samples were drawn for 25(OH)D analyses. Blood sam- ples were immediately centrifuged, and then sent to Green Cross Reference Laboratory, Inc. (Yongin, Korea) within 6 hr of blood draw. Serum 25(OH)D levels were measured using chemilumi- nescent immunoassay (CLIA, LIASON 25-OH Vitamin D Total Assay; DiaSorin Inc., Stillwater, MN, USA). Intra-assay coeffi- cient of variation (CV) was 2.8%, and interassay CV ranged from 3.0% to 3.6%. The lower limit of detection was 4 ng/mL. The quality of the method was evaluated using the Vitamin D Exter- nal Quality Assessment Scheme and the National Institute of Standards and Technology vitamin D metabolites quality as- surance program.
Statistical analysis
The distribution of serum 25(OH)D levels was demonstrated as a histogram. Descriptive statistics (frequencies, means, and standard deviations) were used to estimate serum 25(OH)D levels by subgroups.
To identify independent determinants of circulating 25(OH) D levels, backward linear regression by the maximum likeli- hood method was used allowing only variables with a P value
< 0.05 for at least 1 category to remain in the model. In the final model, all significant (P < 0.05) variables from earlier models remained to simultaneously adjust for other variables. As the distribution of serum 25(OH) was skewed, it was log-trans- formed prior to linear regression. The log-transformed and un- transformed model results were similar; therefore, to ease inter- pretation, only the untransformed 25(OH)D results are pre- sented.
We calculated multivariable-adjusted mean serum 25(OH)D levels by categories of the independent variables via PROC GLM after adjustment for all covariates in the final linear mod- el. Tests for trend were conducted by assigning an ordinal vari-
able to each category of independent variables and modeling this value as a continuous variable in regression models. All P values were two-sided, and P < 0.05 was considered statistically significant. Statistical tests were performed using SAS software, version 9.4 (SAS Institute, Cary, NC, USA). Figures were created using STATA version 12.0 (Stata Corp., College Station, TX, USA).
Ethics statement
This study was approved by the institutional review board of Seoul National University College of Medicine/Seoul National University Hospital (IRB number, C-1304-062-481). All partici- pants provided written informed consent.
RESULTS
Table 1 presents participants’ characteristics and unadjusted mean serum 25(OH)D levels by subgroups. A total of 3,450 par- ticipants (1,768 men and 1,682 women) were included in anal- yses, and their mean age was 22.5 yr. The mean serum 25 (OH) D levels were higher in men (11.6 ± 4.2 ng/mL) than in women (10.7 ± 4.0 ng/mL). Participants who reported using vitamin D supplements was 3.6%, and those who reported using combined vitamin D and calcium supplements was 4.9%.
Vitamin D status among study participants
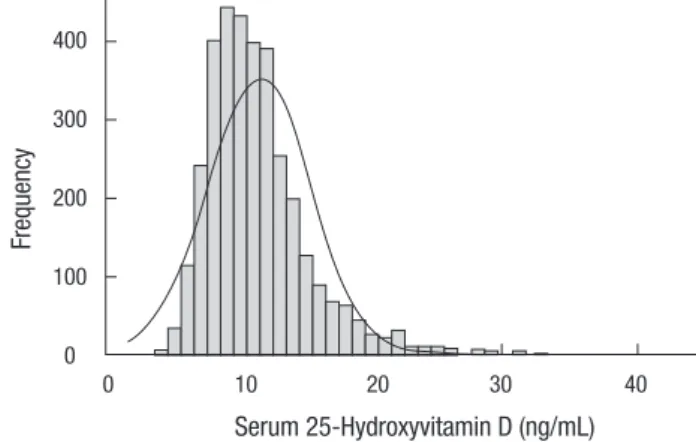
Fig. 1 illustrates the distribution of serum 25(OH)D concentra- tions among participants. Serum 25(OH)D levels showed a rel- atively skewed distribution (median 10.4 ng/mL, mean 11.1 ng/
mL). With respect to the vitamin D status, 44.7% of students (39.5% in men, 50.2% in women) had serum 25(OH)D levels
< 10 ng/mL, while only 3.8% had serum 25(OH)D levels ≥ 20 ng/mL (Table 2).
Correlates of serum 25(OH)D levels
In the final multivariable linear model, variables positively as- sociated with serum 25(OH)D levels were older age, male sex, increased physical activity, sunlight exposure ≥ 30 min/day, dairy and fatty fish consumption, eating breakfast regularly, and use of vitamin D-containing supplements. In contrast, vari- ables inversely associated with serum 25(OH)D were female sex, underweight (BMI < 18.5 kg/m2) or obesity (BMI ≥ 25 kg/
m2), abdominal obesity, long sedentary time, and frequent con- sumption of instant noodles and SSBs (Table 3). We found no interactions by sex for any significant correlates. The final linear model explained 17% of the overall variance in serum 25(OH)D levels.
The multivariable-adjusted mean serum 25(OH)D levels were higher in men than in women by 1.1 ng/mL (P < 0.001;
Fig. 2). Compared with normal-weight individuals, those who were underweight (mean difference -0.42 ng/mL, P = 0.044) or obese (mean difference -0.56 ng/mL, P = 0.037) had signifi-
http://jkms.org 1113
http://dx.doi.org/10.3346/jkms.2015.30.8.1110
(Continued to the next)
Table 1. Characteristics of 3,450 Korean university students and unadjusted mean serum 25-hydroxyvitamin D [25(OH)D] levels by lifestyle, dietary, and sociodemographic factors
Parameters No. (%) 25(OH)D, ng/mL,
mean (SD)
Total 3,450 (100) 11.11 (4.09)
Men 1,768 (51.3) 11.55 (4.17)
Women 1,682 (48.8) 10.65 (3.95)
Age (yr), mean (SD) 22.5 (2.9) -
Body mass index (kg/m2)
Normal (18.5-< 23) 2,155 (62.5) 11.13 (4.22) Underweight (< 18.5) 403 (11.7) 10.38 (3.43) Overweight (23-< 25) 534 (15.5) 11.80 (4.30)
Obese ( ≥ 25) 358 (10.4) 10.73 (3.45)
Waist circumference (cm)
Normal (M < 90, F < 85) 3,295 (95.5) 11.14 (4.13) Abdominal obesity (M ≥ 90, F ≥ 85) 155 (4.5) 10.33 (2.95) Physical activity*
Low 1,363 (39.5) 10.69 (3.84)
Moderate 1,761 (51.0) 11.18 (4.05)
High 326 (9.5) 12.48 (4.91)
Sedentary time (h/day), tertile†
1 (low) 1,037 (30.1) 11.34 (4.1)
2 1,486 (43.1) 11.14 (4.1)
3 (high) 927 (26.9) 10.79 (4.0)
Sunlight exposure (min/day)
< 30 633 (18.4) 10.72 (3.91)
≥ 30 2,817 (81.7) 11.19 (4.13)
Sunblock use
No 1,394 (40.4) 11.23 (3.82)
Yes 2,056 (59.6) 11.02 (4.26)
Alcohol use
None 299 (8.7) 11.11 (4.01)
Moderate 2,649 (76.8) 11.09 (4.07)
Heavy 438 (12.7) 11.07 (3.92)
Smoking status
None 3,092 (89.6) 11.05 (4.12)
Ex-smoker 166 (4.8) 11.58 (3.91)
Current smoker 187 (5.4) 11.60 (3.78)
Meal frequency per day
< 3 or irregular 1,577 (45.7) 10.49 (3.70)
3 1,871 (54.2) 11.63 (4.32)
Breakfast (days/week)
≤ 3 1,536 (44.5) 10.42 (3.63)
4-6 865 (25.1) 11.37 (4.15)
7 1,049 (30.4) 11.89 (4.49)
Dairy intake
≤ 2/week 1,314 (38.1) 10.61 (4.03)
3-4/week 847 (24.6) 11.06 (3.77)
5-6/week 399 (11.6) 11.22 (3.85)
≥ 7/week 890 (25.8) 11.83 (4.46)
Fatty fish intake
≤ 1/month 726 (21.0) 10.40 (3.79)
2-3/month 1,109 (32.1) 11.04 (4.08)
1-2/week 1,196 (34.7) 11.31 (4.03)
≥ 3/week 419 (12.1) 11.95 (4.57)
Fruit intake
≥ 1/day 769 (22.3) 11.67 (4.71)
3-6/week 956 (27.7) 11.03 (3.77)
1-2/week 917 (26.6) 11.25 (4.11)
< 1/week 808 (23.4) 10.50 (3.71)
Parameters No. (%) 25(OH)D, ng/mL,
mean (SD) Vegetable intake
≥ 2/day 658 (19.1) 11.55 (4.51)
1/day 590 (17.1) 11.33 (4.59)
3-6/week 1,264 (36.6) 10.94 (3.69)
< 3/week 938 (27.2) 10.87 (3.94)
Red meat/processed meat intake
< 1/week 1,086 (31.5) 10.88 (4.01)
1-2/week 1,314 (38.1) 11.08 (4.09)
3-4/week 707 (20.5) 11.34 (4.04)
≥ 5/week 343 (9.9) 11.46 (4.42)
Instant noodle intake
≤ 1/month 972 (28.2) 11.59 (4.45)
2-3/month 1,046 (30.3) 11.01 (3.84)
1-2/week 1,040 (30.1) 10.97 (3.88)
≥ 3/week 392 (11.4) 10.53 (4.23)
Sugar-sweetened beverage
≤ 1/month 1,255 (36.4) 11.35 (4.25)
2-3/month 1,108 (32.1) 10.97 (4.02)
1-2/week 710 (20.6) 11.13 (4.04)
≥ 3/week 377 (10.9) 10.65 (3.79)
Refined carbohydrate intake
≤ 1/month 1,469 (42.6) 11.08 (4.01)
2-3/month 989 (28.7) 11.09 (4.10)
1-2/week 470 (13.6) 11.10 (3.85)
≥ 3/week 522 (15.1) 11.23 (4.48)
Supplement use
Vitamin D 123 (3.6) 14.91 (7.00)
Vitamin D and calcium 170 (4.9) 13.97 (6.12)
Multivitamin 1,254 (36.4) 12.59 (5.00)
Academic status
Undergraduate 2,372 (68.8) 11.15 (4.02)
Master’s course 944 (27.4) 11.04 (4.25)
Doctoral course 134 (3.9) 10.74 (4.12)
Regional background
Seoul 1,307 (37.9) 11.36 (4.43)
Urban area 1,884 (54.6) 10.94 (3.89)
Rural area 190 (5.5) 10.65 (3.45)
Foreign country 69 (2.0) 11.98 (3.98)
Residence
Living with parent(s) 1,409 (40.8) 11.29 (4.23)
Boarding oneself 1,202 (34.8) 11.15 (3.97)
Dormitory 742 (21.5) 10.66 (4.03)
Others‡ 93 (2.7) 11.30 (3.85)
Household income, quartile§
1 (low) 801 (23.2) 11.16 (4.26)
2 1,135 (32.9) 10.72 (3.77)
3 476 (13.8) 11.40 (4.13)
4 (high) 1,038 (30.1) 11.35 (4.25)
Father’s education (yr)
> 12 811 (23.5) 10.76 (3.94)
≤ 12 2,639 (76.5) 11.21 (4.13)
Mother’s education (yr)
> 12 1,329 (38.5) 11.05 (4.18)
≤ 12 2,121 (61.5) 11.14 (4.03)
*High: i) vigorous: ≥ 3 day/wk and total physical activity ≥ 1,500 MET-min/wk or ii) total physical activity ≥ 3,000 MET-min/wk; moderate: i) ≥ 3 days of vigorous activity at least 20 min/d or ii) ≥ 5 days of moderate activity and/or walking at least 30 min/d or iii) ≥ 5 days of any combination of activities ≥ 600 MET-min/wk; †Tertile: sedentary time (hr)
≤ 7, 8-10, ≥ 11; ‡Boarding house, relative’s house, married, and others; §Quartile: monthly family income (10,000 Korean Won) < 170, 170-245, 246-374, ≥ 375.
cantly lower serum 25(OH)D levels. Likewise, individuals who were centrally obese had significantly lower 25(OH)D levels (mean difference -0.76 ng/mL, P = 0.048). Students in the high level of physical activity had higher mean serum 25(OH)D lev- els than those in the low level by 1.07 ng/mL (P < 0.001), and the positive linear trend was significant (Ptrend< 0.001). When we entered total physical activity as a continuous variable, a similar positive association was observed (beta coefficient: 0.2 per 1,000 MET-minutes/week, P < 0.001). Individuals who spent more time in sedentary activities tended to have lower serum 25(OH)D levels (Ptrend= 0.003), and this inverse association was independent of physical activity level, duration of sunlight ex- posure, and other covariables.
Among dietary factors, frequent consumption of dairy and fatty fish—major dietary sources of vitamin D—were associated with higher serum 25(OH)D levels (Ptrend< 0.001, 0.006, respec- tively; Fig. 3). Interestingly, frequent consumption of instant noodles and SSBs were significantly associated with lower se- rum 25(OH)D levels (Ptrend< 0.001, 0.041, respectively). Partici- pants who consumed instant noodles ≥ 3 times/week had 0.79 ng/mL lower serum 25(OH)D levels than those who consumed noodles ≤ 1 time/month (P = 0.001). The inverse relationship between instant noodle intake and serum 25(OH)D levels was Table 2. Distribution of serum 25-hydroxyvitamin D [25(OH)D] level among 3,450 Korean university students aged 18 to 29 yr, 2013 spring
25(OH)D, ng/mL Total
(n = 3,450)
Men (n = 1,768)
Women (n = 1,682)
< 10.0 1,542 (44.7) 698 (39.5) 844 (50.2)
10.0-11.9 806 (23.4) 413 (23.4) 393 (23.4)
12.0-19.9 974 (28.2) 586 (33.1) 388 (23.1)
20.0-29.9 117 (3.5) 66 (3.7) 51 (3.0)
≥ 30.0 11 (0.3) 5 (0.3) 6 (0.4)
Numbers are presented as number (%).
Frequency
Serum 25-Hydroxyvitamin D (ng/mL)
0 10 20 30 40
400
300
200
100
0
Fig. 1. Distribution of serum 25-hydroxyvitamin D (25(OH)D) concentrations among 3,450 Korean university students aged 18 to 29 yr, 2013 spring. Unadjusted fre- quency distribution of serum 25(OH)D levels in the study participants (n = 3,450). The graph was smoothed using normal-smoothing density for normal distribution. One subject with a serum 25(OH)D level greater than 50 ng/mL was excluded from the figure.
Table 3. Variables associated with serum 25-hydroxyvitamin D concentrations (ng/
mL) in backward elimination regression
Variables β (SE) P value P trend
Age (yr) 0.05 (0.02) 0.035
Female sex -1.10 (0.15) < 0.001
Body mass index (kg/m2) 0.37
Underweight ( < 18.5) -0.42 (0.21) 0.044 Normal (18.5- < 23) - (referent)
Overweight (23- < 25) 0.28 (0.19) 0.14
Obese ( ≥ 25) -0.56 (0.27) 0.037
Waist circumference (cm)
Normal (M < 90, F < 85) - (referent) Abdominal obesity (M ≥ 90, F ≥ 85) -0.76 (0.38) 0.048
Physical activity* < 0.001
Low - (referent)
Moderate 0.23 (0.14) 0.09
High 1.07 (0.24) < 0.001
Sedentary time (h/day), tertile† 0.003
1 (low) - (referent)
2 -0.12 (0.15) 0.43
3 (high) -0.51 (0.17) 0.003
Sunlight exposure (min/day)
< 30 - (referent)
≥ 30 0.37 (0.17) 0.032
Dairy intake < 0.001
≤ 2/week - (referent)
3-4/week 0.29 (0.17) 0.08
5-6/week 0.39 (0.22) 0.07
≥ 7/week 0.58 (0.18) 0.001
Fatty fish intake 0.006
≤ 1/month - (referent)
2-3/month 0.28 (0.18) 0.13
1-2/week 0.35 (0.19) 0.07
≥ 3/week 0.73 (0.25) 0.004
Instant noodle intake < 0.001
≤ 1/month - (referent)
2-3/month -0.41 (0.17) 0.015
1-2/week -0.48 (0.18) 0.007
≥ 3/week -0.79 (0.24) 0.001
Sugar-sweetened beverage 0.041
≤ 1/month - (referent)
2-3/month -0.28 (0.16) 0.08
1-2/week -0.18 (0.19) 0.36
≥ 3/week -0.54 (0.23) 0.020
Breakfast (day/week) < 0.001
≤ 3 - (referent)
4-6 0.71 (0.17) < 0.001
7 1.04 (0.17) < 0.001
Supplement use vs. non-use
Vitamin D 2.17 (0.39) < 0.001
Vitamin D and calcium combined 0.95 (0.33) 0.005
Multivitamin 1.90 (0.14) < 0.001
Household income, quartile‡ 0.58
1 (low) - (referent)
2 -0.48 (0.17) 0.006
3 0.10 (0.22) 0.65
4 (high) -0.10 (0.18) 0.57
All variables were adjusted for the variables in the table mutually. *High: i) vigorous activity ≥ 3 day/wk and total physical activity ≥ 1,500 MET-min/wk or ii) total physi- cal activity ≥ 3,000 MET-min/wk; moderate: i) ≥ 3 days of vigorous activity at least 20 min/d or ii) ≥ 5 days of moderate activity and/or walking at least 30 min/d or iii) ≥ 5 days of any combination of activities ≥ 600 MET-min/wk; †Tertile: sedentary time (hr)
≤ 7, 8-10, ≥ 11; ‡Quartile: monthly family income (10,000 Korean Won) < 170, 170- 245, 246-374, ≥ 375.
http://jkms.org 1115
http://dx.doi.org/10.3346/jkms.2015.30.8.1110
similar in magnitude to the positive association between fatty fish intake and serum 25(OH)D levels. Similarly, students who consumed SSBs ≥ 3 times/week had 0.54 ng/mL lower serum 25(OH)D levels than those with an intake of ≤ 1 time/month (P = 0.041). These inverse associations were independent of other dietary habits and consistent after further adjustment for fruit and vegetables intake—proxies for a healthy diet. Partici- pants who consumed SSBs frequently tended to consume milk more frequently. Among students who consumed SSBs ≥ 3/
week, a multivariable-adjusted OR of dairy intake ≥ 7/week was 1.81 (95% CI 1.29-2.54; Ptrend< 0.001) compared with those consumed SSBs ≤ 1 time/month. Eating breakfast was positive- ly associated with serum 25(OH)D levels. Compared with stu- dents who ate breakfast less than 4 days/week, students who ate breakfast daily had 1.04 ng/mL higher levels of serum 25(OH)D (Ptrend< 0.001). Supplemental vitamin D intake was also a sig- nificant correlate with the largest difference (2.17 ng/mL) in se- rum 25(OH)D levels between categories.
Household income was associated with low serum 25(OH)D levels only in the second lowest quartile, and no significant lin- ear trend across quartiles was observed. Students who had grown up in foreign countries before university admission (n = 93) had higher vitamin D levels than those who had grown up in Korea, but this association was statistically marginal (P = 0.054). Among the initial covariables, parents’ education levels, residence, smoking, alcohol consumption, use of sunblock, meal frequency, and consumption of vegetables, fruits, and high-fat meat were not significantly associated with serum
25(OH)D levels.
Using the significant correlates, we postulated two extreme groups based on lifestyle: i) people with the healthiest life- style—normal body weight, no central obesity, high physical activity, short sedentary time, sunlight exposure ≥ 30 min/day, frequent consumption of dairy ( ≥ 7 times/week) and fish ( ≥ 3 times/week), low intake of instant noodles and SSBs ( ≤ 1 time/
week), daily breakfast eating, and vitamin D supplementation and ii) people with the unhealthiest lifestyle—general and cen- tral obesity, low physical activity, long sedentary time, sunlight exposure < 30 min/day, breakfast eating ≤ 1 days/week, no vi- tamin D supplementation, low intake of dairy ( ≤ 2 times/week) and fish ( ≤ 1 time/month), and frequent consumption of in- stant noodles and SSBs ( ≥ 3 times/week). The calculated dif- ference in serum 25(OH)D levels between these two extreme groups was 11.0 ng/mL (healthiest:17.9 ng/mL ± SE 0.50 vs.
unhealthiest: 6.9 ng/mL ± SE 0.47), which was considerably large given the distribution of 25(OH)D in the participants of this study.
DISCUSSION
This study suggests that vitamin D deficiency is highly prevalent among Korean university students living at latitude 37° north.
Over 95% of students had serum 25(OH)D levels less than 20 ng/mL and about 45% had less than 10 ng/mL in spring. Many potentially modifiable lifestyle and dietary factors were inde- pendently associated with serum 25(OH)D levels. Significant
25(OH)D (ng/mL)
Under-weightNormal Over-weight Obese
* *
12.5 12.0 11.5 11.0 10.5 10.0
BMI
10.8 10.6
11.2 11.4
25(OH)D (ng/mL)
Men Women
†
12.5 12.0 11.5 11.0 10.5 10.0
Sex
11.6
10.5 25(OH)D (ng/mL)
Normal Abdominal obesity
* 12.5
12.0 11.5 11.0 10.5 10.0
Waist circumference
11.1
10.4
A B C
25(OH)D (ng/mL)
<30 min/day ≥30 min/day
* 12.5
12.0 11.5 11.0 10.5 10.0
Sunlight exposure
10.8
11.2
25(OH)D (ng/mL)
Low Moderate High 12.5 †
12.0 11.5 11.0 10.5 10.0
Physical activity Ptrend<0.001
10.9 11.1
12.0
25(OH)D (ng/mL)
T1 (low) T2 T3 (high)
†
12.5 12.0 11.5 11.0 10.5 10.0
Sedentary time Ptrend=0.003
11.3 11.2
10.8
D E F
Fig. 2. Multivariable-adjusted mean serum 25-hydroxyvitamin D [25(OH)D] levels by sex and lifestyle factors (A-F). BMI, body mass index (kg/m2): underweight (< 18.5), normal (18.5-<23), overweight (23-<25), and obese (≥ 25). Multivariable-adjusted mean serum 25(OH)D levels were calculated via PROC GLM after adjustment for the variables in the figure and age, sex, body mass index (underweight/normal/overweight/obese), abdominal obesity (no/yes), physical activity (low/moderate/high), sedentary time (tertile), and sunlight exposure (< 30 min/d, ≥ 30 min/d). *P < 0.05 and †P < 0.01 with the leftmost category as a reference.
positive correlates were older age, male sex, increased physical activity, sunlight exposure, eating breakfast regularly, consump- tion of dairy and fatty fish, and use of vitamin D-containing supplements. In contrast, significant inverse correlates were general and abdominal obesity, underweight, long sedentary time, and frequent consumption of instant noodles and SSBs.
The postulated difference in serum 25(OH)D levels between groups with all healthy correlates and those with all unhealthy ones was substantially higher than the differences observed for any single component of correlates.
The low vitamin D status in our participants was similar to that found in nationally representative data, although compari- son between studies is rather difficult due to the lack of stan- dardization of vitamin D measurement and the different sea- sons when blood samples were collected. Among Korean ado- lescents, the prevalence of vitamin D deficiency ( < 10 ng/mL) reached about 90% during winter and spring in the fourth Ko-
rea National Health and Nutrition Examination Survey 2008- 2009 (15). As in other northern countries, substantial seasonal changes in serum 25(OH)D levels exist in Korea. The mean se- rum 25(OH)D levels were the lowest in March and April and the highest in August and September (15, 19), and the preva- lence of 25(OH)D deficiency was 4 to 5 times higher in winter and spring than in summer and fall (3).
Male students had significantly higher serum 25(OH)D levels than female students, which is consistent with previous results (3, 15, 21, 22). The sex difference in vitamin D status may be due to women’s higher percentage of body fat, differences in amount of time spent outdoors, or sun protection behaviors such as use of sunscreen (13).
In our study, both general and abdominal obesity was inde- pendently associated with low serum 25(OH)D levels. Many previous studies found inverse associations between BMI and serum 25(OH)D levels (12, 13, 22, 23), while a few studies indi-
25(OH)D (ng/mL)
≤2/week 3-4/week 5-6/week ≥7/week
†
12.5 12.0 11.5 11.0 10.5 10.0
Dairy
10.8
11.4
11.1 11.2
Ptrend<0.001
25(OH)D (ng/mL)
≤1/month 2-3/month 1-2/week ≥3/week
†
12.5 12.0 11.5 11.0 10.5 10.0
Fatty fish
10.8
11.5
11.1 11.2
Ptrend<0.006
25(OH)D (ng/mL)
≤1/month 2-3/month 1-2/week ≥3/week
†
* †
12.5 12.0 11.5 11.0 10.5 10.0
Instant noodle
11.5
10.7
11.1 11.0
Ptrend<0.001
A B C
25(OH)D (ng/mL)
≤1/month 2-3/month 1-2/week ≥3/week
* 12.5
12.0 11.5 11.0 10.5 10.0
Suger-sweetened beverage
11.3
10.7
11.0 11.1
Ptrend<0.041
25(OH)D (ng/mL)
No use Use
13.5 †
13.0 12.5 12.0 11.5 11.0 10.5 10.0
Vitamin D supplement
11.2
13.3
25(OH)D (ng/mL)
≤3/week 4-6/week 7/week
†
†
13.5 13.0 12.5 12.0 11.5 11.0 10.5 10.0
Breakfast
Ptrend<0.001
10.6
11.3
11.7
E F
D
25(OH)D (ng/mL)
No use Use
* 13.5
13.0 12.5 12.0 11.5 11.0 10.5 10.0
Vitamin D/calcium supplement
11.2
12.2
25(OH)D (ng/mL)
No use Use
†
13.5 13.0 12.5 12.0 11.5 11.0 10.5 10.0
Multivitamin
10.6
12.5
G H
Fig. 3. Multivariable-adjusted mean serum 25-hydroxyvitamin D [25(OH)D] levels by dietary factors (A-H). Multivariable-adjusted mean serum 25(OH)D levels were calculated via PROC GLM after adjustment for the variables in the figure and dairy intake (≤ 2, 3-4, 5-6, ≥7/wk), fatty fish intake (≤ 1/mon, 2-3/mon, 1-2/wk, ≥3/wk), instant noodle in- take (≤ 1/mon, 2-3/mon, 1-2/wk, ≥ 3/wk), sugar-sweetened beverage intake (≤ 1/mon, 2-3/mon, 1-2/wk, ≥ 3/wk), breakfast eating (≤ 3, 4-6, 7 d/wk), and vitamin D-contain- ing supplements use (yes/no). *P < 0.05 and †P < 0.01 with the leftmost category as a reference except for B (normal category as a reference).
http://jkms.org 1117
http://dx.doi.org/10.3346/jkms.2015.30.8.1110
cated that abdominal obesity was more strongly related to low 25(OH)D status than overall obesity (21). Plausible mechanisms supporting these associations may include a dilutional effect, sequestration of vitamin D in fat tissue, lack of outdoor activity in obese individuals, or the direct effects of vitamin D on in- creasing fat oxidation rates, diet-induced thermogenesis, and anti-lipogenesis in adipocytes (13, 22, 23).
Furthermore, we found that being underweight (BMI < 18.5 kg/m2) was also associated with low vitamin D status, while most prior studies investigated obesity only. Although we are unaware of any previous studies using a BMI cut-off of 18.5 kg/
m2, an association between BMI < 23 kg/m2 and vitamin D in- sufficiency among Korean women (2) and a possible inverted U-shaped relationship between BMI and serum 25(OH)D levels among German adults (24) were suggested. The mechanisms remain to be elucidated, but it is plausible that underweight per- sons may be prone to vitamin D deficiency due to inadequate food consumption or lower exposure to sunlight as they are less often outdoors or perhaps wear more covering clothing (24).
Consistent with the previous results (3, 12, 15, 22), we found that increased physical activity was positively associated with se- rum 25(OH)D levels, and sedentary time was inversely associat- ed. Both physical activity and sedentary time were significant even after mutual adjustment and further adjustment for sun- light exposure time. Although the present study did not distin- guish outdoor physical activity from indoor, the independent as- sociations imply that physical activity may have an independent biological role in modulating serum 25(OH)D beyond the role as a surrogate for sunlight exposure during outdoor activity (13, 23).
The duration of sunlight exposure was only moderately asso- ciated with serum 25(OH)D levels in our study, which can main- ly be explained by low ultraviolet-B (UVB) levels, wearing long- sleeved clothing, and a tendency to stay indoors in winter and spring when this study was conducted (3). Also, the duration of sunlight exposure was assessed by questionnaire, and may not be precisely reported. Even in summer, many people in Asian countries avoid direct sun exposure and use sunscreen due to cultural practices and concerns about aging and skin cancer (13, 14). Indeed, about 60% of our study participants reported regular use of sunscreen or long sleeved clothing. As many in- dividuals now practice sun avoidance behaviors, sunlight expo- sure may no longer correlate well with vitamin D status.
We found that frequent consumption of fatty fish and dairy was positively associated with serum 25(OH)D levels as in prior studies (13, 15, 21, 22). Because few foods are fortified with vita- min D in Korea, dietary sources of vitamin D are not common.
Fatty fish and milk are some of the few food sources of vitamin D in Korea (19). Although most dairy products in Korea are not fortified with vitamin D (15), calcium in dairy may also play a role in vitamin D utilization. Low dietary calcium intake may induce mild hyperparathyroidism which may enhance conver-
sion of 25(OH)D into 1,25(OH)2D, consequently lowering 25(OH)D levels (25). Dietary vitamin D in general contributes to vitamin D status only in small part compared with cutaneous vitamin D synthesis via UVB radiation, but the influence of di- etary intake may increase during winter when levels of effective UVB radiation decrease (24).
The consumption of instant noodles is high among Asian populations, and South Koreans are the highest consumers per capita in the world (26). Of note, young adults who consumed instant noodles more frequently had significantly lower levels of serum 25(OH)D in our results. The magnitude of difference in serum 25(OH)D between extreme categories of instant noodle intake was similar to that of extreme categories of fatty fish in- take (an established major dietary source of vitamin D), but the association was in the opposite direction. We are yet unaware of any previous studies that investigated the association between instant noodle consumption and serum vitamin D levels. An association between instant noodle consumption and meta- bolic syndrome was suggested in Korean women, and the com- bined effect of high energy density, glycemic loads, saturated fat, and sodium in instant noodles was hypothesized to contrib- ute to the association (26). Since the observed association in our study does not provide any particular mechanisms, further studies are warranted to find direct mechanisms. It is also likely that instant noodle intake serves as a proxy for differences in health behavior not captured by the constructs of healthy diet.
SSB consumption has increased since the 1960s in most western populations (27), but a recent study in the US showed decreasing trends in SSB consumption between 1999 and 2010 (28). In contrast, SSB consumption in Korea has almost quadru- pled in a recent five-year period (from 45 g/d in 1998 to 158 g/d in 2013), and males in their 20s were the highest consumers (310 g/d) among subgroups. In our study, young adults who consumed SSBs more frequently had significantly lower levels of serum 25(OH)D. Although studies reporting a direct relation- ship between SSB consumption and serum 25(OH)D are scarce, several studies found that SSB consumption was associated with reduced bone mass (27, 29), decreased serum calcium lev- el (30), and increased fracture risk (31). Mechanisms responsi- ble for these associations may be the displacement of milk con- sumption from the diet (32) or the direct effects of components in SSBs, including phosphoric acid (31), fructose (33), or caf- feine (29). For most of these components, the effects are usually attributed to increased urinary calcium loss (27, 30). Earlier studies suggested that increased SSB intake might decrease milk consumption concomitantly (27, 29), but displacement of milk does not fully explain our findings. The relationship be- tween SSB consumption and low serum 25(OH)D remained significant after adjustment for dairy consumption. In addition, frequent SSB consumers in our study tended to consume dairy more frequently, and prior studies reported mixed results in the
relationship between SSB intake and milk or dietary vitamin D intake (11, 34). A link between phosphoric acid, an acidulant in SSBs, and serum 25(OH)D level is plausible. Both the low calci- um-to-phosphorus ratio and the high net acid loads of SSBs can cause increased calcium excretion and reduced serum calcium (27, 30), which may stimulate parathyroid hormone (27) and thus decrease serum 25(OH)D levels. More recently, fructose in SSBs was implicated as a possible cause of reduced calcium bal- ance (33). In animal studies, excessive fructose consumption inhibited intestinal and renal calcium transport and decreased circulating vitamin D levels (35).
We found that young adults who ate breakfast regularly had significantly higher serum 25(OH)D levels. In previous studies, breakfast consumption was associated with greater vitamin D intake in countries where foods are fortified with vitamin D as well as where foods are not fortified (11, 34, 36), although those studies did not measure serum 25(OH)D levels but only dietary vitamin D intake. As the most frequently consumed breakfast food was milk in those countries, greater milk intake likely ex- plains the association between breakfast consumption and vi- tamin D intake (36). Similarly, many Korean young adults had a dairy-cereal pattern for breakfast (37). Breakfast eating is known to be associated with reduced risks of weight gain and metabol- ic syndrome (37). Despite the beneficial effects of breakfast eat- ing, only 42.5% of Korean in their 20s eat breakfast regularly (5-7 days/week), which is the lowest level across all age groups, and the number of young adults who eat breakfast has been de- creasing in recent years (38). These findings are of great con- cern given the potential negative future health consequences.
Vitamin D-containing supplement users in our study had significantly higher 25(OH)D levels than non-users, as found in other studies (3, 15, 21). A meta-analysis suggested that vita- min D supplementation of deficient children and adolescents could result in clinically useful improvements in bone mineral density and content (39). However, the observed association in our study requires a cautious interpretation in its role in pre- venting vitamin D deficiency in the general population be- cause our study was performed only in spring months, and we did not measure any health outcomes such as fracture, cancer, or mortality.
Previous studies found inconsistent results for the associa- tion between socioeconomic status and vitamin D status (11, 40). We found no significant linear trends between sociodemo- graphic factors and serum 25(OH)D levels. This finding is plau- sible given the relatively narrow ranges of age and similar aca- demic attainment of our participants. Another explanation may be that potential associations between sociodemographics and vitamin D status were mediated by lifestyle factors which were adjusted for in our analyses.
This study had several limitations. First, our study population consisted mainly of Korean students at one university, which
may limit the generalizability of our results, but may also reduce the possibility of confounding by age, race, or other demo- graphics. Second, blood samples were collected in spring; thus, it must be taken into account that the serum 25(OH)D levels in the present study is an underestimate of the full-year average.
However, given that the season was the strongest correlate of serum 25(OH)D levels among the Korean population (3), we were able to minimize the possibility of confounding by season.
Third, serum 25(OH)D was measured using the CLIA. Com- pared to the liquid chromatography-tandem mass spectrome- try (LC/MS-MS) method, the CLIA has been reported to under- estimate absolute values of 25(OH)D, despite a high degree of relative concordance between the two methods (21). In addi- tion, our FFQ was limited by the lack of data on portion size, al- though previous reports showed that portion size contributes a relatively small amount of information on variation in dietary intake (26). Lastly, the cross-sectional nature of this study limits a causal inference. Nonetheless, an effect of serum 25(OH)D on lifestyles does not seem plausible, because most individuals were unlikely to be aware of their blood vitamin D levels.
Our study had several strengths. This study used a large pop- ulation of young adults for investigating factors associated with serum vitamin D levels. Serum 25(OH)D levels were directly measured, which is considered the best indicator of vitamin D status in the body. In addition, blood samples were collected during a short period of time (3 weeks) and all assays were per- formed in a single laboratory using the same analytic method, which might reduce possible variability due to seasons and lab- oratories. We obtained information on a broad range of demo- graphic, anthropometric, lifestyle, and dietary variables, there- by providing the opportunity to better adjust for important po- tential confounders in analyses. We found some novel corre- lates of serum 25(OH)D such as underweight, breakfast eating, and consumption of instant noodles or SSBs. Although these findings need to be replicated by prospective studies in other populations, our results imply that widespread unhealthy life- style choices in young adults could have substantial deleterious consequences for health outcomes.
In conclusion, low vitamin D status is highly prevalent in Ko- rean young adults and many potentially modifiable lifestyle and dietary factors are significantly associated with low vitamin D status. Given the importance of vitamin D for optimal bone health and possible extra-skeletal health outcomes, our results indicate low vitamin D status in Korean young adults to be a public health issue. Further studies are warranted on potential mechanisms of the correlates and optimal strategies to improve vitamin D status in this vulnerable subpopulation.
DISCLOSURE
The authors have no conflicts of interest to disclose.
http://jkms.org 1119
http://dx.doi.org/10.3346/jkms.2015.30.8.1110
AUTHOR CONTRIBUTION
Conception and coordination of the study: Joh HK, Cho B. De- sign of ethical issues: Joh HK, Lim CS, Cho B. Acquisition of data: Joh HK, Lim CS. Data review: Joh HK. Statistical analysis:
Joh HK. Manuscript preparation: Joh HK, Lim CS, Cho B. Man- uscript approval: all authors.
ORCID
Hee-Kyung Joh http://orcid.org/0000-0002-7751-2405 Chun Soo Lim http://orcid.org/0000-0001-9123-6542 BeLong Cho http://orcid.org/0000-0001-9558-689X REFERENCES
1. Holick MF. Vitamin D deficiency. N Engl J Med 2007; 357: 266-81.
2. Choi HS, Oh HJ, Choi H, Choi WH, Kim JG, Kim KM, Kim KJ, Rhee Y, Lim SK. Vitamin D insufficiency in Korea--a greater threat to younger generation: the Korea National Health and Nutrition Examination Sur- vey (KNHANES) 2008. J Clin Endocrinol Metab 2011; 96: 643-51.
3. Choi EY. 25(OH)D status and demographic and lifestyle determinants of 25(OH)D among Korean adults. Asia Pac J Clin Nutr 2012; 21: 526-35.
4. Langlois K, Greene-Finestone L, Little J, Hidiroglou N, Whiting S. Vita- min D status of Canadians as measured in the 2007 to 2009 Canadian Health Measures Survey. Health Rep 2010; 21: 47-55.
5. Prentice A. Vitamin D deficiency: a global perspective. Nutr Rev 2008; 66:
S153-64.
6. Han SW, Kim SJ, Lee DJ, Kim KM, Joo NS. The Relationship between Se- rum 25-Hydroxyvitamin D, Parathyroid Hormone and the Glomerular Filtration Rate in Korean Adults: The Korea National Health and Nutri- tion Examination Survey between 2009 and 2011. Korean J Fam Med 2014; 35: 98-106.
7. Bjelakovic G, Gluud LL, Nikolova D, Whitfield K, Krstic G, Wetterslev J, Gluud C. Vitamin D supplementation for prevention of cancer in adults.
Cochrane Database Syst Rev 2014; 6: CD007469.
8. Wang L, Song Y, Manson JE, Pilz S, März W, Michaëlsson K, Lundqvist A, Jassal SK, Barrett-Connor E, Zhang C, et al. Circulating 25-hydroxy-vi- tamin D and risk of cardiovascular disease: a meta-analysis of prospec- tive studies. Circ Cardiovasc Qual Outcomes 2012; 5: 819-29.
9. Hyppönen E, Cavadino A, Williams D, Fraser A, Vereczkey A, Fraser WD, Bánhidy F, Lawlor D, Czeizel AE. Vitamin D and pre-eclampsia: original data, systematic review and meta-analysis. Ann Nutr Metab 2013; 63:
331-40.
10. Bergman P, Lindh AU, Björkhem-Bergman L, Lindh JD. Vitamin D and respiratory tract infections: a systematic review and meta-analysis of randomized controlled trials. PLoS One 2013; 8: e65835.
11. Salamoun MM, Kizirian AS, Tannous RI, Nabulsi MM, Choucair MK, Deeb ME, El-Hajj Fuleihan GA. Low calcium and vitamin D intake in healthy children and adolescents and their correlates. Eur J Clin Nutr 2005; 59: 177-84.
12. Jääskeläinen T, Knekt P, Marniemi J, Sares-Jäske L, Männistö S, He- liövaara M, Järvinen R. Vitamin D status is associated with sociodemo-
graphic factors, lifestyle and metabolic health. Eur J Nutr 2013; 52:
513-25.
13. McCullough ML, Weinstein SJ, Freedman DM, Helzlsouer K, Flanders WD, Koenig K, Kolonel L, Laden F, Le Marchand L, Purdue M, et al. Cor- relates of circulating 25-hydroxyvitamin D: Cohort Consortium Vitamin D Pooling Project of Rarer Cancers. Am J Epidemiol 2010; 172: 21-35.
14. Choi HS. Vitamin d status in Korea. Endocrinol Metab (Seoul) 2013; 28:
12-6.
15. Lee YA, Kim HY, Hong H, Kim JY, Kwon HJ, Shin CH, Yang SW. Risk fac- tors for low vitamin D status in Korean adolescents: the Korea National Health and Nutrition Examination Survey (KNHANES) 2008-2009.
Public Health Nutr 2014; 17: 764-71.
16. World Health Organization Western Pacific Region, International As- sociation for the Study of Obesity, International Obesity Task Force. The Asia-Pacific perspective: redefining obesity and its treatment. Sydney:
Health Communications Australia Pty, 2000.
17. Lee SY, Park HS, Kim DJ, Han JH, Kim SM, Cho GJ, Kim DY, Kwon HS, Kim SR, Lee CB, et al. Appropriate waist circumference cutoff points for central obesity in Korean adults. Diabetes Res Clin Pract 2007; 75: 72-80.
18. International Physical Activity Questionnaire (IPAQ) Research Commit- tee. Guidelines for data processing and analysis of the International Phys- ical Activity Questionnaire (IPAQ)-short and long forms. Available at http://www.academia.edu/5346814/Guidelines_for_Data_Processing_
and_Analysis_of_the_International_Physical_Activity_Questionnaire_
IPAQ_Short_and_Long_Forms_Contents [accessed on June 29, 2015].
19. Yu A, Kim J, Kwon O, Oh SY, Kim J, Yang YJ. The association between se- rum 25-hydroxyvitamin d concentration and consumption frequencies of vitamin d food sources in Korean adolescents. Clin Nutr Res 2013; 2:
107-14.
20. Wei MY, Giovannucci EL. Vitamin D and multiple health outcomes in the Harvard cohorts. Mol Nutr Food Res 2010; 54: 1114-26.
21. Kühn T, Kaaks R, Teucher B, Hirche F, Dierkes J, Weikert C, Katzke V, Boeing H, Stangl GI, Buijsse B. Dietary, lifestyle, and genetic determi- nants of vitamin D status: a cross-sectional analysis from the European Prospective Investigation into Cancer and Nutrition (EPIC)-Germany study. Eur J Nutr 2014; 53: 731-41.
22. van Dam RM, Snijder MB, Dekker JM, Stehouwer CD, Bouter LM, He- ine RJ, Lips P. Potentially modifiable determinants of vitamin D status in an older population in the Netherlands: the Hoorn Study. Am J Clin Nutr 2007; 85: 755-61.
23. Larose TL, Chen Y, Camargo CA Jr, Langhammer A, Romundstad P, Mai XM. Factors associated with vitamin D deficiency in a Norwegian population: the HUNT Study. J Epidemiol Community Health 2014; 68:
165-70.
24. Hintzpeter B, Mensink GB, Thierfelder W, Müller MJ, Scheidt-Nave C.
Vitamin D status and health correlates among German adults. Eur J Clin Nutr 2008; 62: 1079-89.
25. Clements MR, Johnson L, Fraser DR. A new mechanism for induced vi- tamin D deficiency in calcium deprivation. Nature 1987; 325: 62-5.
26. Shin HJ, Cho E, Lee HJ, Fung TT, Rimm E, Rosner B, Manson JE, Whee- lan K, Hu FB. Instant noodle intake and dietary patterns are associated with distinct cardiometabolic risk factors in Korea. J Nutr 2014; 144:
1247-55.
27. Tucker KL, Morita K, Qiao N, Hannan MT, Cupples LA, Kiel DP. Colas, but not other carbonated beverages, are associated with low bone min-
eral density in older women: The Framingham Osteoporosis Study. Am J Clin Nutr 2006; 84: 936-42.
28. Kit BK, Fakhouri TH, Park S, Nielsen SJ, Ogden CL. Trends in sugar- sweetened beverage consumption among youth and adults in the United States: 1999-2010. Am J Clin Nutr 2013; 98: 180-8.
29. McGartland C, Robson PJ, Murray L, Cran G, Savage MJ, Watkins D, Rooney M, Boreham C. Carbonated soft drink consumption and bone mineral density in adolescence: the Northern Ireland Young Hearts proj- ect. J Bone Miner Res 2003; 18: 1563-9.
30. Mahmood M, Saleh A, Al-Alawi F, Ahmed F. Health effects of soda drink- ing in adolescent girls in the United Arab Emirates. J Crit Care 2008; 23:
434-40.
31. Wyshak G. Teenaged girls, carbonated beverage consumption, and bone fractures. Arch Pediatr Adolesc Med 2000; 154: 610-3.
32. Harnack L, Stang J, Story M. Soft drink consumption among US children and adolescents: nutritional consequences. J Am Diet Assoc 1999; 99:
436-41.
33. Milne DB, Nielsen FH. The interaction between dietary fructose and magnesium adversely affects macromineral homeostasis in men. J Am Coll Nutr 2000; 19: 31-7.
34. Peters BS, Verly E Jr, Marchioni DM, Fisberg M, Martini LA. The influ- ence of breakfast and dairy products on dietary calcium and vitamin D intake in postpubertal adolescents and young adults. J Hum Nutr Diet
2012; 25: 69-74.
35. Douard V, Patel C, Lee J, Tharabenjasin P, Williams E, Fritton JC, Sab- bagh Y, Ferraris RP. Chronic high fructose intake reduces serum 1,25 (OH)2D3 levels in calcium-sufficient rodents. PLoS One 2014; 9: e93611.
36. Hill KM, Jonnalagadda SS, Albertson AM, Joshi NA, Weaver CM. Top food sources contributing to vitamin D intake and the association of ready-to-eat cereal and breakfast consumption habits to vitamin D in- take in Canadians and United States Americans. J Food Sci 2012; 77:
H170-5.
37. Yoo KB, Suh HJ, Lee M, Kim JH, Kwon JA, Park EC. Breakfast eating pat- terns and the metabolic syndrome: the Korea National Health and Nutri- tion Examination Survey (KNHANES) 2007-2009. Asia Pac J Clin Nutr 2014; 23: 128-37.
38. Korea Ministry of Health and Welfare, Korea Centers For Disease Con- trol and Prevention. Korea Health Statistics 2013: Korea National Health and Nutrition Examination Survey (KNHANESVI-1). Cheongwon Korea Centers for Disease Control and Prevention, 2014.
39. Winzenberg T, Powell S, Shaw KA, Jones G. Effects of vitamin D supple- mentation on bone density in healthy children: systematic review and meta-analysis. BMJ 2011; 342: c7254.
40. Hirani V, Mosdøl A, Mishra G. Predictors of 25-hydroxyvitamin D status among adults in two British national surveys. Br J Nutr 2009; 101: 760-4.
![Table 1. Characteristics of 3,450 Korean university students and unadjusted mean serum 25-hydroxyvitamin D [25(OH)D] levels by lifestyle, dietary, and sociodemographic factors](https://thumb-ap.123doks.com/thumbv2/123dokinfo/5137752.92452/4.892.72.823.126.1004/characteristics-university-students-unadjusted-hydroxyvitamin-lifestyle-dietary-sociodemographic.webp)
![Fig. 2. Multivariable-adjusted mean serum 25-hydroxyvitamin D [25(OH)D] levels by sex and lifestyle factors (A-F)](https://thumb-ap.123doks.com/thumbv2/123dokinfo/5137752.92452/6.892.77.821.98.467/fig-multivariable-adjusted-serum-hydroxyvitamin-levels-lifestyle-factors.webp)
![Fig. 3. Multivariable-adjusted mean serum 25-hydroxyvitamin D [25(OH)D] levels by dietary factors (A-H)](https://thumb-ap.123doks.com/thumbv2/123dokinfo/5137752.92452/7.892.71.817.110.679/fig-multivariable-adjusted-serum-hydroxyvitamin-levels-dietary-factors.webp)
