저작자표시-비영리-변경금지 2.0 대한민국 이용자는 아래의 조건을 따르는 경우에 한하여 자유롭게 l 이 저작물을 복제, 배포, 전송, 전시, 공연 및 방송할 수 있습니다. 다음과 같은 조건을 따라야 합니다: l 귀하는, 이 저작물의 재이용이나 배포의 경우, 이 저작물에 적용된 이용허락조건 을 명확하게 나타내어야 합니다. l 저작권자로부터 별도의 허가를 받으면 이러한 조건들은 적용되지 않습니다. 저작권법에 따른 이용자의 권리는 위의 내용에 의하여 영향을 받지 않습니다. 이것은 이용허락규약(Legal Code)을 이해하기 쉽게 요약한 것입니다. Disclaimer 저작자표시. 귀하는 원저작자를 표시하여야 합니다. 비영리. 귀하는 이 저작물을 영리 목적으로 이용할 수 없습니다. 변경금지. 귀하는 이 저작물을 개작, 변형 또는 가공할 수 없습니다.
A study on the reduction of structure-borne noise in
hydraulic power unit with elastic mounting
본 논문을 박성용의 공학석사 학위논문으로 인준함.
년
월
일
2017
07
03
List of Tables ··· iv List of Figures ··· vi Abstract ··· vii 1. ··· 1 1.1 ··· 1 1.2 ··· 2 2. ··· 3 2.1 ··· 3 2.2 ··· 5 2.3 ··· 12 2.4 ··· 14 3. ··· 19 3.1 ··· 19 3.2 ··· 24 3.3 ··· 26 3.4 1 ··· 37 3.5 2 ··· 48 3.6 ··· 55 4. ··· 56 4.1 ··· 56 4.2 ··· 59
5. ··· 63
List of Tables
Table 1 Classification of equipment ··· 4
Table 2 Specification of acceleration measurement device ··· 6
Table 3 Specification of hydraulic power unit ··· 8
Table 4 Measurement result of major frequencies ··· 18
Table 5 Material property ··· 24
Table 6 Natural frequency of spring-mass model ··· 25
Table 7 Comparison of major frequency(Initial model) ··· 27
Table 8 Result of modal frequency(Frist reinforcement model) ··· 38
List of Figures
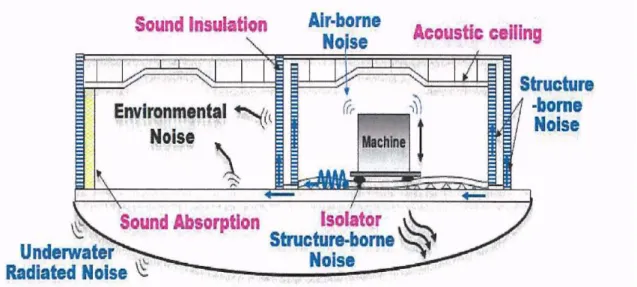
Fig. 1 Avenue of path of underwater radiation noise ··· 2
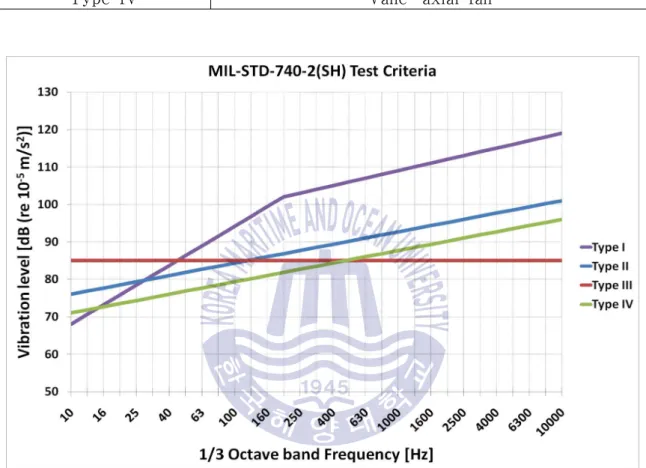
Fig. 2 Test criteria of structure-borne noise ··· 4
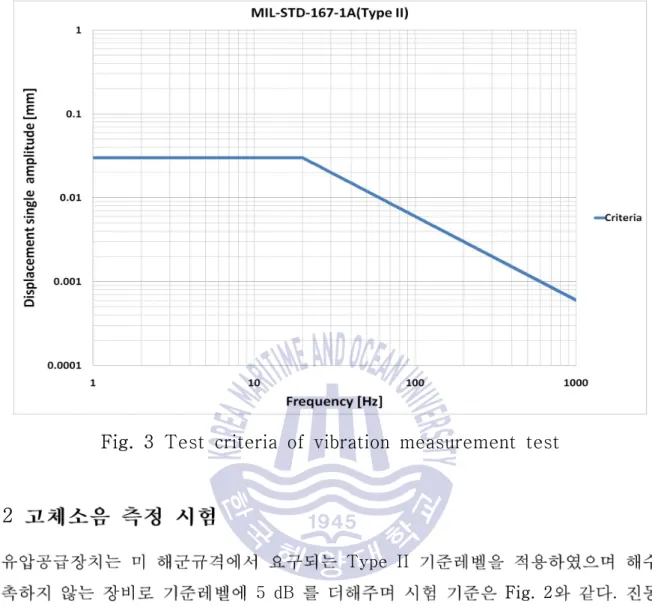
Fig. 3 Test criteria of vibration measurement test ··· 5
Fig. 4 Nine measuring positions ··· 6
Fig. 5 Installation of hydraulic power unit ··· 7
Fig. 6 Measurement result of structure-borne noise(1/3 octave band) ·· 12
Fig. 7 Measurement result of motor bearing housing ··· 13
Fig. 8 Measuring position of motor bearing housing ··· 13
Fig. 9 Measurement result of structure-borne noise(narrow band) ··· 17
Fig. 10 FE modeling and mesh(Initial model) ··· 26
Fig. 11 Mode shape of modal analysis(Initial model) ··· 30
Fig. 12 Result of harmonic analysis(Initial model) ··· 33
Fig. 13 Total deformation by harmonic analysis(Initial model) ··· 36
Fig. 14 FE modeling and mesh(Frist reinforcement model) ··· 37
Fig. 15 Result of harmonic analysis(Frist reinforcement model) ··· 42
Fig. 16 Total deformation by harmonic analysis(Frist reinforcement model) ···· 47
Fig. 17 FE modeling and mesh(Second reinforcement model) ··· 48
Fig. 18 Result of harmonic analysis(Second reinforcement model) ··· 52
Fig. 21 Measurement result of structure-borne noise(1/3 octave band) ·· 59 Fig. 22 Measurement result of structure-borne noise(narrow band) ··· 62
A study on the reduction of structure-borne noise in
hydraulic power unit with elastic mounting
Park, Sung Yong
Department of Mechanical Systems Engineering
Graduate School of Korea Maritime and Ocean University
Abstract
In the case of the naval vessel equipment, air-borne noise and structure-borne noise generated from the equipment are ultimately transmitted to the hull, propagated in the water, and the possibility of being exposed to the enemy is increased, and the survival of the naval
vessel is also directly connected. These air-borne noise and
structure-borne noise are also very important factors from the
viewpoint of crew members' comfort. Air-borne noise and
structure-borne noise are strictly managed based on the standards of the US Navy, and the requirement for low vibration and noise is recognized as basic quality that equipment for a naval vessel must have, and research and improvements are being made.
In this study, the cause of excessive vibration due to the rotational motion of the motor and the reciprocating motion of the hydraulic pump in the hydraulic power unit was analyzed through the structure-borne
KEY WORDS : Structure-borne noise ; Air-borne noise
; Hydraulic power unit , naval vessel equipment
, Reduction .
noise test.
The study on the reduction of the structure-borne noise of the hydraulic power unit through the design change of the hydraulic tank was examined.
Modal analysis was performed by generating a finite element model of a hydraulic tank for frequency avoidance that exhibited a high acceleration level in the structure-borne noise evaluation and harmonic analysis was
performed to verify the validity of the structure-borne noise.
Verification of the improved shape was confirmed by confirming that the acceleration level of the frequency was reduced.
Finally, it is confirmed that the finite element analysis is effective to
reduce the structure-borne noise in the final test evaluation by
1
1.1
. . Fig. 1 , . , .[1] , . , , / .[2] . , , , , , , , .1.2
. . , , , , . , , . , , .[4] , .2
2.1
MIL-STD-740-1(SH), MIL-STD-740-2(SH) . . ( ) . MIL-STD-167-1A:2005(Type II) , . 2.1.1 (MIL-STD-740-2(SH):1986)Table 1 Type I~IV , Type II 5 dB . Fig. 2 1/3 10 Hz 10000 Hz . 11 Hz 1/4 . , . . . 15 dB .[3]
Type Equipment
Type I Compressor, internal combustion engines Type II Pump, valve, life support equipment Type III Other than type I & 2
Type IV Vane-axial fan
Table 1 Classification of equipment
Fig. 2 Test criteria of structure-borne noise
2.1.2 (MIL-STD-167-1A:2005)
, , ,
. 1 Hz 1 Hz 1000 Hz , Fig. 3 (Displacement single amplitude) , .
Fig. 3 Test criteria of vibration measurement test
2.2
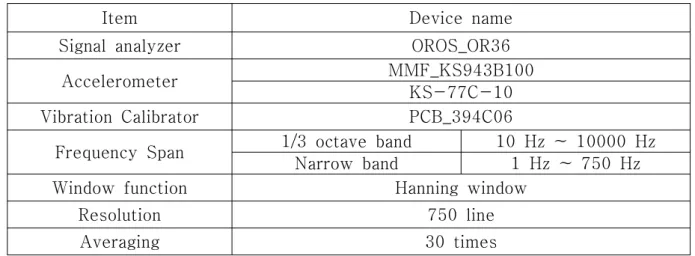
Type II 5 dB Fig. 2 . Fig. 4 , Fig. 5 . 2.2.1 1/3 Octave band 10 Hz 10000 Hz , Narrow band 1 Hz 750 Hz , Hanning 1 Hz . Table 2 .Item Device name Signal analyzer OROS_OR36
Accelerometer MMF_KS943B100 KS-77C-10 Vibration Calibrator PCB_394C06
Frequency Span 1/3 octave band 10 Hz ~ 10000 Hz Narrow band 1 Hz ~ 750 Hz Window function Hanning window
Resolution 750 line Averaging 30 times
Table 2 Specification of acceleration measurement device
2.2.2
Fig. 4 ,
9 , 24
MPa(240 bar), 1170 rpm Table 3 .
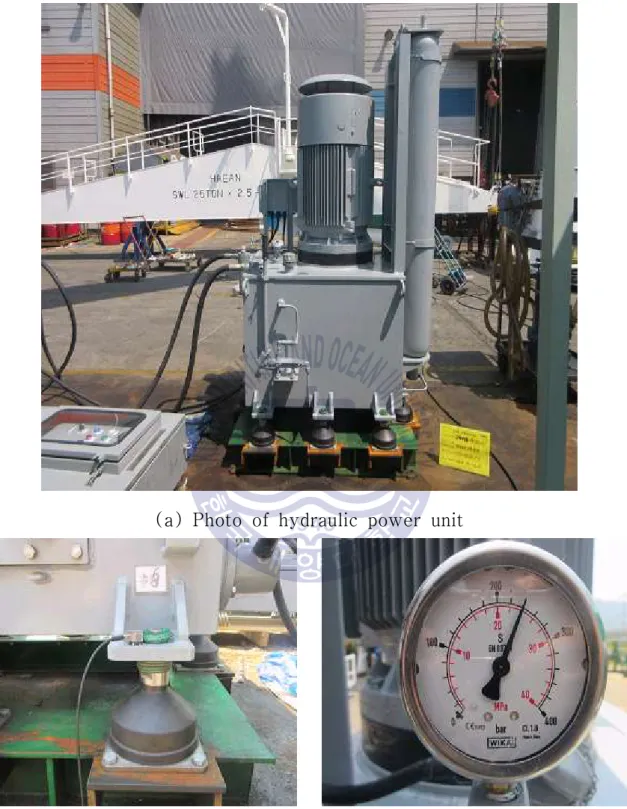
(a) Photo of hydraulic power unit
(b) Measuring position (c) Pressure meter
2.2.3 . 1170 rpm , 19.5 Hz . (1) 9 175.5 Hz . × (2)
Table 3 Specifications of hydraulic power unit
1. Model Hydraulic power unit
2. Size (W) 1500 mm × (L) 1130 mm × (H) 1866 mm 3. Mass 1400 kg
4. Supply AC 440 V, 60 Hz, 3 P 5. Working pressure 24 MPa (240 bar)
6. Motor
Revolutions : 1170 rpm Power : 45 kW
Mass : 450 kg
7. Pump
Type : piston pump
Installed number of piston : 9 EA Revolutions : 1170 rpm
Mass : 31.8 kg 8. Mount Installed number : 9 EA
2.2.4 , 1 9 . (a) Point 1 (b) Point 2
(c) Point 3
(d) Point 4
(f) Point 6
(g) Point 7
2.3
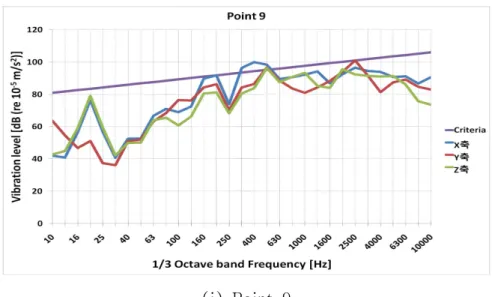
, MIL-STD-167-1A :2005(Type II) , . 2.3.1 1 Hz 1000 Hz , Hanning 1 Hz . Table 2 , Fig. 3 . 2.3.2 MIL-STD-167-1A:2005 . Fig. 7 , . , . (i) Point 9Fig. 8 Measurement position of motor bearing housing Fig. 7 Measurement result of motor bearing housing
2.4
2.4.1 ,,
, , , . , , . 2.4.2 9 , Fig. 6 160 Hz 10000 Hz . , 10 Hz ~ 750 Hz , 1 Hz Narrowband Fig. 9 . Table
4 . , , . Narrow band 20 Hz 1X , 5 180 Hz, 339 Hz, 360 Hz, 539 Hz, 719 Hz . 180 Hz, 360 Hz, 539 Hz, 719 Hz 9 , .
(a) Point 1
(b) Point 2
(d) Point 4
(e) Point 5
(g) Point 7
(h) Point 8
(i) Point 9
Direction Major frequency (Hz) Point 1 X axis 20 180 - 359 539 719 Y axis 20 180 - 359 - 719 Z axis 20 180 - 359 539 -Point 2 X axis 20 180 339 359 539 719 Y axis 20 180 - 359 - -Z axis 20 180 339 359 539 719 Point 3 X axis 20 180 - 359 - 719 Y axis 20 180 - - - -Z axis 20 180 - 359 539 719 Point 4 X axis 20 180 339 359 - -Y axis 20 180 - 359 539 719 Z axis 20 180 - 359 539 719 Point 5 X axis 20 180 339 359 - -Y axis 20 180 339 359 539 719 Z axis 20 180 339 359 539 719 Point 6 X axis 20 180 339 - 539 -Y axis 20 180 - 359 - -Z axis 20 180 - 359 539 -Point 7 X axis 20 180 339 359 - -Y axis 20 - - 359 - -Z axis 20 180 339 359 539 719 Point 8 X axis 20 180 - - - -Y axis 20 - - 359 - 719 Z axis 20 180 - 359 539 -Point 9 X axis 20 180 - 359 539 719 Y axis 20 180 - 359 - -Z axis 20 180 - 359 539 719
3.
Narrow band , . UG NX 5.0 , ANSYS Workbench 12.1 , .3.1
. . . . .3.1.1
.
. (multi degree-of-freedom system) .
(1), , (mass matrix), (damping matrix), (stiffness matrix) ,
,
, , , , , . (1) (2) .
(2) , . (3) , (2) (4) . sin (3)
(4) (4) 0det
(5) (5) , ⋯ , (natural frequency) . , (6) .
⋯
(6) 3.1.2 . .
Ω (7) , , , , .
, Ω . . (7) .
sin
(8) , ,
. , ,
. (8) (7) , Ω Ω
(9)
Ω Ω
(10) (10) , i . (8)
(11) , (9)
(12) (13) . (14), (15) . (14) (15) (dynamic stiffness) . (13) (16) (16) . (12)
(17) (17) . (16) . . , k k .
(18) tan (19) , . .3.2
3.2.1
3 , (Initial model)
, 1 (Frist reinforcement
model) 2
, 2 (Second reinforcement model) 4
3 .
,
, ,
Table 5 .
Table 5 Material property
Item Value SS400 Density (kg/m3) 7860 Poisson's ratio 0.26 Spring Stiffness (N/mm) vertical 285 horizontal 313.5 Damping 0.05 Motor Mass (kg) 450 Pump Mass (kg) 31.8 Accumulator Mass (kg) 200
3.2.2 5 N X , Y , Z , 5N 1X 20 Hz 10 Hz 750 Hz 10 Hz 1 9 3 (m/s2) . 3.2.3 (natural frequency) , Table 6 . 3 .
(20)Table 6 Natural frequency of spring-mass model
Model Value of result (Hz)
Natural frequency of Spring-mass model
X axis Y axis Z axis
7.1 7.1 6.8 FE model modal frequency Initial model Frist reinforcement model Second reinforcement model 7.5 7.4 7.3
3.3
3.3.1 . Fig. 10 3D . (a) Modeling (b) meshTable 7 Comparison of major frequency(Initial model) 3.3.2 Table 7 . 6 , , , , .
Major frequency of test model Frequency of FE model
No Frequency (Hz) No Frequency (Hz) 1 180 1 179.7 2 339 2 336.0 3 359 3 357.3 4 361.3 4 539 5 550.0 5 719 6 723.7 (a) 179.7 Hz
(b) 336.0 Hz
(d) 361.3 Hz
3.3.3 3.2.2 Fig. 12, Fig. 13 , 380 Hz, 550 Hz, 598 Hz, 689 Hz, 732 Hz, 738 Hz . (300 Hz ~ 500 Hz) , 4 380 Hz , 4, 5 . 550 Hz , 598 Hz, 689 Hz, 732 Hz, 738 Hz . (f) 723.7 Hz
(a) Point 1
(b) Point 2
(d) Point 4
(e) Point 5
(g) Point 7
(h) Point 8
(i) Point 9
(a) Point 2, 4, 5, 9 (380 Hz)
(c) Point 1, 7 (598 Hz)
(e) Point 1, 4, 5, 6, 7, 8, 9 (732 Hz)
(f) Point 1, 4, 5, 6, 7, 8, 9 (738 Hz)
3.4 1
3.4.1 Fig 14 1 3D , 10 mm , , , . (a) modeling (b) meshTable 8 Result of modal frequency(Frist reinforcement model) No Frequency (Hz) No Frequency (Hz) 1 4.1 15 265.3 2 4.3 16 279.9 3 7.4 17 298.0 4 11.3 18 299.9 5 13.7 19 304.3 6 17.3 20 310.9 7 46.8 21 313.2 8 79.5 22 325.0 9 114.0 23 338.8 10 152.5 24 347.8 11 156.7 25 374.1 12 177.1 26 385.4 13 186.2 27 391.0 14 233.1 28 458.0 29 464.4 44 592.8 30 468.0 45 598.8 31 477.3 46 613.7 32 477.7 47 627.5 33 484.4 48 645.1 34 500.6 49 652.5 35 505.7 50 655.7 36 514.1 51 675.5 37 516.7 52 680.4 38 523.7 53 688.1 39 533.7 54 710.8 40 549.6 55 723.3 41 556.9 56 726.6 42 572.5 57 744.8 43 583.6 3.4.2 Table 8 1 . 6 1 5 .
3.4.3 3.2.2 Fig. 15, Fig. 16 , 280 Hz, 298 Hz, 299 Hz, 300 Hz, 593 Hz, 599 Hz, 614 Hz, 711 Hz . , . 1 9 280 Hz, 298 Hz, 299 Hz, 300 Hz , , , . 593 Hz, 599 Hz, 614 Hz 380 Hz 4 1 593 Hz 599 Hz, 614 Hz . 711 Hz . (a) Point 1
(b) Point 2
(c) Point 3
(e) Point 5
(f) Point 6
(h) Point 8
(i) Point 9
(a) Point 1~9 (280 Hz)
(c) Point 2, 7 (299 Hz)
(e) Point 1, 2, 3, 7 (593 Hz)
(g) Point 4, 6, 7 (614 Hz)
(i) Point 2, 5, 7 (727 Hz)
3.5 2
3.5.1 Fig 17 3D , 1 10 mm , , , . (a) modeling (b) meshTable 9 Result of modal frequency(Second reinforcement model) No Frequency (Hz) No Frequency (Hz) 1 4.1 20 463.3 2 4.2 21 474.3 3 7.3 22 477.8 4 11.2 23 506.8 5 13.5 24 523.0 6 16.8 25 523.6 7 58.2 26 543.2 8 98.1 27 562.6 9 152.1 28 573.3 10 238.6 29 587.2 11 272.8 30 597.7 12 278.0 31 610.9 13 329.4 32 625.7 14 333.1 33 653.3 15 385.6 34 680.5 16 399.1 35 702.2 17 412.1 36 724.0 18 442.5 37 730.1 19 450.0 38 744.6 3.5.2 Table 9 . 1 5 4 . 3.5.3 3.2.2 Fig. 18, Fig. 19 , 330 Hz, 562 Hz, 702 Hz, 724 Hz 1 . 1 280 Hz, 298 Hz, 299 Hz, 300 Hz 2 , 599 Hz 614 Hz .
(a) Point 1
(b) Point 2
(d) Point 4
(e) Point 5
(g) Point 7
(h) Point 8
(i) Point 9
(a) Point 2, 6, 7, 8, 9 (330 Hz)
(c) Point 4, 5, 9 (702 Hz)
(d) Point 3, 4, 5, 7, 9 (724 Hz)
3.6
Fig. 20 3 . 1 9 , . . , . , . . , , .(a) Initial model (b) Reinforcement model (c) Final model
4.
.4.1
Fig. 21 , 1 9 . (a) Point 1(b) Point 2
(c) Point 3
(e) Point 5
(f) Point 6
4.2
Fig. 22 Narrow band
180 Hz, 339 Hz, 360 Hz, 539 Hz, 719 Hz ,
. (h) Point 8
(i) Point 9
(a) Point 1
(b) Point 2
(d) Point 4
(e) Point 5
(g) Point 7
(h) Point 8
(i) Point 9
5.
, . . 1. 5 180 Hz, 339 Hz, 360 Hz, 539 Hz, 719 Hz , 20 Hz 1 , 180 Hz, 360 Hz, 539 Hz, 719 Hz 9 , . 2. , . 3. . 1 , .[1] , 2015.02, “ ”, , 50 , 25-36, pp.11. [2] , 2013.04, “ ”, , 23 , 2 , 12-15, pp.4. [3] , 2006.06, “ ”, , 16 , 3 , 10-15, pp.6. [4] , 2000, “ ”, .
[5] MIL-STD-740-2(SH), 1986, "Structure-borne Vibratory Acceleration Measurements and Acceptance Criteria of Shipboard Equipment."
[6] MIL-STD-167-1A, 2005, "Department of efense test method standar d Mechanical vibrations of shipboard equipment."
[7] , 2012, “Linear
”, .
[8] , , 1999, , .
[9] , , , 2006, · .
[10] Singiresu S. Rao, 2012, Mechanical Vibrations 5th edition in SI unit, PEARSON.
[11] , 2016, “
", .
[12] Qi Dalong, 2015, "A study on the vibration analysis of Marine Pump", Pukyong National University, Thesis for the Degree of Master of Engineering.
[13] MIL-STD-740-1(SH), 1986, "Air-borne sound Measurements and Acceptance Criteria of Shipboard Equipment."
[14] ANSYS Inc., "Workbench Basic", Version 15.0
[15] , 2003, , .