1. INTRODUCTION
In the cold rolling mill, Coil breakage that generated in rolling process makes the various types of troubles such as the degradation of productivity and the damage of equipment. Recent researches were done by the mechanical analysis such as the analysis of roll chattering or strip inclining and the prevention of breakage that detects the crack of coil. If examined one example in detail, the system to monitor coil breakage as measuring the vibration of cold rolling mill was developed. But they could predict some breakages that occurred in the cause such as equipment malfunction. We need to trace breakage cause in various methods so that we can propose the cause and solution of coil breakage.
The work carried out on a collaborative ECSC project which aimed to develop a quality prediction forecasting method for both surface quality and internal quality of the as case semi. They used various techniques that include mathematical model, artificial neural network and other data based method using fuzzy logic and statistical techniques [1]. Such as this case, the complex problem solving techniques is using widespread as the solution of complex problem
The prediction of Coil breakage was very complicated and occurred rarely. We propose to build effective prediction modes for coil breakage in rolling process, based on data mining model.
We proposed three prediction model for coil breakage : (1) decision tree based model, (2) regression based model and (3) neural network based model. Our training data set given to us has a severe umblanced nature and we could not propose
proper prediction models. To reduce model parameters, we selected important variables related to the occurrence of coil breakage from the attributes of coil setup by using the methods such as decision tree, variable selection and the choice of domain experts. We developed these prection models and chose the best model among them using SEMMA process that proposed in SAS E-miner environment. We estimated model accuracy by scoring the prediction model with the posterior probability. We also have developed a software tool to analyze the data and generate the proposed prediction models either automatically and in a user-driven manner. It also has an effective visualization feature that is based on PCA(Principle Component Analysis).
Development of Coil Breakage Prediction Model In Cold Rolling Mill
Yeong-bok Park*, and Hwa-won Hwang
*** Instrumentation Research Group Technical Lab., POSCO
(Tel : +82-54-220-6310; E -maill : [email protected]) ** Instrumentation Research Group Technical Lab., POSCO
(Tel : +82-54-220-6307; E -maill : [email protected])
Abstract: In the cold rolling mill, coil breakage that generated in rolling process makes the various types of troubles such as the degradation of productivity and the damage of equipment. Recent researches were done by the mechanical analysis such as the analysis of roll chattering or strip inclining and the prevention of breakage that detects the crack of coil. But they could cover some kind of breakages. The prediction of Coil breakage was very complicated and occurred rarely. We propose to build effective prediction modes for coil breakage in rolling process, based on data mining model.
We proposed three prediction models for coil breakage: (1) decision tree based model, (2) regression based model and (3) neural network based model. To reduce model parameters, we selected important variables related to the occurrence of coil breakage from the attributes of coil setup by using the methods such as decision tree, variable selection and the choice of domain experts. We developed these prediction models and chose the best model among them using SEMMA process that proposed in SAS E-miner environment. We estimated model accuracy by scoring the prediction model with the posterior probability. We also have developed a software tool to analyze the data and generate the proposed prediction models either automatically and in a user-driven manner. It also has an effective visualization feature that is based on PCA (Principle Component Analysis).
.
Keywords: At least four keywords separated by commas
2. DATA MINING
This section provides a more detailed description of SAS E-miner and imbalanced data sets.
2.1 SAS E-miner
Enterprise Miner, SAS institute’s enhanced data mining S/W, offers an integrated environment for business that want to conduct comprehensive data mining. E-miner combines a rich suite of integrated data mining tools, empowering users to explore and exploit huge data bases for strategic business advantages. In a single environment, E-miner provides all the tools necessary to match robust data mining techniques to specific business problems, regardless of the amount oral source of the source of data or complexity of the business problem.
Beginning with a statistically representative sample of the
ICCAS2005 June 2-5, KINTEX, Gyeonggi-Do, Korea
ICCAS2005 June 2-5, KINTEX, Gyeonggi-Do, Korea
data, SEMMA makes it easy to apply exploratory statically and visualization techniques, select and transform the most significant predictive variables, model the variables to predict outcomes and confirm the accuracy of a model. [4]
Sample the data by extracting a portion of a data set large enough to contain the significant information, yet small enough to manipulate quickly
Explore the data by searching for unanticipated trends and anomalies in order to gain understanding and ideas Modify the data by creating, selection, and transforming
the variables to focus the model selection process. Model the data by allowing the software to search
automatically for a combination of data that reliably predicts a desired outcome.
Assess the data by evaluating the usefulness and reliability of the finding from the data mining process 2.2 Imbalanced Data Problem.
Most learning systems usually assume that training sets used for learning are balanced. However, this is not always the case in real world data where one class might be represented by a large number of examples, while the other is represented by only a few. This is known as the class imbalance problem and is often reported as an obstacle to the induction of good classifiers by Machine Learning (ML) algorithms. Generally, the problem of imbalanced data sets occurs when one class represents a circumscribed concept, while the other class represents the counterpart of that concept, so that examples from the counterpart class heavily outnumber examples from
the class of interest. This sort of data is found, for example, in medical record databases regarding a rare disease, were there is a large number of patients who do not have that disease; continuous fault-monitoring tasks where non-faulty examples heavily outnumber faulty examples, and others.[2]
3. PROCESS AND DATA
POSCO have been developing PDS (Process Data Server) in many works for assisting the activity of quality improvement to analyze product micro quality and improve the degree of control system. It is web based data base system that includes the setup and actual data of products as well as the micro data of quality and control. It is used to analyze and compare the data through micro data trend graph and supports the download of the data for statistical analysis through tools such as Minitab and SAS.
The data related to building coil prediction data mining model was supported through coil rolling mil PDS system. At first, the various parameters that affect the coil breakage were first identified and extract from the data base. Cold rolling mill PDS system includes various data related to the production of cold rolled strip. These data are following
Work order information : Hot Coil No, Cold Coil No, Hot Coil Target No etc
Setup Information : thickness, speed, unit tension, total tension
Actual Information : same item as setup information Product Coil Information: diff of thickness, Edge drop
thick etc.
Data cleansing is aimed to improve accuracy of the model through improving the integrity and quality of raw input data in the data mining modeling procedure. As a result of
exploring the raw input data to be exported from PDS system, because the data was collected systematically and verified in PDS system, there were no needs to cleanse the data.
4. MODELING
We used more than more 250 variables to predict the occurrence of coil breakage based on coil setup data. As see previously, the breakage occurrence data is imbalanced data set that the number of occurrence is only forty among more 30000 data sets. We constructed the data mart for prediction mining model using random sampling method that let the breakage data and the normal data to be 99 times to be included. The data set was portioned into three parts for training, validating and testing the mining model as 60:20:20 ratios.
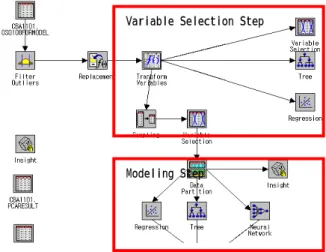
In fig 1, we present the flow diagram of coil breakage prediction model using SAS E-miner. The modeling flow diagram was consisted of two stages. We could reduce the model input variables and build more accurate model in variable selection step. Based on these variables, we could build various breakout prediction mining model such as decision tree, regression and neural networks algorithm and choose the most accurate model among them by assessing the accuracy of these model.
Modeling Step
Variable Selection Step
Fig. 1 The flow diagram of Coil Breakage Prediction data mining model.
4.1 Variable Selection
Data mining data bases have hundreds of potential model inputs that can be used to predict the target variables. In variable selection step, we can reduce the number of input parameter by setting the status of input variables that are not related to the target as rejected. We used three methods to select the candidate input variable: variable selection, decision tree, regression. .
In variable selection node, we could quickly identify input variables which was useful for predicting target variables using R-square selection criterion. We selected nine important variables in this node.
In same ways, we could extract each four and three candidate variables from the setup variables through tree node and regression node.
The variable CR_VAR3 and CR_VAR4 that have multiple choices among the extracted variables using three methods was selected as model input variables.
ICCAS2005 June 2-5, KINTEX, Gyeonggi-Do, Korea
We represent the candidate input variables and the final input variables to be selected in variable selection step.
Table. 1 the candidate input variables and the final input variables to be selected in variable selection step. 4.2 Modeling
Tree node enables me to create decision tree model that predict the occurrence of coil breakage.
Fig. 2 Classification Result
Tree diagram displays node statistics, the name of variables used to split the data into nodes, and the variable values for several levels of nodes in the tree. In the right child node of the root node, target variable TARGET 1 indicated that this coil occurred coil breakage and Target 0 indicated that this coil was finished normally. In this node, if CR_VAR1 was greater than 10562, the probability of coil breakage occurrence was 47.2 and, 45.5% in the training data and the validation data. In training data set, supposing threshold is 0.4, the model can classify 8 coil breakage data among 14 breakage data. And supposing threshold value is 0.1, the model can classify 11 breakage data correctly. The result was shown in Fig 2.
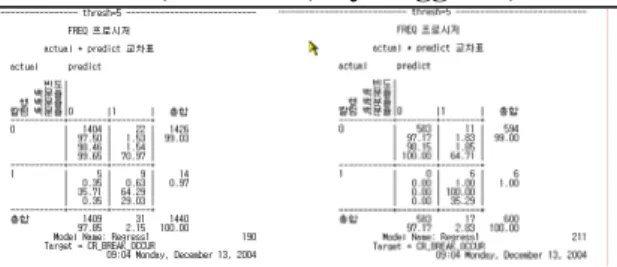
In regression model, the result of breakage classification in the training data, the validation data and test data was following. Variable Variable Selection Decision Tree Regression Final Selection CR_Var1 CR_Var2 CR_Var3 CR_Var4 CR_Var5 CR_Var6 CR_Var7 CR_Var8 CR_Var9 CR_Var10 CR_Var11 CR_Var12 CR_Var13
Fig. 3 Classification Result in Decision Tree
In training data set, the model classified 9 coil breakage data among 14 breakage data and misclassified 22 normal coil data into breakage data among the 600 data sets, we could treat it as safe model. (the prediction accuracy of normal coil data : 97%, the prediction accuracy of breakage coil data : 64.3 % )
In validation data set, as looking for the result that the model classified 6 coil breakage data exactly and misclassified 11 normal coil data into breakage data among the 600 data sets, we could verified it as well developed model.
In test data set, as looking for the result that the model classified 6 coil breakage data exactly and misclassified 4 normal coil data into breakage data among the 360 data sets, we could treat it as safe model.
The results are shown in fig 3. 4.3 Pilot Test
After deciding on a model, we needed to use your model to score new or existing observations. The Score node could be used to evaluate, save, and combine scoring code from different models. This method is to calculate the posterior probability of target variable for new observations without target value by statistical model.
We extracted another pilot test data set from this 38000 sample data sets using random sampling method. The sampling ratio of the normal data to breakage data was 99: 1. We calculated the posterior probability of target variable for new observations using the developed mining model.
Fig.4. the coil breakout warning model tool.
As we decided the threshold value as 0.125, the accuracy of the new observations was (16+1956)/2000 = 0.986 when the target probability was calculated. The results were shown in fig 4.
5. WARNING MODEL TOOL
We developed the coil breakage warning modeling tool that could evaluate the possibility of coil breakage occurrence from new coil setup values. It was implemented using visual c++ 6.0 in windows 2000 environment.
Coil breakage warning modeling tool has the following functions.
ICCAS2005 June 2-5, KINTEX, Gyeonggi-Do, Korea
Can display and modify the area information that was set up by user.
We believe our proposed methods are highly effective with high accuracy and can be used in the real process to reduce the number of breakage of rolled steel plates and, therefore, save the costs to recover from troubles.
Can display graphic data that was transformed to two dimensional data by PCA.
Display the color map of breakage warning code that indicates the cause of breakage.
If allowed, we wish to further investigate the problem and (1) enhance the performance of the proposed methods, (2) extend them to a wider area of applications, and (3) develop an integrated software package that is highly user-friendly to embrace those who are not experts in data mining.
Can displays information of the area that was set up by user and distribution of the breakage data.
Shows the warning results that include warning label code, KNN-prediction and warning level.
The abstract flow of the coil breakout prediction warning
algorithm that is used in the tool is following.
REFERENCES
[1]
A. S Normanton, B Barber, A Bel,
“Development In Online Surface and Internal
Quality Forecasting of Continuously Casting
Semis,”.
1. Generate scatter plots from coil setup values using PCA and set the warning area according to the warning codes in the display area.
2. Apply the test data to the warning model and determine the warning level and inform the information to operator.
[2] Gustavo E. A. P. A. Batista, Ronaldo C. Prati, Maria Carolina Monard “A Study of the Behavior of Several Methods for Balancing Machine Learning Training Data”
Calculate PCA score value from the new setup value. Estimate adjacency degree with the breakout data
using K-NN ( K nearest neighbor )
If it is included in warning region, determine it to
warning level 1. [3] George Fernadez, “Data Mining Using SAS Application” CHAPMAN& HALL/CRC, 2003.
If k1/k < C0 in K-NN search, determine it to warning level 2.
3. If coil breakout occurs in the test data, update the warning region and warning model.
[4] Enterprise Miner Reference Help
Warning step Warning
code
K-NN predict
Fig.4. the coil breakout warning model tool.
In Fig 4, we marked the monitoring area according to the breakage occurrence cause by different color shape in the coordinate. From the test data set, we calculated the PCA score of the data and determined whether the result was included in the warning area to be marked in previous stage. Depending on whether it was the warning area or the K-NN area of the breakout data, the warning level was determined and displayed in the result area.
6. CONCLUSION