https://doi.org/10.5187/jast.2021.e31 pISSN 2672-0191 eISSN 2055-0391
Predicting body compositions
of live finishing pigs based on
bioelectrical impedance analysis
Ji Seon An
1#, Ji Hwan Lee
1#, Min Ho Song
2#, Won Yun
1, Han Jin Oh
1,
Yong Ju Kim
1, Jun Soeng Lee
1, Hyeun Bum Kim
3* and Jin Ho Cho
1*
1Division of Food and Animal Science, Chungbuk National University, Cheongju 28644, Korea
2Department of Animal Science and Biotechnology, Chungnam National University, Daejeon 34134,
Korea
3Department of Animal Resource and Science, Dankook University, Cheonan 31116, Korea
Abstract
The objective of this study was to predict body compositions of live pigs using bioelectrical impedance procedures. In experiment 1, 32 crossbred (Duroc × Landrace × Yorkshire) fin-ishing pigs with an average weight at 84.06 kg were used. In experiment 2, 96 crossbred (Duroc × Landrace × Yorkshire) finishing pigs with an average weight at 88.8 kg were used. A four-terminal body composition analyser was utilized to determine fat percentage. Lean meat percentage and backfat thickness were measured with a lean meat measuring meter. In experiment 1, fat percentage was not significantly correlated with lean meat percentage, although a tendency (p < 0.1) of a negative correlation was found. Backfat thickness was sig-nificantly correlated with fat percentage and lean meat percentage (r = 0.745 and r = −0.961, respectively). Coefficients of determination for fat percentage with lean meat percentage, fat percentage with backfat thickness, and backfat thickness with lean meat percentage were 0.503, 0.566, and 0.923, respectively. In experiment 2, fat percentage was significantly correlated with lean meat percentage (r = −0.972). Backfat thickness was also significantly correlated with fat percentage and lean meat percentage (r = 0.935 and r = −0.957, respec-tively). Results of this study indicate that bioelectrical impedance analysis might be useful for predicting body compositions of live finishing pigs.
Keywords: Bioelectrical impedance analysis, Backfat thickness, Finishing pig
INTRODUCTION
Swine industry and environment are rapidly changing [1]. Most domestic pig feed nutrient standards follow the National Research Council (NRC) standard, not the Korean livestock feeding standard. However, due to differences in feeding management technology and environment of domestic pig farms, there are many difficulties in applying the feeding standard of advanced pig farming countries. In the case of energy, pigs are often fed higher than energy requirements set by the Korean livestock feeding standard. Such mismanagement of feeding can lead to the appearance of low grades of pig carcasses after slaughter. Currently, pork carcass grades in Korea include 1+, 1, and 2 [2]. If pork carcass
Received: Oct 16, 2020 Revised: Nov 8, 2020 Accepted: Dec 16, 2020
# These authors contributed equally to this work.
*Corresponding author Hyeun Bum Kim
Department of Animal Resource and Science, Dankook University, Cheonan 31116, Korea.
Tel: +82-41-550-3653 E-mail: [email protected] Jin Ho Cho
Division of Food and Animal Science, Chungbuk National University, Cheongju 28644, Korea. Tel: +82-43-261-2544 E-mail: [email protected] Copyright © 2021 Korean Society of Animal Sciences and Technology. This is an Open Access article distributed under the terms of the Creative Commons Attribution Non-Commercial License (http:// creativecommons.org/licenses/by-nc/4.0/) which permits unrestricted non-commercial use, distribution, and reproduction in any medium, provided the original work is properly cited. ORCID Ji Seon An https://orcid.org/0000-0002-9205-8095 Ji Hwan Lee https://orcid.org/0000-0001-8161-4853 Min Ho Song https://orcid.org/0000-0002-4515-5212 Won Yun https://orcid.org/0000-0002-1835-2640
grade is rated 1 or higher, an incentive will be given. If pork carcass grade is grade 2 or out of the grade, a penalty will be given. Low grade of pork carcass is mainly due to overweight and lack of meat caused by incorrect feeding management during the growing-finishing period. Therefore, the quality of pork is determined by feeding management. Carcass grade has an effect on farm income. However, with current specification technology, it is difficult to manage pork carcass grade before slaughter. In addition, the technology for predicting carcass grade is insufficient. Therefore, it is necessary to develop a smart technology to reduce production costs by avoiding excessive nutrients while producing high-grade economic-forming pigs.
Bioelectrical impedance analysis (BIA) is a test method that measures in vivo resistance (impedance) using a small alternating current to the body to predict components that make up the body based on measured resistance values [3–5]. BIA has the following advantages: 1) it is non-invasive and safe without radiation, 2) its measurement time is short, 3) it needs a simple and inexpensive equipment, and 4) it has high reliability [3–7]. BIA is based on difference between current resistance values of fat and protein [8]. Fat with little moisture in tissues has the highest electrical intrinsic resistance while muscle containing a lot of moisture has a low resistance [3,4,8]. According to the difference in resistance between fat and protein, body composition ratio can be obtained [8]. Thus, BIA can analyze compositions of pigs without slaughter.
However, there is still a lack of technology to predict pork carcass grade by analyzing a pig’s body compositions through a BIA sensor. Therefore, the objective of this study was to determine correlations of body fat percentage, lean meat percentage, and backfat thickness by performing Pearson correlation analysis to evaluate whether BIA sensor could be used to predict body compositions of live finishing pigs.
MATERIALS AND METHODS
Protocols for the two experiments were approved by the Institutional Animal Care and Use Committee (IACUC) of Chungbuk National University, Cheongju, Korea (approval #CBNUA- 1428-20-02).
Animals and measurements
In experiment 1, a total of 32 crossbred (Duroc × Landrace × Yorkshire) finishing pigs weighted 84.06 kg (range, 51–110 kg) were used in a research farm of Chungbuk National University. All pigs were fed diets formulated to meet or exceed NRC [9] recommendations (Table 1). A four-terminal body composition analyser (model HBF-306, OMRON, Kyoto, Japan) was used to determine fat percentage according to the method described by Swantek et al. [10]. After measuring fat percentage, a lean meat measuring meter (model Piglog 105, SFK Technology, Herlev, Denmark) was used to determine lean meat percentage and backfat thickness according to the method described by Lucas et al. [11].
Experiment 2 was conducted by increasing the number of repetitions for more accurate and reliable analysis than that used in experiment 1. A total of 96 crossbred (Duroc × Landrace × Yorkshire) finishing pigs weighted 88.08 kg (range, 55–105 kg) were used in the research farm of Chungbuk National University.
Statistical analysis
All data measured with a body composition analyser and a lean meat measuring meter were analyzed by SPSS software package (SPSS, Chicago, IL, USA). Correlation was analyzed to test the significance of linear relationships of fat percentage, backfat thickness, and lean meat percentage.
Han Jin Oh
https://orcid.org/0000-0002-3396-483X Yong Ju Kim
https://orcid.org/0000-0002-0960-0884 Jun Soeng Lee
https://orcid.org/0000-0002-2497-6855 Hyeun Bum Kim
https://orcid.org/0000-0003-1366-6090 Jin Ho Cho
https://orcid.org/0000-0001-7151-0778 Competing interests
No potential conflict of interest relevant to this article was reported.
Funding sources
This work was supported by the National Research Foundation of Korea (NRF) grant funded by the Korea government (MSIT) (No. NRF-2019R1F1A1060192).
Acknowledgements Not applicable.
Availability of data and material Upon reasonable request, the datasets of this study can be available from the corresponding author.
Authors’ contributions
Conceptualization: An JS, Lee JH, Song MH, Kim HB, Cho JH.
Data curation: An JS, Lee JH, Yun W, Oh HJ, Kim YJ, Lee JS.
Formal analysis: An JS, Lee JH, Song MH. Investigation: An JS, Lee JH, Yun W, Oh HJ,
Kim YJ, Lee JS.
Writing - original draft: An JS, Lee JH, Song MH, Kim HB, Cho JH.
Writing - review & editing: Kim HB, Cho JH. Ethics approval and consent to participate Protocols for the two experiments were approved by the Institutional Animal Care and Use Committee (IACUC) of Chungbuk National University, Cheongju, Korea. (approval #CBNUA-1428-20-02).
The linear relationship was analyzed using Pearson correlation coefficient. In addition, a regression analysis equation was obtained to analyze the causal relationship of values.
RESULTS AND DISCUSSION
Table 2 presents values of average, standard error, and coefficient of determination for fat percentage, lean meat percentage, and backfat thickness of live finishing pigs (Experiment 1). In experiment 1, average fat percentage, average lean meat percentage, and average backfat thickness were 29.94%, 65.34%, and 21.14 mm, respectively. Coefficients of determination for fat percentage and lean meat percentage, fat percentage and backfat thickness, and backfat thickness and Lean meat percentage were 0.503, 0.566, and 0.923, respectively. Correlations of physical characteristics of live finishing pigs in experiment 1 are shown in Table 3. Fat percentage and lean meat percentage were negatively correlated (r = −0.556). On the other hand, fat percentage and backfat thickness showed a significantly positive correlation (r = 0.745). Fat percentage and lean meat percentage also showed a significantly positive correlation (r = −0.961). Linear relationships among fat percentage,
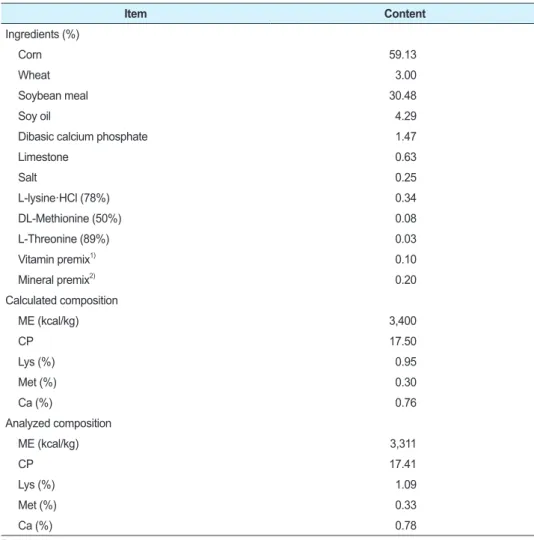
Table 1. Feed compositions of basal diet (as-fed basis)
Item Content Ingredients (%) Corn 59.13 Wheat 3.00 Soybean meal 30.48 Soy oil 4.29
Dibasic calcium phosphate 1.47
Limestone 0.63 Salt 0.25 L-lysine·HCl (78%) 0.34 DL-Methionine (50%) 0.08 L-Threonine (89%) 0.03 Vitamin premix1) 0.10 Mineral premix2) 0.20 Calculated composition ME (kcal/kg) 3,400 CP 17.50 Lys (%) 0.95 Met (%) 0.30 Ca (%) 0.76 Analyzed composition ME (kcal/kg) 3,311 CP 17.41 Lys (%) 1.09 Met (%) 0.33 Ca (%) 0.78
1) Provided per kg diet: 10,000 IU vitamin A; 3,000 IU vitamin D3; 80 IU vitamin E; 12 mg vitamin K; 150 mg vitamin C; 20 mg
riboflavin; 60 μg vitamin B12; 50 mg D-pantothenic acid; 60 mg biotin; 80 mg niacin; 2 mg vitamin B6.
2) Provided per kg diet: 100 mg Fe (as FeSO
4∙7H2O); 15 mg Cu (as CuSO4∙5H2O); 50 mg Zn (as ZnSO4); 54mg Mn (as MnO2); 1
mg I (as KI); 0.30 mg Se (as Na2SeO3∙5H2O).
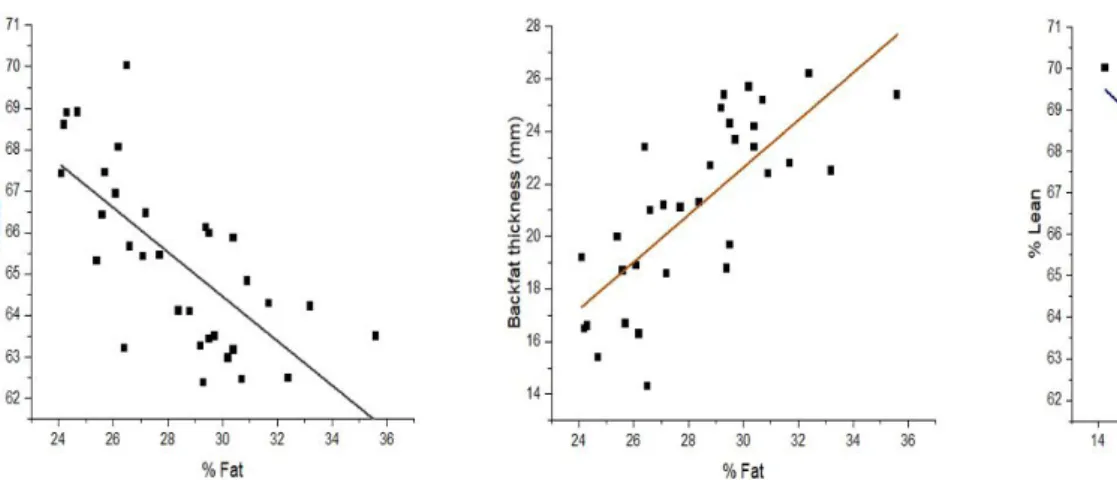
lean meat percentage, and backfat thickness are shown in Fig. 1. Linear relationships of lean meat percentage with fat percentage and backfat thickness were found to be negative. On the other hand, the linear relationship of fat percentage with backfat thickness was positive. Regression equations are shown as follows:
Fat percentage - lean meat percentage: y = −0.956x + 92.415 Backfat thickness - lean meat percentage: y = −0.607x + 78.173
Fat percentage - backfat thickness: y = 0.616x + 16.924
Table 4 shows values of average, standard error, and coefficient of determination for fat percentage, lean meat percentage, and backfat thickness of live finishing pigs (Experiment 2). In
Table 2. Regression coefficients and standard error for predicting lean, fat percentage and backfat
thickness with in vivo measurements (Experiment 1)
Item N Mean SE R2
Fat percentage1) 32 29.94
Lean meat percentage2) 32 65.34
Backfat thickness (mm) 32 21.14
Fat percentage - lean meat percentage 1.93 0.503
Fat percentage - backfat thickness 1.89 0.566
Backfat thickness - lean meat percentage 0.60 0.923
1)Fat percentage was measured with a body composition analyser.
2)Lean percentage and backfat thickness was measured with a lean meat measuring meter. R2, determination coefficient.
Table 3. Correlation matrix for physical characteristics of live pigs (Experiment 1)
Item Fat percentage1) Lean meat percentage2) Backfat thickness (mm)
Fat percentage
Lean meat percentage −.556
Backfat thickness (mm) .745* −.961**
1)Fat percentage was measured with a body composition analyser.
2)Lean percentage and backfat thickness was measured with a lean meat measuring meter.
* p < 0.05, ** p < 0.01.
experiment 2, average fat percentage, average lean meat percentage, and average backfat thickness were 26.79%, 64.36%, and 20.96 mm, respectively. Coefficients of determination for fat percentage and lean meat percentage, fat percentage and backfat thickness, and backfat thickness and lean meat percentage were 0.944, 0.875, and 0.916, respectively. Correlations of physical characteristics of live finishing pigs in experiment 2 are presented in Table 5. Lean meat percentage showed negative correlations with fat percentage and backfat thickness (r = −0.972 and r = −0.957, respectively). Fat percentage and backfat thickness showed a positive correlation (r = 0.935). All correlations in experiment 2 were significant (p < 0.01). Fig. 2 presents linear relationships of fat percentage, lean meat percentage, and backfat thickness. As in experiment 2, the linear relationship between fat percentage and lean meat percentage or between backfat thickness and lean meat percentage was negative. The linear relationship between fat percentage and backfat thickness was positive.
Fig. 2. Graphs of linear regression analysis of body composition in live finishing pigs (Experiment 2).
Table 4. Regression coefficients and standard error for predicting lean, fat percentage and backfat
thickness with in vivo measurements (Experiment 2)
Item N Mean SE R2
Fat percentage1) 96 26.79
Lean meat percentage2) 96 64.36
Backfat thickness (mm)3) 96 20.96
Fat percentage - lean meat percentage 0.35 0.944
Fat percentage - backfat thickness 0.97 0.875
Backfat thickness - lean meat percentage 0.43 0.916
1)Fat percentage was measured with a body composition analyser.
2)Lean percentage and backfat thickness was measured with a lean meat measuring meter. R2, determination coefficient.
Table 5. Correlation matrix for physical characteristics of live pigs (Experiment 2)
Item Fat percentage Lean meat percentage Backfat thickness (mm) Fat percentage
Lean meat percentage −.972**
Backfat thickness (mm) .935** −.957**
1)Fat percentage was measured with a body composition analyser.
2)Lean percentage and backfat thickness was measured with a lean meat measuring meter.
Regression equations are shown as follows:
Fat percentage - lean meat percentage: y = −0.525x + 78.439 Backfat thickness - lean meat percentage: y = −0.464x + 74.100
Fat percentage - backfat thickness: y = 0.840x + 9.193
The correlation coefficient used in this experiment is expressed as Pearson correlation coefficient that is commonly used to obtain the relationship between two variables [12]. The coefficient of determination means the degree to which a variable can be predicted by calculating R2. If it is close
to 1, it can be interpreted that the regression model is suitable [12]. The most important correlation between fat percentage and lean meat percentage showed higher reliability values in experiment 2 which had more precise analysis than experiment 1. This means that lean meat percentage can be predicted with a high probability based on fat percentage of live finishing pigs measured with a bioelectrical impedance analyzer. In addition, since Pearson correlation coefficient showed a significant negative correlation (r = −0.972), it could be judged that there is a close relationship between fat percentage and lean meat percentage. The lean meat percentage is calculated using the backfat thickness and the loin muscle area. The backfat thickness has a direct correlation with fat content of pigs [13,14]. In this study, there was a high correlation between fat percentage of pigs measured using a bioelectrical impedance sensor and backfat thickness measured using a meat percentage meter. Therefore, it is possible to analyze body compositions of pigs using a bioelectrical impedance sensor. In the study of Daza et al. [15], body compositions of Iberian pigs were analyzed using a bioelectrical impedance sensor. They reported that fat contents and fat percentage could be predicted to be 96% and 91.6%, respectively. It has been reported that not only fat percentage, but also the percentage of lean meat and bone can be predicted with a high reliability with a bioelectrical impedance sensor. Thus, bioelectrical impedance sensor can be used to predict body compositions of live pigs. Swantek et al. [10] has used a multiple regression model to predict body compositions of live pigs, showing a high reliability at 82%. As a rapid and non-destructive method, the use of a bioelectrical impedance sensor has an excellent potential for predicting body compositions. Similar to previous studies, this study showed a strong correlation between fat percentage and lean meat percentage through bioelectrical impedance analysis which showed a high reliability. Therefore, bioelectrical impedance analysis is highly promising as a safe and reliable technology for predicting carcass grade and managing body compositions of live finishing pigs.
CONCLUSION
There are high correlations among fat percentage, backfat thickness, and lean meat percentage of live finishing pigs. Bioelectrical impedance analysis can be used to predict body compositions of live pigs to facilitate feeding management of pigs.
REFERENCES
1. National Institute of Animal Science. Korean feeding standard for swine. 3rd ed. Wanju, Korea: National Institute of Animal Science; 2017.
2. Kwon KM. The application of automatic equipment for predicting of pig carcasses cut weight [Ph.D. dissertation]. Cheongju, Korea: Chungbuk National University; 2019.
3. Kim SC. Implementation of multiple frequency bioelectrical impedance analysis system for body composition analysis. J Korea Acad Ind Coop Soc. 2012;13:5403-8. https://doi.
org/10.5762/KAIS.2012.13.11.5403
4. Kim MS, Cho YC. Bioelectrical impedance analysis of multi-frequency using portable small impedance measuring system. J Korea Converg Soc. 2017;8:121-6. https://doi.org/10.15207/ JKCS.2017.8.2.121
5. Cho YC, Kim MS. Analysis of bioimpedance change and the characteristics of blood pressure according to posture. J Korea Ind Inf Syst Res. 2014;19:25-31. https://doi.org/10.9723/jksi-is.2014.19.5.025
6. Cho YC, Kim MS, Yoon JO. A study on the electrical difference for the limbs and thoracic impedance using real-time bio-impedance measurement system. J Korea Ind Inf Syst Res. 2013;18:9-16. https://doi.org/10.9723/jksiis.2013.18.6.009
7. Miyatani M, Kanehisa H, Masuo Y, Ito M, Fukunaga T. Validity of estimating limb muscle volume by bioelectrical impedance. J Appl Physiol. 2001;91:386-94. https://doi.org/10.1152/ jappl.2001.91.1.386
8. Kim DW, Song CG, Hwang SK. Measurement of body fat by impedance technique. J Biomed Eng Res. 1992;13:133-40.
9. National Research Council. Nutrient requirements of swine. 11th ed. Washington, DC: The National Academies Press; 2012.
10. Swantek PM, Crenshaw JD, Marchello MJ, Lukaski HC. Bioelectrical impedance: a nonde-structive method to determine fat-free mass of live market swine and pork carcasses. Anim Sci J. 1992;70:169-77. https://doi.org/10.2527/1992.701169x
11. Lucas D, Brun A, Gispert M, Carabús A, Soler J, Tibau J, et al. Relationship between pig car-cass characteristics measured in live pigs or carcar-casses with Piglog, Fat-o-Meat’er and computed tomography. Livest Sci. 2017;197;88-95. https://doi.org/10.1016/j.livsci.2017.01.010
12. Cha JW, Kim JY. Analysis of fine dust correlation between air quality and meteorological factors using SPSS. J Korea Inst Inf Commun Eng. 2018;22:722-7. https://doi.org/10.6109/ jkiice.2018.22.4.722
13. Park MJ, Park BC, Ha DM, Kim JB, Jang KS, Lee DH, et al. Effects of increasing market weight of finishing pigs on backfat thickness, incidence of the’caky-fatty’belly, carcass grade, and carcass quality traits. J Anim Sci Technol. 2013;55:195-202. https://doi.org/10.5187/ JAST.2013.55.3.195
14. Choi JS, Kwon KM, Lee YK, Joeng JU, Lee KO, Jin SK, et al. Application of AutoFom III equipment for prediction of primal and commercial cut weight of Korean pig carcasses. Asian-Australas J Anim Sci. 2018;31:1670-6. https://doi.org/10.5713/ajas.18.0240
15. Daza A, Mateos A, Ovejero I, Bote CJL. Prediction of body composition of Iberian pigs by means bioelectrical impedance. Meat Sci. 2006;72:43-6. https://doi.org/10.1016/j.meats-ci.2005.05.026