Abstract.
Background/Aim: A noninvasive method for
predicting a patient’s response to neoadjuvant
chemoradiotherapy (nCRT) for locally advanced rectal
cancer would be useful because this would help determine
the subsequent treatment strategy. Two types of noninvasive
biomarkers have previously been studied, based on
radiomics and based on blood test parameters. We
hypothesized that a combination of both types would provide
a better predictive power, and this has not previously been
investigated. Patients and Methods: Data from 135 patients
with locally advanced rectal cancer who underwent nCRT
were retrospectively allocated into training and validation
cohorts in a 2:1 ratio. Sixty-five radiomics features were
extracted from tumors segmented on T2-weighted magnetic
resonance images. An elastic net was applied to generate
four models for discerning the patients with good responses
to nCRT based on radiomics features (model R), blood
biomarkers (model B), both (model RB), and a linear
combination of models R and B (model R+B). Results:
Among 65 radiomics features, 17 were selected as robust
features for model development. The AUC values of model
R, model B, model RB, and model R+B achieved 0.751,
0.627, 0.785, and 0.711 in the training cohort (n=90), and
0.705, 0.603, 0.679, and 0.705 in validation cohort (n=45),
respectively. In the entire cohort, models RB and R+B
demonstrated a significantly better performance than model
B but not R. There was no correlation between the scores of
models R and B (p=0.76). Radiomics features had a greater
influence than blood biomarkers on models RB and R+B.
Conclusion: A non-redundancy between radiomics features
and blood-based biomarkers was observed. Furthermore,
radiomics features are more valuable in terms of predicting
response to nCRT. The importance of combining
non-invasive biomarkers in future investigations is highlighted.
Neoadjuvant chemoradiotherapy (nCRT) is the standard
treatment for locally advanced rectal cancer (LARC). The
patient’s response to nCRT is associated with disease
outcome (1) and is often used to determine the subsequent
This article is freely accessible online.*These Authors contributed equally to this study.
Correspondence to: Jae-Sung Kim, MD, Ph.D., Department of Radiation Oncology, Seoul National University Bundang Hospital, 82 Gumi-ro 173beon-gil, Bundang-gu, Seongnam 13620, Republic of Korea. Tel: +82 317877652, Fax: +82 317874019, e-mail: [email protected]
Key Words: Rectal cancer, radiomics, carcinoembryonic antigen, chemoradiotherapy.
Combining Radiomics and Blood Test Biomarkers
to Predict the Response of Locally
Advanced Rectal Cancer to Chemoradiation
SEUNG HYUCK JEON
1*, CHANGHOON SONG
2*, EUI KYU CHIE
3, BOHYOUNG KIM
4,
YOUNG HOON KIM
5, WON CHANG
5, YOON JIN LEE
5, JOO-HYUN CHUNG
3,
JIN BEOM CHUNG
2, KEUN-WOOK LEE
6, SUNG-BUM KANG
7and JAE-SUNG KIM
21
Laboratory of Translational Immunology and Vaccinology,
Graduate School of Medical Science and Engineering, KAIST, Daejeon, Republic of Korea;
2Department of Radiation Oncology, Seoul National University College of Medicine,
Seoul National University Bundang Hospital, Seongnam, Republic of Korea;
3
Department of Radiation Oncology, Seoul National University College of Medicine, Seoul, Republic of Korea;
4Division of Biomedical Engineering, Hankuk University of Foreign Studies, Yongin, Republic of Korea;
5
Department of Radiology, Seoul National University College of Medicine,
Seoul National University Bundang Hospital, Seongnam, Republic of Korea;
6Department of Internal Medicine, Seoul National University College of Medicine,
Seoul National University Bundang Hospital, Seongnam, Republic of Korea;
7Department of Surgery, Seoul National University College of Medicine,
Seoul National University Bundang Hospital, Seongnam, Republic of Korea
treatment (2, 3). For example, patients with a good response
to nCRT could be candidates for local excision or a
watch-and-wait strategy (3-6). Confirmation the response by biopsy
is desirable, but this is invasive and can be uncomfortable
for the patient. Because of this, numerous reports have
proposed noninvasive biomarkers for predicting the response
of tumors to nCRT.
Two categories of noninvasive biomarkers for predicting the
response of rectal cancer to nCRT have been studied. The first
approach is based on radiomics, the analysis of features
extracted from radiological studies, which has enabled the
prediction of phenotypes and prognoses of various types of
cancer (4). Radiomics is a powerful method that reflects the
biology of the whole tumor, and even that of the peritumoral
region, and which can be accessed serially during or after
treatment. Several radiomics models have demonstrated good
performance in predicting the response of rectal cancer to
nCRT (5-12). The second approach is based on establishing the
predictive value of biomarkers from routine blood tests, such
as levels of serum albumin (13) and carcinoembryonic antigen
(CEA) (14, 15). A great strength of these biomarkers is their
availability without any additional invasive tests. Radiomics
and blood markers may provide complementary information,
therefore we hypothesized that integrating information from
these two types of biomarkers could improve the overall
performance for predicting the response to nCRT. No studies
have combined these two types of biomarkers in rectal cancer
to predict tumor response, in the past.
In this study, we therefore, investigated the predictive
power of models derived from radiomics features, from
blood markers, and from a combination of both for
predicting the response to nCRT in rectal cancer. In addition,
we examined the underlying correlations between the models
and between individual biomarkers to clarify the effect of
combining the two types of marker.
Patients and Methods
Patients. The protocol for this retrospective study was approved by the Institutional Review Board of our hospital. The study included data for patients with LARC (clinically graded as T3-4 or node-positive) who were treated with nCRT followed by total mesorectal excision between 2008 and 2015, and for whom magnetic resonance imaging (MRI) had been acquired following the institutional protocol before nCRT. Patients were excluded if there was evidence of distant metastases at diagnosis or they had a history of other malignancy within the 5 years before diagnosis. In addition, patients were excluded if the MRI was of poor quality, such as with the inclusion of artifacts.
Evaluation of the response and disease-free survival. The surgical specimens were examined by pathologists and graded using a five-tier tumor regression grading system (TRG) according to the criteria of Dworak et al. (16); this ranged from TRG 0 (no regression) to TRG 4 (no vital tumor cells detectable). Patients classified as TRG
3 (only scattered tumor cells in the space of fibrosis with/without acellular mucin) or TRG 4 were defined as having a good response (GR); the other patients were classified as non-GR. Disease-free survival (DFS) was calculated as time from beginning of nCRT to disease recurrence or death from any cause.
Imaging protocol. Before beginning nCRT, the patients were scanned with a 1.5T Gyroscan Intera, 3T Achieva or 3T Ingenia MR scanner (Philips Medical Systems, Best, Netherlands). The institutional protocol included the acquisition of T2-weighted sequences using the following parameters: repetition time, 2424-7460 ms; echo time, 100-120 ms; flip angle, 90˚; slice thickness, 3 mm; slice spacing, 4 mm; matrix, 512×512 or 576×576.
Feature extraction and selection. Each tumor was delineated on the axial T2-weighted MRI acquired before nCRT with reference to the diffusion-weighted imaging sequence. Segmentation was performed manually on 3D Slicer 4.10.2 (17) by a radiation oncologist with 13 years of experience of gastrointestinal tumors. The images were preprocessed with Collewet’s normalization algorithm (18) to reduce the variability derived from varying the acquisition parameters, and they were then isotropically resampled to voxels sized 1×1×1 mm3. The gray-scale values of the voxels were z-score
normalized and quantized into 64 levels.
In total, 65 features were extracted from each segmentation, including tumor volume, eight first-order features, 25 texture features from the gray level co-occurrence matrix, 13 texture features from the gray level run length matrix, 13 texture features from gray level size zone matrix, and five texture features from the
Table I. Characteristics of the included patients.
Training cohort Validation cohort p-Value (n=90) (n=45) Age (years) 59.7±12.2 61.9±9.3 0.244 Clinical T stage 0.110 cT1-2 3 (3.3%) 0 (0.0%) cT3 79 (87.8%) 36 (80.0%) cT4 8 (8.9%) 9 (20.0%) Clinical N stage 0.081 cN0 15 (16.7%) 2 (4.4%) cN+ 75 (83.3%) 43 (95.6%) Pathologic T stage 0.134 ypT0 10 (11.1%) 10 (22.2%) ypT1 10 (11.1%) 2 (4.4%) ypT2 26 (28.9%) 8 (17.8%) ypT3 43 (47.8%) 23 (51.1%) ypT4 1 (1.1%) 2 (4.4%) Pathologic N stage 0.705 ypN0 62 (68.9%) 28 (62.2%) ypN1 22 (24.4%) 14 (31.1%) ypN2 6 (6.7%) 3 (6.7%) Dworak’s tumor regression grade 0.222 1 18 (20.0%) 8 (17.8%) 2 40 (44.4%) 21 (46.7%) 3 22 (24.4%) 6 (13.3%) 4 10 (11.1%) 10 (22.2%)
neighborhood gray tone difference matrix. All the radiomics features were z-score normalized.
Because the tumors were delineated by a single observer, we translated and extracted the features of segmentation to evaluate the stability of the features, following a process similar to one we described previously (19). In brief, segmentations were translated by ±2 mm in the lateral or vertical direction, and radiomics features were extracted from the translated segmentations. Intraclass correlation coefficient values for each feature, indicating feature reproducibility, were calculated from original and translated segmentations. Features with intraclass correlation coefficient values >0.8 were selected as robust features and included in the model development. The feature extraction and selection were performed using in-house MATLAB R2019a software.
Blood measurements. Data for eight blood-based measurements that had previously been reported in association with rectal cancer were collected. These included the neutrophil-to-lymphocyte ratio (20-22), platelet-to-lymphocyte ratio (20, 21), lymphocyte-to-monocyte ratio (20, 23), neutrophil-to-albumin ratio (24), serum albumin level (13), serum CEA level (14, 15), hemoglobin concentration (25), and platelet count (26). The samples were acquired before the beginning of nCRT, and the results were standardized by linearly normalizing each feature to the range 0-1.
Prediction models. The patients were randomly allocated into training and validation cohorts in a 2:1 ratio using the R package caret. The elastic net method was applied to build prediction models from the biomarkers. An elastic net, which combines the least absolute shrinkage selection operator with ridge regression, can be used for regularization of the data and variable selection. The α penalty of the elastic net was set as 0.5, and 10-fold cross-validation was performed for the regression. Radiomics scores were generated by combining the selected features according to their respective coefficients. The regression was performed using the R package glmnet.
Four models were generated: model R using radiomics features, model B using blood-based biomarkers, model RB using both radiomics features and blood-based biomarkers as input variables of the elastic net, and model R+B as a linear combination of the scores from model R and model B, with coefficients determined from logistic regression involving the individual scores.
Statistical analysis. Chi-squared tests or Student’s t-tests, as appropriate, were as used to compare the characteristics of the patients. Student’s t-tests or Wilcoxon rank sum tests, as appropriate, were used to compare the scores of two groups. The areas under
receiver operating characteristic curves (AUCs) were compared using Delong’s method. Correlations between scores or individual features were evaluated using Pearson’s correlation analysis. The p-values for multiple comparisons were corrected using Holm’s method. Cox proportional hazard models were used to assess the association of parameters to DFS. The statistical analyses were performed using R software 3.6.1 (http://www.r-project.org).
Results
Patient characteristics and treatment. A total of 135 patients
were included in the analysis and randomly assigned to
training (n=90) and validation (n=45) cohorts. There were no
significant differences in patient or tumor characteristics
between the two cohorts (Table I). No patient was classified
as TRG 0. The proportion of those with GR was 35.6% in
both cohorts. All the patients were diagnosed with
adenocarcinoma, except for one patient in the training cohort
with mucinous adenocarcinoma and one in the validation
cohort with adenosquamous carcinoma.
All the patients received nCRT with 50.4 Gy radiation in
28 fractions concurrently with either 5-fluorouracil (21.5%)
or capecitabine (78.5%). Adjuvant chemotherapy was
administered to 91.1% of the patients. There was no
significant difference between the GR and non-GR patients
in the interval from the end of nCRT to surgery (mean=51.7
days and 48.7 days, respectively; Student’s t-test, p>0.05),
indicating that the response may be primarily due to the
biology of the cancer rather than a longer wait before the
evaluation of the response.
Generation of models. In total, 17 radiomics features had
intraclass correlation coefficients >0.8 in stability testing and
were selected for the model development. These are listed in
Table II. The elastic net was applied to the training cohort
and the coefficients for the resulting prediction scores are
shown in Table III. In brief, six radiomics features were
selected for model R. All of these were also included in
model RB, along with two additional radiomics features.
Three blood-based biomarkers [carcinoembryonic antigen
(CEA), hemoglobin, and albumin levels] were included in
Table II. List of the 17 radiomics features with intraclass correlation coefficient >0.8 and included in the model development.Category Feature Tumor volume Tumor volume First-order Entropy Gray level co-occurrence matrix Autocorrelation
Gray level run length matrix Short run emphasis, Long run emphasis, Run-length nonuniformity, Run percentage, Short run low gray-level emphasis, Long run low gray-level emphasis
Gray level size zone matrix Large zone emphasis, Large zone low gray-level emphasis, Large zone high gray-level emphasis, Gray-level variance, Zone-size variance
model B. Model RB included platelet count as well as CEA
and albumin levels, but did not use the hemoglobin level.
Model R+B was developed with the coefficients of the
scores from models R and B (1.936 and 1.688, respectively).
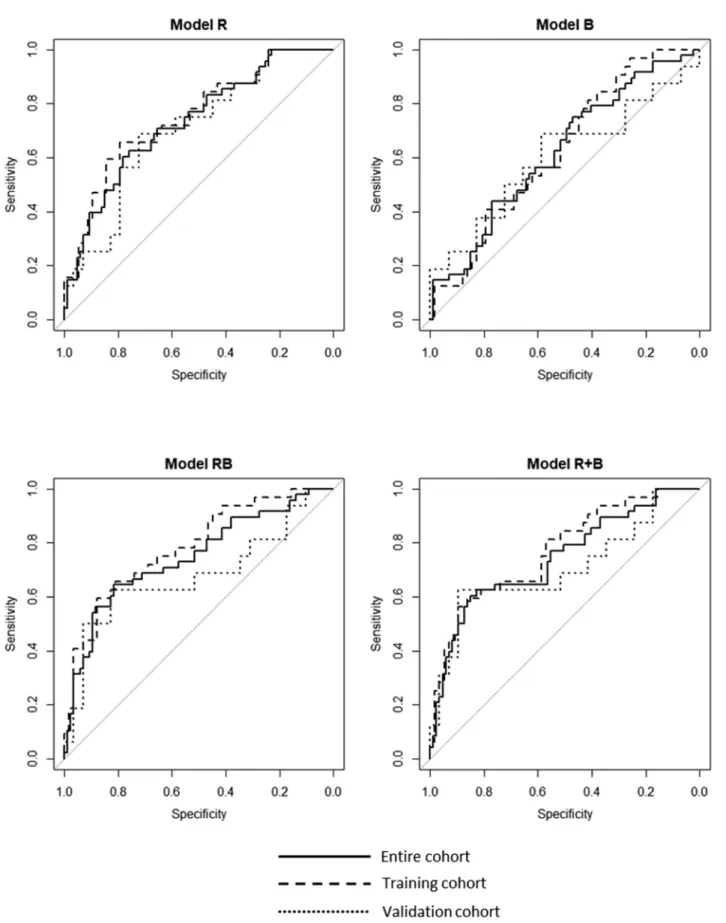
Performance of the models. For the training cohort, AUC
values for models R, B, RB, and R+B were 0.751 [95%
confidence interval (CI)=0.644-0.857], 0.627 (95%
CI=0.510-0.743), 0.785 (95% CI=0.685-0.884), and 0.771 (95%
CI=0.668-0.874), respectively. When the models were applied
to the validation cohort, the AUC values were 0.705 (95%
CI=0.545-0.864), 0.603 (95% CI=0.415-0.792), 0.679 (95%
CI=0.495-0.863), and 0.705 (95% CI=0.528-0.882) (Figure 1).
The average scores from each of the four models were
significantly greater for the GR subgroup than for the
non-GR subgroup (all p<0.05). Models R, RB, and R+B were all
successful in discerning the GR subgroup patients (classified
as TRG 3 or 4) from those in the non-GR group (TRG 0-2),
but were unable to discriminate specific TRG levels within
each of these groups, such as TRG 1 from TRG 2 or TRG 3
from TRG 4 (Figure 2).
Model comparison. The AUC values for the entire cohort for
models R, B, RB, and R+B were 0.733 (95%
CI=0.645-0.820), 0.621 (95% CI=0.523-0.718), 0.747 (95%
CI=0.657-0.838), and 0.743 (95% CI=0.653-0.833), respectively. The
performance of model R was better than that of model B
with near statistical significance (p=0.067). Models RB and
R+B showed significantly better prediction ability than
model B (p=0.005 and 0.001, respectively), but not
compared to model R (p=0.58 and 0.6, respectively).
The correlations between the models are shown in Figure 3.
The scores from models R and B were not correlated (p=0.76),
whereas those from models R and RB showed a very strong
correlation (r=0.988, p<0.001). A marginal correlation was
observed between the scores of models B and RB (r=0.146,
p=0.09). These results suggest that the radiomics features and
blood test markers each provided data that were not redundant,
with the radiomics features showing greater predictive power.
Next, we examined the correlations between the individual
radiomics features and blood-based biomarkers that were used
in at least one of the models (Figure 4). Hemoglobin, albumin,
and platelet levels showed a moderate correlation with tumor
volume and the radiomics feature “NGTDM_busyness.” There
was no other significant correlation between radiomics
features and the blood-based biomarkers.
To assess the relative influence of the two types of
biomarkers, the scores of model RB were divided into those
Figure 1. Receiver operating characteristics curves for radiomicsfeatures (model R), blood biomarkers (model B), both (model RB), and a linear combination of models R and B (model R+B), and comparisons of their AUC values.
Table III. Coefficients of each feature selected by elastic net. Model R Model B Model RB Radiomics biomarker Volume –0.1383 N/A –0.0751 GLCM_autocorrelation –0.3586 N/A –0.3732 GLRLM_SRE 0.0193 N/A 0.0608 GLRLM_RLN N/A N/A 0.0163 GLRLM_SRLGE 0.2271 N/A 0.1897 GLSZM_LZHGE 2.2618 N/A 2.5996 NGTDM_coarseness N/A N/A 0.0104 NGTDM_busyness –0.7176 N/A –0.6624 Blood biomarker
CEA N/A –1.3286 –0.0076 Hemoglobin N/A 0.3388 N/A Platelet N/A N/A 0.0005 Albumin N/A 1.1065 0.9591 Model R: Model based on radiomics features; Model B: Model based on blood biomarkers; Model RB: Model based on both radiomics features and blood biomarkers; N/A: not applicable; GLCM_autocorrelation: Autocorrelation in gray level co-occurrence matrix; GLRLM_SRE; Short run emphasis in gray level run length matrix; GLRLM_RLN: Run-length nonuniformity in gray level run length matrix; GLRLM_SRLGE: Short run low gray-level emphasis in gray level run length matrix; GLSZM_LZHGE: Large zone high gray-level emphasis in gray level size zone matrix; NGTDM_coarseness: Coarseness in neighborhood gray tone difference matrix; NGTDM_busyness: Busyness in neighborhood gray tone difference matrix; CEA: carcinoembryonic antigen.
based on the radiomics features and those based on the blood
biomarkers. The standard deviations of the radiomics and
blood test scores were 2.305 and 0.404, respectively, with no
correlation between the two sets of scores (r=0.005, p=0.96).
The same approach was applied to model R+B; the standard
deviations were 3.857 and 0.557, respectively. These findings
suggest that the radiomics features were the main determinant
of the results of the combined prediction models.
Correlation with disease-free survival. To investigate the
impact of the two types of biomarkers on predicting
long-term outcome, we analyzed the associations between scores
from the individual models and DFS. In the univariate
analysis, the scores from models B, RB, and R+B were
significantly associated with DFS (p<0.001, p=0.047, and
p=0.017, respectively). Among the clinical factors, DFS was
significantly correlated with response (GR vs. non-GR,
p=0.006), clinical T stage (p=0.010), and clinical N stage
(p=0.002). Multivariate analysis that included the factors
that showed statistical significance in the univariate analysis
yielded the following independent predictors of DFS:
response (hazard ratio [HR]=0.28, 95% CI=0.09-0.83,
Figure 2. Comparisons of the scores for each tumor regression grade. *p<0.05, **p<0.01, ***p<0.001.p=0.022), clinical N stage (HR=2.06, 95% CI=1.04-4.05,
p=0.037), and the score from model B (HR=0.16, 95%
CI=0.04-0.68, p=0.028); the scores from model R (p=0.25)
and model R+B (p=0.23) did not demonstrate statistical
significance. These findings indicated that the blood-based
biomarkers may be more strongly related to long-term
outcomes than the radiomics features.
Discussion
To the best of our knowledge, this is the first study to
integrate imaging- and blood-based biomarkers to predict the
response to nCRT in LARC. The findings showed that using
both types of biomarkers did not result in redundant
information; however, the radiomics features had a greater
predictive power and greater influence than the blood
biomarkers on the combination model, so the combination of
both biomarkers did not result in significantly better
performance than using radiomics alone.
Both radiomics and blood test biomarkers are highly
attractive, because they allow serial clinically relevant
noninvasive predictors for predicting the response of cancer
to radiotherapy. They also have potential in personalizing
patient treatment. However, limitations of radiomics
biomarkers include the poor reproducibility of the tumor
segmentation and selected features, and nonstandard image
acquisition protocols. The weakness of haematological
markers includes inconsistent cut-off values for dividing
clearly responders and non-responders. More direct
evaluation of the host–tumour response, such as circulating
tumour cells or DNA, tumour-infiltrating lymphocytes, and
molecular profiling of peripheral lymphocytes may be better
tools than haematological examination.
Radiomics features have been demonstrated to have a
predictive and prognostic value for numerous cancer types (4).
Radiomics features are thought to represent information about
tumor genotypes and phenotypes. For example, radiomics
signatures have been successfully used to predict histological
grade (27-29) and KRAS mutation status (29, 30) in colorectal
cancer. Unlike biopsy specimens, radiomics features are
derived from the whole tumor. Numerous studies have
demonstrated that the response of rectal cancer to nCRT is
associated with tumor characteristics (31). Indeed, several
studies have described models for predicting the response of
LARC to nCRT. Nie et al. developed a model with
multiparametric MRI to predict the pathologic response of
rectal cancer; this achieved an AUC of 0.84 for pathologic
complete response (6). Horvat and colleagues applied a
random forest classifier and demonstrated that their model
predicted pathologic complete response with an AUC of 0.93
(7). The models in the present study showed a moderate
performance for the prediction of GR based on T2-weighted
radiomics model could work as a predictor of the response of
LARC to nCRT, as shown by the present and previous studies.
The tumor response is associated not only with tumor
biology, represented by radiomics in this study, but also with
systemic status. Oncological outcomes have been shown to
be significantly correlated with biomarkers of systemic
status, such as the neutrophil-to-lymphocyte ratio and serum
albumin levels (32-34). In the present study, lower CEA
levels and higher albumin levels were consistently associated
with a better response, which was consistent with the
findings of previous studies (13-15). The serum CEA levels
reflect the biology of tumor; the serum albumin level
represents both the nutritional status and the inflammatory
status of the patient, because systemic inflammation can
result in the suppression of albumin synthesis (35). Hence,
blood-based biomarkers may serve as important factors for
predicting the tumor response to nCRT.
Because radiomics features and blood biomarkers may
represent different aspects of tumor response, we
hypothesized that combining these two types of markers
improves the predictive power compared to using either type
alone. However, no previous studies have integrated the two
types of biomarkers and used them to predict the response to
treatment. Wang et al. presented nomograms of survival in
non-small cell lung cancer using computed tomography
radiomics and inflammatory markers and showed that the
nomogram that incorporated the biomarkers achieved higher
performance than those based on either type of marker alone
(36). Unlike that study, the analysis in the present study
focused on short-term outcome (i.e., the response), because
survival can be affected by a myriad of factors such as the
toxicity of therapy, the type of salvage treatment, and the
biology of a recurrent tumor. Importantly, the systemic status
may have a greater influence on survival than on the
response, as supported by the results from our analysis of
factors associated with DFS. The combined models in the
present study (i.e., models RB and R+B) showed a weaker
association with DFS than that of model B, presumably
because the blood-based biomarkers made little contribution
in these models.
Figure 4. Correlation matrix of radiomics features and blood-based biomarkers included in at least one of the models. Significant correlations (corrected p-value<0.05) between the variables are indicated by (*). GLCM_autocorrelation: Autocorrelation in gray level co-occurrence matrix; GLRLM_SRE; Short run emphasis in gray level run length matrix; GLRLM_RLN: Run-length nonuniformity in gray level run length matrix; GLRLM_SRLGE: Short run low gray-level emphasis in gray level run length matrix; GLSZM_LZHGE: Large zone high gray-level emphasis in gray level size zone matrix; NGTDM_coarseness: Coarseness in neighborhood gray tone difference matrix; NGTDM_busyness: Busyness in neighborhood gray tone difference matrix; CEA: carcinoembryonic antigen.
In the present study, radiomics features likely to
represent tumor biology had a greater impact than systemic
status represented by blood-test measures on the response
to nCRT. In addition, there was no correlation between the
blood-based biomarkers and the radiomics features. Of
note, serum CEA level, which is likely to represent tumor
biology rather than systemic status, did not correlate with
any of the radiomics features included in the prediction
model. However, blood-based markers may be more
important than radiomics features in predicting long-term
outcomes, such as DFS. Thus, future studies that
investigate the noninvasive prediction of oncological
outcomes should primarily be based on radiomics features,
then seeking performance improvements by adding
systemic biomarkers.
This study had several limitations. First, no MRI
sequences other than T2-weighted images were used.
Previous studies using multiparametric MRI reported
radiomics models with higher AUC values for predicting
the response than those achieved by our combined model
(5, 6). It is also possible that functional MRI sequences
reflect the systemic status of patients, at least to some
extent. Hence, there may be a need for further investigation
of whether blood-based biomarkers provide additional
information to features from multiparametric MRI. Second,
some of the parameters differed between patients. Although
we normalized the images with z-score transformations, a
subset of the features may have been vulnerable to
variation due to different MRI acquisition parameters (37).
Finally, the developed models need to be validated using
an independent dataset. Further studies are warranted to
validate the results and expand the scope of the present
study.
In summary, this study showed that radiomics features and
blood biomarkers provide complementary information in
terms of prediction of response of rectal cancer to nCRT, and
radiomics features were found to be more informative than
the blood biomarkers. Future radiomics studies should
consider integrating blood biomarkers into the radiomic
model, especially for the consideration of long-term
outcomes.
Conflicts of Interest
The Authors declare that they have no competing interests regarding this study.
Authors’ Contributions
SHJ, CS, and JSK contributed to conception and design of the study. SHJ, CS, and JSK contributed to analysis and interpretation of data, and drafting of the manuscript. All Authors participated in clinical data acquisition. All Authors read and approved the final manuscript.
Acknowledgements
This work was supported by the National Research Foundation of Korea (NRF) grant funded by the Korea government (MSIT and Ministry of Education) (#2020R1C1C1014192 & #2017R1D1A1B 03033892).
References
1 Fokas E, Liersch T, Fietkau R, Hohenberger W, Beissbarth T, Hess C, Becker H, Ghadimi M, Mrak K, Merkel S, Raab HR, Sauer R, Wittekind C and Rodel C: Tumor regression grading after preoperative chemoradiotherapy for locally advanced rectal carcinoma revisited: Updated results of the cao/aro/aio-94 trial. J Clin Oncol 32(15): 1554-1562, 2014. PMID: 24752056. DOI: 10.1200/JCO.2013.54.3769
2 Renehan AG, Malcomson L, Emsley R, Gollins S, Maw A, Myint AS, Rooney PS, Susnerwala S, Blower A, Saunders MP, Wilson MS, Scott N and O’Dwyer ST: Watch-and-wait approach versus surgical resection after chemoradiotherapy for patients with rectal cancer (the oncore project): A propensity-score matched cohort analysis. Lancet Oncol 17(2): 174-183, 2016. PMID: 26705854. DOI: 10.1016/S1470-2045(15)00467-2 3 Creavin B, Ryan E, Martin ST, Hanly A, O’Connell PR, Sheahan
K and Winter DC: Organ preservation with local excision or active surveillance following chemoradiotherapy for rectal cancer. Br J Cancer 116(2): 169-174, 2017. PMID: 27997526. DOI: 10.1038/bjc.2016.417
4 Lambin P, Leijenaar RTH, Deist TM, Peerlings J, de Jong EEC, van Timmeren J, Sanduleanu S, Larue R, Even AJG, Jochems A, van Wijk Y, Woodruff H, van Soest J, Lustberg T, Roelofs E, van Elmpt W, Dekker A, Mottaghy FM, Wildberger JE and Walsh S: Radiomics: The bridge between medical imaging and personalized medicine. Nat Rev Clin Oncol 14(12): 749-762, 2017. PMID: 28975929. DOI: 10.1038/nrclinonc.2017.141 5 Liu Z, Zhang XY, Shi YJ, Wang L, Zhu HT, Tang Z, Wang S, Li
XT, Tian J and Sun YS: Radiomics analysis for evaluation of pathological complete response to neoadjuvant chemoradiotherapy in locally advanced rectal cancer. Clin Cancer Res 23(23): 7253-7262, 2017. PMID: 28939744. DOI: 10.1158/1078-0432.CCR-17-1038
6 Nie K, Shi L, Chen Q, Hu X, Jabbour SK, Yue N, Niu T and Sun X: Rectal cancer: Assessment of neoadjuvant chemoradiation outcome based on radiomics of multiparametric mri. Clin Cancer Res 22(21): 5256-5264, 2016. PMID: 27185368. DOI: 10.1158/1078-0432.CCR-15-2997
7 Horvat N, Veeraraghavan H, Khan M, Blazic I, Zheng J, Capanu M, Sala E, Garcia-Aguilar J, Gollub MJ and Petkovska I: Mr imaging of rectal cancer: Radiomics analysis to assess treatment response after neoadjuvant therapy. Radiology 287(3): 833-843, 2018. PMID: 29514017. DOI: 10.1148/radiol.2018172300 8 Bibault JE, Giraud P, Housset M, Durdux C, Taieb J, Berger A,
Coriat R, Chaussade S, Dousset B, Nordlinger B and Burgun A: Deep learning and radiomics predict complete response after neo-adjuvant chemoradiation for locally advanced rectal cancer. Sci Rep 8(1): 12611, 2018. PMID: 30135549. DOI: 10.1038/s41598-018-30657-6
9 Zhou X, Yi Y, Liu Z, Cao W, Lai B, Sun K, Li L, Zhou Z, Feng Y and Tian J: Radiomics-based pretherapeutic prediction of non-response to neoadjuvant therapy in locally advanced rectal
cancer. Ann Surg Oncol 26(6): 1676-1684, 2019. PMID: 30887373. DOI: 10.1245/s10434-019-07300-3
10 Dinapoli N, Barbaro B, Gatta R, Chiloiro G, Casa C, Masciocchi C, Damiani A, Boldrini L, Gambacorta MA, Dezio M, Mattiucci GC, Balducci M, van Soest J, Dekker A, Lambin P, Fiorino C, Sini C, De Cobelli F, Di Muzio N, Gumina C, Passoni P, Manfredi R and Valentini V: Magnetic resonance, vendor-independent, intensity histogram analysis predicting pathologic complete response after radiochemotherapy of rectal cancer. Int J Radiat Oncol Biol Phys 102(4): 765-774, 2018. PMID: 29891200. DOI: 10.1016/j.ijrobp.2018.04.065
11 Vandendorpe B, Durot C, Lebellec L, Le Deley MC, Sylla D, Bimbai AM, Amroun K, Ramiandrisoa F, Cordoba A, Mirabel X, Hoeffel C, Pasquier D and Servagi-Vernat S: Prognostic value of the texture analysis parameters of the initial computed tomographic scan for response to neoadjuvant chemoradiation therapy in patients with locally advanced rectal cancer. Radiother Oncol 135: 153-160, 2019. PMID: 31015162. DOI: 10.1016/j.radonc.2019.03.011
12 Cui Y, Yang X, Shi Z, Yang Z, Du X, Zhao Z and Cheng X: Radiomics analysis of multiparametric mri for prediction of pathological complete response to neoadjuvant chemoradiotherapy in locally advanced rectal cancer. Eur Radiol 29(3): 1211-1220, 2019. PMID: 30128616. DOI: 10.1007/s00330-018-5683-9 13 Krauthamer M, Rouvinov K, Ariad S, Man S, Walfish S, Pinsk
I, Sztarker I, Charkovsky T and Lavrenkov K: A study of inflammation-based predictors of tumor response to neoadjuvant chemoradiotherapy for locally advanced rectal cancer. Oncology 85(1): 27-32, 2013. PMID: 23816828. DOI: 10.1159/000348385 14 Probst CP, Becerra AZ, Aquina CT, Tejani MA, Hensley BJ, Gonzalez MG, Noyes K, Monson JR and Fleming FJ: Watch and wait?—elevated pretreatment CEA is associated with decreased pathological complete response in rectal cancer. J Gastrointest Surg 20(1): 43-52; discussion 52, 2016. PMID: 26546119. DOI: 10.1007/s11605-015-2987-9
15 Wallin U, Rothenberger D, Lowry A, Luepker R and Mellgren A: CEA - a predictor for pathologic complete response after neoadjuvant therapy for rectal cancer. Dis Colon Rectum 56(7): 859-868, 2013. PMID: 23739192. DOI: 10.1097/DCR.0b013e 31828e5a72
16 Dworak O, Keilholz L and Hoffmann A: Pathological features of rectal cancer after preoperative radiochemotherapy. Int J Colorectal Dis 12(1): 19-23, 1997. PMID: 9112145. DOI: 10.1007/s003840050072
17 Kikinis R, Piper S and Vosburgh K: 3D Slicer: a platform for subject-specific image analysis, visualization, and clinical support. In: Intraoperative Imaging Image-Guided Therapy, Ferenc A. Jolesz (eds.). Springer, New York, NY, Vol 3, pp. 277-289. DOI: 10.1007/978-1-4614-7657-3_19
18 Collewet G, Strzelecki M and Mariette F: Influence of mri acquisition protocols and image intensity normalization methods on texture classification. Magn Reson Imaging 22(1): 81-91, 2004. PMID: 14972397. DOI: 10.1016/j.mri.2003.09.001 19 Jeon SH, Song C, Chie EK, Kim B, Kim YH, Chang W, Lee YJ,
Chung JH, Chung JB, Lee KW, Kang SB and Kim JS: Delta-radiomics signature predicts treatment outcomes after preoperative chemoradiotherapy and surgery in rectal cancer. Radiat Oncol 14(1): 43, 2019. PMID: 30866965. DOI: 10.1186/s13014-019-1246-8 20 Ward WH, Goel N, Ruth KJ, Esposito AC, Lambreton F,
Sigurdson ER, Meyer JE and Farma JM: Predictive value of
leukocyte- and platelet-derived ratios in rectal adenocarcinoma. J Surg Res 232: 275-282, 2018. PMID: 30463730. DOI: 10.1016/j.jss.2018.06.060
21 Kim TG, Park W, Kim H, Choi DH, Park HC, Kim SH, Cho YB, Yun SH, Kim HC, Lee WY, Lee J and Kang KM: Baseline neutrophil-lymphocyte ratio and platelet-lymphocyte ratio in rectal cancer patients following neoadjuvant chemoradiotherapy. Tumori 105(5): 434-440, 2019. PMID: 30117371. DOI: 10.1177/0300891618792476
22 Kim IY, You SH and Kim YW: Neutrophil-lymphocyte ratio predicts pathologic tumor response and survival after preoperative chemoradiation for rectal cancer. BMC Surg 14: 94, 2014. PMID: 25406793. DOI: 10.1186/1471-2482-14-94 23 Deng YX, Lin JZ, Peng JH, Zhao YJ, Sui QQ, Wu XJ, Lu ZH,
Gao YH, Zeng ZF and Pan ZZ: Lymphocyte-to-monocyte ratio before chemoradiotherapy represents a prognostic predictor for locally advanced rectal cancer. Onco Targets Ther 10: 5575-5583, 2017. PMID: 29200872. DOI: 10.2147/OTT.S146697 24 Tawfik B, Mokdad AA, Patel PM, Li HC and Huerta S: The
neutrophil to albumin ratio as a predictor of pathological complete response in rectal cancer patients following neoadjuvant chemoradiation. Anticancer Drugs 27(9): 879-883, 2016. PMID: 27434664. DOI: 10.1097/CAD.0000000000000411 25 Clarke TL, White DA, Osborne ME, Shaw AM, Smart NJ and Daniels IR: Predicting response to neoadjuvant chemoradiotherapy in locally advanced rectal cancer with serum biomarkers. Ann R Coll Surg Engl 99(5): 373-377, 2017. PMID: 28462648. DOI: 10.1308/rcsann.2017.0030
26 Steele M and Voutsadakis IA: Pre-treatment platelet counts as a prognostic and predictive factor in stage ii and iii rectal adenocarcinoma. World J Gastrointest Oncol 9(1): 42-49, 2017. PMID: 28144399. DOI: 10.4251/wjgo.v9.i1.42
27 Huang X, Cheng Z, Huang Y, Liang C, He L, Ma Z, Chen X, Wu X, Li Y, Liang C and Liu Z: Ct-based radiomics signature to discriminate high-grade from low-grade colorectal adenocarcinoma. Acad Radiol 25(10): 1285-1297, 2018. PMID: 29503175. DOI: 10.1016/j.acra.2018.01.020
28 He B, Ji T, Zhang H, Zhu Y, Shu R, Zhao W and Wang K: Mri-based radiomics signature for tumor grading of rectal carcinoma using random forest model. J Cell Physiol 234(11): 20501-20509, 2019. PMID: 31074022. DOI: 10.1002/jcp.28650 29 Meng X, Xia W, Xie P, Zhang R, Li W, Wang M, Xiong F, Liu Y,
Fan X, Xie Y, Wan X, Zhu K, Shan H, Wang L and Gao X: Preoperative radiomic signature based on multiparametric magnetic resonance imaging for noninvasive evaluation of biological characteristics in rectal cancer. Eur Radiol 29(6): 3200-3209, 2019. PMID: 30413959. DOI: 10.1007/s00330-018-5763-x 30 Oh JE, Kim MJ, Lee J, Hur BY, Kim B, Kim DY, Baek JY, Chang HJ, Park SC, Oh JH, Cho SA and Sohn DK: Magnetic resonance-based texture analysis differentiating kras mutation status in rectal cancer. Cancer Res Treat 52(1): 51-59, 2020. PMID: 31096736. DOI: 10.4143/crt.2019.050
31 Dayde D, Tanaka I, Jain R, Tai MC and Taguchi A: Predictive and prognostic molecular biomarkers for response to neoadjuvant chemoradiation in rectal cancer. Int J Mol Sci 18(3): 2017. PMID: 28272347. DOI: 10.3390/ijms18030573
32 Gupta D and Lis CG: Pretreatment serum albumin as a predictor of cancer survival: A systematic review of the epidemiological literature. Nutr J 9: 69, 2010. PMID: 21176210. DOI: 10.1186/1475-2891-9-69
33 Choi N, Kim JH, Chie EK, Gim J and Kang HC: A meta-analysis of the impact of neutrophil-to-lymphocyte ratio on treatment outcomes after radiotherapy for solid tumors. Medicine (Baltimore) 98(18): e15369, 2019. PMID: 31045780. DOI: 10.1097/MD.0000000000015369
34 Lee JH, Song C, Kang SB, Lee HS, Lee KW and Kim JS: Predicting pathological complete regression with haematological markers during neoadjuvant chemoradiotherapy for locally advanced rectal cancer. Anticancer Res 38(12): 6905-6910, 2018. PMID: 30504408. DOI: 10.21873/anticanres.13067 35 Ballmer PE, Ochsenbein AF and Schutz-Hofmann S:
Transcapillary escape rate of albumin positively correlates with plasma albumin concentration in acute but not in chronic inflammatory disease. Metabolism 43(6): 697-705, 1994. PMID: 7515458. DOI: 10.1016/0026-0495(94)90117-1
36 Wang L, Dong T, Xin B, Xu C, Guo M, Zhang H, Feng D, Wang X and Yu J: Integrative nomogram of ct imaging, clinical, and hematological features for survival prediction of patients with locally advanced non-small cell lung cancer. Eur Radiol 29(6): 2958-2967, 2019. PMID: 30643940. DOI: 10.1007/s00330-018-5949-2
37 Yang F, Dogan N, Stoyanova R and Ford JC: Evaluation of radiomic texture feature error due to mri acquisition and reconstruction: A simulation study utilizing ground truth. Phys Med 50: 26-36, 2018. PMID: 29891091. DOI: 10.1016/j.ejmp.2018. 05.017