Hyponatremia in patients with
systemic lupus erythematosus
Jae Il Shin
1,2,*, Se Jin Park
3,*, Chang-Hee Suh
4,*, Geum Hwa Lee
1, Min Woo Hur
1, Song Yi Han
1,
Dong Soo Kim
1& Ji Hong Kim
1,5The aim of this study was to determine whether decreased serum sodium concentration could be associated with the disease activity in SLE. We retrospectively analyzed the data of the two
independent cohorts of children and adults with SLE in two centers. Hyponatremia was associated with serum chloride (p = 0.004), albumin (p = 0.002) and SLE disease activity index (SLEDAI) (p = 0.026) in children with SLE. Serum sodium levels were correlated negatively with ESR (p =0.001) and positively with serum albumin levels (p < 0.0001) and C3 (p = 0.008) in children with SLE and those levels were correlated negatively with serum interleukin-6 levels (p = 0.003) in adults with SLE. Independent risk factors for the development of hyponatremia were the decreased serum C3 levels (OR 1.069, p = 0.031), the decreased serum chloride levels (OR 2.054, p = 0.006) and increased erythrocyte sedimentation rate (ESR) (OR 1.066, p = 0.03) in children with SLE and increased C-reactive protein (CRP) (OR 1.480, p = 0.023) in combined cohorts with SLE by multiple logistic regression analyses. Our study firstly showed that hyponatremia could reflect a disease activity and severe inflammation of SLE.
Systemic lupus erythematosus (SLE) is a chronic multisystem autoimmune disease with a highly variable clini-cal course1,2. During the course of the disease, decreased serum levels of C3, C4 and high anti-double stranded
(anti-ds) DNA antibody titers are reported to be associated with the disease activity and poor survival3.
Hyponatremia is known to be one of the most common electrolyte abnormalities and can cause seizures, brain edema, encephalopathy, and even death4,5. Hyponatremia has been reported to be poor clinical outcome such as
mortality in general population, dialyzed patients and those with heart failure, cirrhosis and sepsis6–8. However,
the incidence and clinical significance of hyponatremia has not been studied in rheumatic diseases including SLE and only some case reports of hyponatremia have been reported in SLE9,10. Also, there has been no report
describing the relationship between the degree of hyponatremia and the disease activity in both childhood and adulthood SLE.
Therefore, the aim of this study was to evaluate the clinical and laboratory characteristics related to disease activity in children and adults with SLE and determine whether decreased serum sodium concentration could be associated with the disease activity in SLE.
Results
A cohort of children and adolescents with SLE.
Laboratory characteristics of the patients with (Group I, n = 11) and without hyponatremia (Group II, n = 63) are shown in Table 1. There were no significant differ-ences in white blood cell (WBC) counts, hemoglobin, hematocrit, platelet counts, erythrocyte sedimentation rate (ESR), C-reactive protein (CRP), serum potassium, total carbon dioxide (tCO2), blood urea nitrogen (BUN),creatinine, total protein, cholesterol, uric acid, alanine aminotransferase (ALT) and total bilirubin between the two groups (p > 0.05). However, serum chloride (p = 0.004), albumin (p = 0.002), aspartate aminotransferase (AST) levels (p = 0.004) and SLE disease activity index (SLEDAI) (p = 0.026) were significantly higher and serum calcium levels (p = 0.004) were significantly lower in SLE patients with hyponatremia than those without.
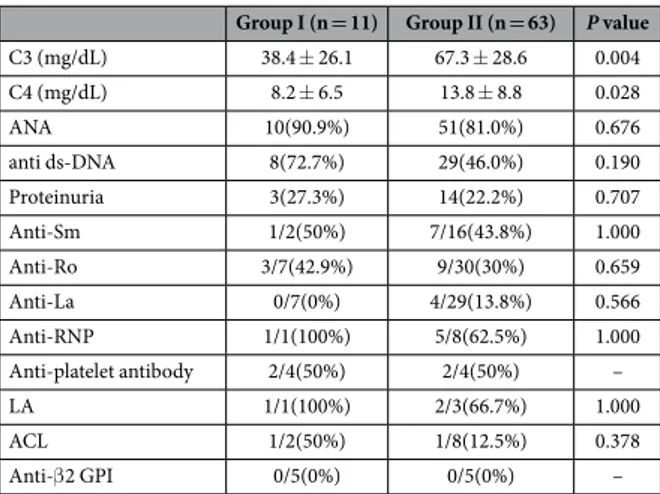
The positivity of antinuclear antibody (ANA), anti-ds DNA antibody and other autoantibodies, and the inci-dence of proteinuria did not differ between the two groups. However, serum C3 levels which reflect the disease activity were significantly lower in SLE patients with hyponatremia than those without (p = 0.004) (Table 2).
1Department of Pediatrics, Yonsei University College of Medicine, Seoul, Korea. 2Department of Pediatric Nephrology, Severance Children’s Hospital, Seoul, Korea. 3Department of Pediatrics, Ajou University School of Medicine, Daewoo General Hospital, Geoje, Korea. 4Department of Rheumatology, Ajou University School of Medicine, Suwon, Korea. 5Department of Pediatrics, Gangnam Severance Hospital, Yonsei University College of Medicine, Seoul, Korea. *These authors contributed equally to this work. Correspondence and requests for materials should be addressed to J.H.K. (email: [email protected])
Received: 12 October 2015 Accepted: 19 April 2016 Published: 19 May 2016
Independent risk factors for the development of hyponatremia were the decreased serum C3 levels (OR 1.069, p = 0.031), the decreased serum chloride levels (OR 2.054, p = 0.006) and increased erythrocyte sedimentation rate (ESR) (OR 1.066, p = 0.03) in children with SLE by multiple logistic regression analysis (Table 3).
The values of area under the curves (AUC) for the prediction of hyponatremia in children with SLE were 0.749 (95% CI 0.589–0.908, p = 0.026) for high SLEDAI, 0.779 (95% CI 0.613–0.946, p = 0.012) for high ESR levels, 0.775 (95% CI 0.599–0.951, p = 0.013) for high AST levels, 0.758 (95% CI 0.563–0.953, p = 0.021) for decreased serum C3 levels and 0.778 (95% CI 0.650–0.906, p = 0.013) for decreased serum albumin levels.
Group I with
hyponatremia (n = 11) hyponatremia (n = 63)Group II without P value
WBC (/μ L) 8,456 ± 6,081 6,831 ± 3,641 0.933 ESR (mm/hr) 48.8 ± 31.9 29.9 ± 23.3 0.073 CRP (mg/dL) 3.6 ± 6.8 0.6 ± 0.8 0.478 Hb (g/dL) 10.8 ± ± 2.2 11.2 ± 2.1 0.140 Hct (%) 31.5 ± 6.6 32.7 ± 6.5 0.138 PLT (/μ L) 226,364 ± 145,007 247,694 ± 107,885 0.418 Na (mmol/L) 131.4 ± 4.1 139.1 ± 2.3 < 0.001 K (mmol/L) 3.7 ± 0.6 4.1 ± 0.5 0.105 Cl (mmol/L) 98.4 ± 9.3 104.5 ± 3.3 0.004 tCO2 (mmol/L) 22.7 ± 5.1 23.0 ± 3.1 0.994 BUN (mg/dL) 12.8 ± 4.5 11.7 ± 4.9 0.456 Creatinine (mg/dL) 0.6 ± 0.1 0.6 ± 0.2 0.994 AST (IU/L) 73 ± 70 33 ± 38 0.004 ALT (IU/L) 58 ± 79 24 ± 22 0.074 Total protein (g/dL) 6.7 ± 1.3 6.8 ± 0.9 0.330 Albumin (g/dL) 3.3 ± 0.4 4.0 ± 0.8 0.002 Uric acid (mg/dL) 5.0 ± 1.6 4.8 ± 1.2 0.835 Cholesterol (mg/dL) 150 ± 49 177 ± 83 0.176 Calcium (mg/dL) 8.0 ± 1.1 9.0 ± 0.8 0.004 Phosphorus (mg/dL) 3.3 ± 1.4 4.1 ± 1.0 0.124 Total bilirubin (mg/dL) 0.8 ± 0.8 0.6 ± 0.8 0.184 SLEDAI (score) 6.9 ± 6.1 3.1 ± 3.4 0.026
Table 1. General laboratory findings of children with lupus with or without hyponatremia. WBC white
blood cell, ESR erythrocyte sedimentation rate, CRP C-reactive protein, Hb hemoglobin, Hct hematocrit, PLT platelet, Na Sodium, K potassium, Cl Chloride, tCO2 total carbon dioxide, BUN blood urea nitrogen, AST
aspartate aminotransferase, ALT alanine aminotransferase, SLEDAI Systemic lupus erythematosus disease activity index.
Group I (n = 11) Group II (n = 63) P value
C3 (mg/dL) 38.4 ± 26.1 67.3 ± 28.6 0.004 C4 (mg/dL) 8.2 ± 6.5 13.8 ± 8.8 0.028 ANA 10(90.9%) 51(81.0%) 0.676 anti ds-DNA 8(72.7%) 29(46.0%) 0.190 Proteinuria 3(27.3%) 14(22.2%) 0.707 Anti-Sm 1/2(50%) 7/16(43.8%) 1.000 Anti-Ro 3/7(42.9%) 9/30(30%) 0.659 Anti-La 0/7(0%) 4/29(13.8%) 0.566 Anti-RNP 1/1(100%) 5/8(62.5%) 1.000 Anti-platelet antibody 2/4(50%) 2/4(50%) – LA 1/1(100%) 2/3(66.7%) 1.000 ACL 1/2(50%) 1/8(12.5%) 0.378 Anti-β 2 GPI 0/5(0%) 0/5(0%) –
Table 2. Immunologic laboratory findings and proteinuria of children with lupus with or without hyponatremia. C3 complement component 3, ANA antinuclear antibody, Anti-ds DNA
Anti-double-stranded DNA (Deoxyribonucleic acid), Anti-RNP Anti-Ribonucleoprotein, LA Lupus anticoagulant, ACL anticardiolipin antibodies, Anti-β2 GPI Anti-β 2-glycoprotein I.
In addition, serum sodium levels were correlated negatively with ESR (r = − 0.399, p = 0.001) and serum AST levels (r = − 0.334, p = 0.004), but positively with C3 (r = 0.304, p = 0.008), serum chloride (r = 0.372, p = 0.001), serum calcium (r = 0.549, p < 0.0001) and serum albumin levels (r = 0.479, p < 0.0001) (Table 4).
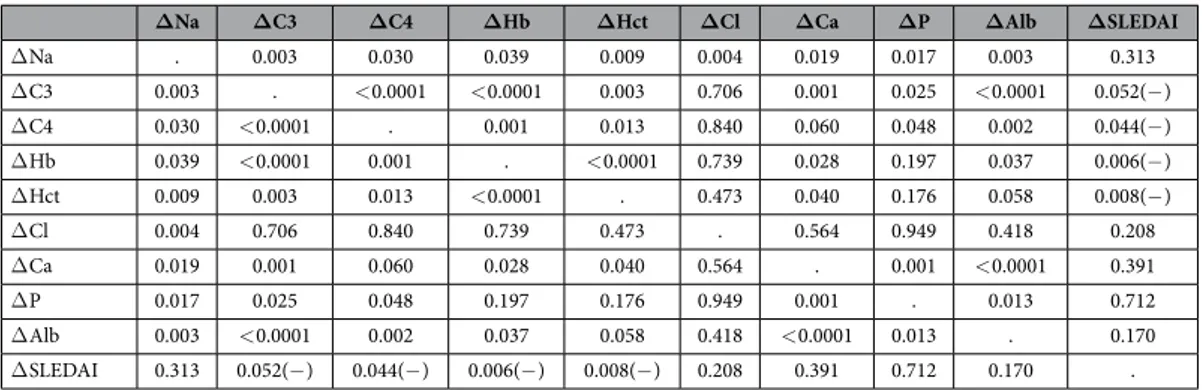
Furthermore, changes in serum sodium levels (Na levels at the follow-up state– Na levels at the initial state, Δ Na) correlated positively with changes in serum C3 (Δ C3) (r = 0.476, p = 0.003), serum C4 (Δ C4) (r = 0.357, p = 0.03), hemoglobin (Δ Hb) (r = 0.340, p = 0.039), hematocrit (Δ Hct) (r = 0.425, p = 0.009), chloride (Δ chlo-ride) (r = 0.466, p = 0.004), calcium (Δ calcium) (r = 0.385, p = 0.019), phosphorus (Δ phosphorus) (r = 0.391, p = 0.017) and albumin levels (Δ albumin) (r = 0.481, p = 0.003). However, Δ Na were not correlated with changes in SLEDAI (Δ SLEDAI) (r = − 0.191, p = 0.313) (Table 5).
A cohort of adolescents and adults with SLE.
Laboratory characteristics of the patients with (n = 7) and without hyponatremia (n = 77) are shown in Supplementary Table S1. There were no significant differences in WBC counts, SLEDAI, interleukin (IL)-6, IL-2, the dose of steroids and urine specific gravity between the two groups (p > 0.05). CRP levels were higher in SLE patients with hyponatremia than those without with a border-line significance (p = 0.077).Serum sodium levels were correlated negatively with serum IL-6 levels (r = − 0.317, p = 0.003), while those did not correlate to serum IL-2 levels (p = 0.389). Serum IL-6 levels were also positively correlated with SLEDAI (r = 0.386, p = 0.032) (Table 6). The significant correlations between serum sodium and IL-6 levels were more prominent in SLE patients who were not treated with steroids (r = − 0.424, p = 0.017) than those who were treated with steroids (r = − 0.247, p = 0.075). In SLE patients who were not treated with steroids, serum sodium
Odds ratio 95% CI P value
ESR (mm/hr) 1.066 1.006–1.130 0.03
Chloride (mmol/L) 2.054 1.229–3.433 0.006
C3 (mg/dL) 1.069 1.006–1.136 0.031
Table 3. Multiple logistic regression analysis of laboratory parameters associated with the development of lupus-associated hyponatremia in children with lupus. ESR erythrocyte sedimentation rate, C3 complement
component 3.
Na C3 ESR Cl Ca Alb AST SLEDAI
Na . 0.008 0.001(− ) 0.001 < 0.0001 < 0.0001 0.004(− ) 0.060 C3 0.008 . 0.003(− ) 0.025 < 0.0001 < 0.0001 0.001(− ) < 0.0001(− ) ESR 0.001(− ) 0.003(− ) . 0.545 0.004(− ) 0.001(− ) 0.107 0.015 Cl 0.001 0.025 0.545 . 0.375 0.157 0.034(− ) 0.612 Ca < 0.0001 < 0.0001 0.004(− ) 0.375 . < 0.0001 0.004 (− ) 0.058 Alb < 0.0001 < 0.0001 0.001(− ) 0.157 < 0.0001 . < 0.0001(− ) 0.016(− ) AST 0.004(-) 0.001(− ) 0.107 0.034(− ) 0.004(− ) < 0.0001(− ) . 0.002 SLE DAI 0.060 < 0.0001(− ) 0.015 0.612 0.058 0.016(− ) 0.002 .
Table 4. Correlations among key laboratory findings in children with lupus. Na Sodium, C3 complement
component 3, ESR erythrocyte sedimentation rate, Cl Chloride, Ca Calcium, Alb Albumin, AST aspartate aminotransferase, SLEDAI Systemic lupus erythematosus disease activity index, (− ): negative correlation.
ΔNa ΔC3 ΔC4 ΔHb ΔHct ΔCl ΔCa ΔP ΔAlb ΔSLEDAI
Δ Na . 0.003 0.030 0.039 0.009 0.004 0.019 0.017 0.003 0.313 Δ C3 0.003 . < 0.0001 < 0.0001 0.003 0.706 0.001 0.025 < 0.0001 0.052(− ) Δ C4 0.030 < 0.0001 . 0.001 0.013 0.840 0.060 0.048 0.002 0.044(− ) Δ Hb 0.039 < 0.0001 0.001 . < 0.0001 0.739 0.028 0.197 0.037 0.006(− ) Δ Hct 0.009 0.003 0.013 < 0.0001 . 0.473 0.040 0.176 0.058 0.008(− ) Δ Cl 0.004 0.706 0.840 0.739 0.473 . 0.564 0.949 0.418 0.208 Δ Ca 0.019 0.001 0.060 0.028 0.040 0.564 . 0.001 < 0.0001 0.391 Δ P 0.017 0.025 0.048 0.197 0.176 0.949 0.001 . 0.013 0.712 Δ Alb 0.003 < 0.0001 0.002 0.037 0.058 0.418 < 0.0001 0.013 . 0.170 Δ SLEDAI 0.313 0.052(− ) 0.044(− ) 0.006(− ) 0.008(− ) 0.208 0.391 0.712 0.170 .
Table 5. Correlations among changes in laboratory findings in children with lupus. Na Sodium, C3
complement component 3, C4 complement component 4, Hb Hemoglobin, Hct Hematocrit, Cl Chloride, Ca Calcium, P Phosphorus, Alb Albumin, SLEDAI Systemic lupus erythematosus disease activity index, (− ): negative correlation.
levels were correlated negatively with urine specific gravity which reflect the effect of ADH with a borderline significance (r = − 0.326, p = 0.073) (Supplementary Tables S2–S3).
Two combined cohorts of children and adults with SLE.
In univariate analyses, there were no signif-icant differences in WBC counts and SLEDAI between the two groups (p > 0.05) and ESR (p = 0.053) and CRP levels (p = 0.053) were higher in SLE patients with hyponatremia (n = 18) than those without (n = 140) with borderline significances (Supplementary Table S4).Multiple logistic regression analysis showed that increased CRP level (OR 1.480, p = 0.023) was an inde-pendent risk factor for the development of hyponatremia in combined cohorts of children and adults with SLE (Supplementary Table S5). In addition, serum sodium levels were correlated negatively with CRP (r = − 0.368, p < 0.0001) and ESR levels (r = − 0.189, p = 0.023) (Supplementary Table S6).
Receiver operating characteristic (ROC) curves.
To establish the predictive value of the parameters for predicting hyponatremia in patients with lupus, ROC curves were plotted for SLEDAI, ESR, AST, serum C3 and albumin levels.AUC values from ROC curve analyses for SLEDAI, ESR, AST, serum C3 and albumin levels were 0.743 (P = 0.029), 0.768 (P = 0.016), 0.770 (P = 0.015), 0.746 (P = 0.027) and 0.777 (P = 0.013), respectively (Supplementary Table S7 and Figure S1).
Discussion
The main goal of this study was to investigate the significance of hyponatremia in children and adults with SLE and determine whether hyponatremia is associated with disease activity. Our study firstly demonstrated the asso-ciation of hyponatremia with the decreased C3 and increased ESR levels and SLEDAI which reflect disease activ-ity of SLE in a cohort of children with SLE and serum sodium levels were correlated negatively with serum IL-6 levels in an independent cohort of adults with SLE, which have not been investigated in both adults and children over the past decade.
Hyponatremia can occur in patients with SLE by various causes such as renal disease, acute kidney injury, and medication use, but only very few case reports were found in literatures on hyponatremia in SLE9,10. Although
the exact mechanism of hyponatremia in SLE flare patients is not established yet, we speculate that inflammation can be one of the mechanisms in the pathogenesis of hyponatremia in SLE patients. In a cohort of children with SLE, we found that decreased serum chloride levels were independent risk factors for the development of hypon-atremia in children with SLE. Urinary loss of sodium chloride could cause hyponhypon-atremia and hypochloremia and it can be caused by renal tubular damage or increased renal sodium loss by a reduction in renal tubular sodium absorption in inflammatory conditions11–20. However, we excluded the SLE patients with evident renal failure,
because tubular injury can cause natriuresis and hyponatremia which obscure the relationship between lupus activity and serum sodium levels. Therefore, serum creatinine levels and the degree of proteinuria did not differ in SLE patients with hyponatremia than those without.
Eisenhut pointed out that inflammatory mediators such as IL-1 and tumor necrosis factor (TNF)-α have been reported to reduce sodium transport in epithelial cells by a reduction in the expression and function of the apical epithelial sodium channel (ENaC) and/or the sodium potassium ATPase (Na/K ATPase) at the basolateral mem-brane11,12. It was also demonstrated that IL-1 could induce natriuresis in the rat model13. Using cultures of inner
medullary, cortical collecting duct and proximal tubular renal cells in vitro, the potential mechanisms were found to involve a reduction in the Na/K ATPase function mediated by prostaglandin E214–18 and by increasing tissue
levels of nitric oxide, which is a potent suppressor of the epithelial Na/K ATPase by the intracellular messenger cGMP and through protein kinase G modification19,20. An activation of the autoimmune system in SLE can cause
CD8 + T-cells and macrophages to produce pro-inflammatory cytokines and chemokines, such as interleukin (IL)-1, IL-6, IL-8 and TNF-α 21–24.
Because the degree of proteinuria did not differ in SLE children with hyponatremia than those without and our children with SLE did not have nephrotic syndrome or severe renal disease, hypoalbuminemia might occur by severe inflammation through a disease activity of SLE. Hypoalbuminemia has been regarded as an important
Na WBC ESR CRP SLE DA1 IL-6 IL-2 Steroid SG
Na . 0.373 0.070 0.446 0.716 0.003(− ) 0.389 0.710 0.486 WBC 0.373 . 0.623 0.232 0.256 0.399 0.487 0.005 0.865 ESR 0.070 0.623 . 0.026 0.438 0.010 0.587 0.915 0.293 CRP 0.446 0.232 0.026 . 0.092 0.004 1.000 0.424 0.012(− ) SLEDAI 0.716 0.256 0.438 0.092 . 0.051 0.321 0.305 0.801 IL-6 0.003(− ) 0.399 0.010 0.004 0.051 . 0.339 0.918 0.798 IL-2 0.389 0.487 0.587 1.000 0.321 0.339 . 0.979 0.032 Steroid 0.710 0.005 0.915 0.424 0.305 0.918 0.979 . 0.644 SG 0.486 0.865 0.293 0.012(− ) 0.801 0.798 0.032 0.644
Table 6. Correlations among key laboratory findings in adults with lupus. Na Sodium, WBC white blood
cell, ESR erythrocyte sedimentation rate, CRP C-reactive protein, SLEDAI Systemic lupus erythematosus disease activity index, IL-6 Interleukin-6, IL-2 Interleukin-2, SG urine specific gravity, (− ): negative correlation.
cause of appreciable hypovolemic hyponatremia25. Also, it was thought that decreased serum calcium levels could
be caused by hypoalbuminemia in our children’s cohort.
We found that hyponatremia was associated with increased ESR, CRP, and SLEDAI and decreased serum albumin and C3 levels by various statistical methods (univariate, multivariate and correlation analyses) in our cohorts of SLE, suggesting that hyponatremia in SLE is closely related to more severe inflammation. Although not studied yet in SLE, there have been some evidences and our hypothetical background showing that IL-1β or IL-6 might increase antidiuretic hormone (ADH) secretion, leading to hyponatremia26–31. Mastorakos et al. reported
that plasma ADH levels were increased after injection of IL-6 in cancer patients, suggesting that IL-6 activated the magnocellular ADH-secreting neurons, which could be involved in the development of SIADH26. Ohta et al.
performed animal experiments and intravenous administrations of IL-1β increased ADH27. Because IL-6 and
IL-1β are all important cytokines in the pathogenesis of SLE both in animal models and human SLE21–24, there is a
possibility that increased these cytokines could be implicated in the pathogenesis of hyponatremia in the patients with SLE. To validate this hypothesis, we analyzed the relationship between serum sodium and IL-6 levels in an independent cohort of adults with SLE and found that serum sodium levels were correlated negatively with serum IL-6 levels (r = − 0.317, p = 0.003), which was more prominent in SLE patients who were not treated with steroids (r = − 0.424, p = 0.017). In SLE patients who were not treated with steroids, serum sodium levels were correlated negatively with urine specific gravity which reflect the effect of ADH with a borderline significance (r = − 0.326, p = 0.073).
Our study has some limitations, such as small sample size due to the rarity of lupus in Korea, retrospec-tive study design. Nevertheless, the current data are noteworthy because we firstly showed that hyponatremia reflected disease activity of SLE in two independent cohorts of children and adults with SLE. Therefore, clinicians should recognize this electrolyte disturbance in SLE and pediatricians should pay more attention to the risk for exacerbating hyponatremia by administering a hypotonic fluid in children. Further studies are necessary to evaluate the exact molecular mechanism of hyponatremia in SLE and to elucidate whether our findings are also relevant in a large cohort of SLE in the future.
Patients and Methods
A cohort of children and adolescents with SLE.
We retrospectively analyzed the data of 37 children (male:female = 4:33) who had been diagnosed with SLE in Severance Children’s Hospital for 20 years from the years 1991 to 2010. Laboratory examinations were collected two times at the stage of disease activity and at fol-low-up after 22.2 ± 28.3 months (range 1–123 months) in all patients. We divided the patients into two groups: group I (n = 11 samples, hyponatremia) and group II (n = 63 samples, no hyponatremia).Medical charts were reviewed for clinical characteristics, such as age at onset, gender, and laboratory data, including WBC counts, hemoglobin, hematocrit, platelet counts, ESR, CRP, serum sodium, potassium, chloride, tCO2, calcium, phosphorus, BUN, creatinine, total protein, albumin, cholesterol, uric acid, AST, ALT, total
bili-rubin, and urinalysis.
Serum sodium assay was evaluated by using ion selective electrodes measurement by an automated chem-istry analyzer (Olympus AU-2700, Beckman coulter, Mishima, Japan). Complete blood counts including plate-let counts were analyzed by the Advia 2120i automated analyzer (Siemens Healthcare Diagnostics, Deerfield, IL, USA). CRP levels were measured by the latex-enhanced turbidimetric assay method using a Hitachi 7600 P module (Hitachi, Tokyo, Japan). ESR levels were measured by the TEST 1 (Alifax, Padova, Veneto, Italy). Serum C3 and C4 levels were measured by the automated Roche Diagnostics analyzer (Hitachi Cobas C501, Roche Diagnostics GmbH, Mannheim, Germany). Antinuclear antibodies and anti-ds DNA antibodies were detected by immunofluorescence using Crithidia luciliae (Department of Laboratory Medicine, Severance Hospital, Seoul). Strict quality control procedures were adopted.
A cohort of adolescents and adults with SLE.
Among 166 SLE patients who were followed up at Ajou University Hospital and in whom IL-6 levels were measured23, 84 were included in the study (age: mean34.4 ± 12.1 years [range 16–69 years], male : female = 8:76) in whom serum sodium levels were available. Laboratory parameters of disease activity were recorded such as WBC counts, ESR, CRP, and urine specific gravity and SLEDAI was also calculated. Measurements of IL-2 and IL-6 in serum samples were performed by sand-wich enzyme-linked immunosorbent assay (ELISA) using BD OptEIA sets (Pharmingen, San Diego, CA). All serum samples were measured in triplicate and diluted 1:1 in assay diluent for OptEIA ELISA sets. Briefly, after coating with primary anti-human IL-2 and IL-6 antibodies (Pharmingen) and blocking, 100 μ g of diluted serum was loaded, and biotinylated secondary anti-human IL-2 and IL-6 monoclonal antibodies (Pharmingen) were added, respectively. The wells were incubated with streptavidine horseradish peroxidase conjugate, and color-imetric reaction was developed with 3,3′ ,5,5′ -tetramethylbenzidine (TMB) substrate solution and terminated with 2 N H2SO4. Then, absorbance at 450 nm (reference, 570 nm) was read by an automated microplate reader
(Benchmark, Bio-RAD, Hercules, CA). The serum cytokine levels were determined by comparison with a stand-ard curve obtained using recombinant human IL-2 and IL-6, respectively23.
Definitions.
The diagnosis of SLE was based on the revised classification criteria of the American College of Rheumatology in 1997 in two cohorts of SLE2. The classification is based on 11 criteria and the diagnosis of SLEwas made if any 4 or more of the 11 criteria are present, serially or simultaneously, during any interval of obser-vation. The 11 criteria are as follows: malar rash, discoid rash, photosensitivity, oral ulcers, nonerosive arthritis involving 2 or more peripheral joints, pleuritis or pericarditis, renal disorder (persistent proteinuria > 0.5 grams per day or > than 3+ if quantitation not performed or cellular casts–may be red cell, hemoglobin, granular, tubular, or mixed), neurologic disorder (seizures or psychosis), hematologic disorder (hemolytic anemia with reticulocytosis or leukopenia < 4,000/mm3 on ≥ 2 occasions or lymphopenia < 1,500/mm3 on ≥ 2 occasions or
thrombocytopenia < 100,000/mm3 in the absence of offending drugs), immunologic disorder (anti-ds DNA in
abnormal titer or anti-Sm or positive finding of antiphospholipid antibodies) and positive antinuclear antibody2.
Hyponatremia was defined as serum sodium level ≤ 135 mEq/L. SLE activity was considered serologically as the increased titers of anti-ds DNA antibodies and decreased complement levels, such as C3 < 90 mg/dL and C4 < 10 mg/dL and SLEDAI was also measured1.
Statistical methods.
Statistical analyses were performed, using the SPSS for Windows (SPSS Inc., Chicago, Illinois, USA) and MedCalc version 15.8 (MedCalc Software, Ostend, Belgium). The independent t-test and Mann-Whitney U test was used for continuous variables and expressed as mean ± standard deviation. Fisher’s exact test was used to analyze categorical variables. Correlation analysis was also carried out to determine the relationship between two variables by Spearman or Pearson correlation. We also analyzed whether the changes (Δ : follow-up levels- initial levels) of serum sodium correlated with the changes (Δ ) of other parameters in a cohort of children with SLE. Multiple logistic regression analysis was used to find independent predictive factors for hyponatremia in lupus. To establish the predictive value of the parameters for predicting hyponatremia, ROC curves were plotted for laboratory tests. All differences were considered significant at a value of p < 0.05This study design and the use of patients’ information stored in the hospital database were approved by the Institutional Review Board and the research ethics committee of Yonsei Severance Hospital and Ajou University Hospital. We were given exemption from getting informed consents by the two IRBs because the present study is a retrospective study and personal identifiers were completely removed and the data were analyzed anonymously. Our study was conducted according to the ethical standards laid down in the 1964 Declaration of Helsinki and its later amendments.
References
1. Rao, V. & Gordon, C. Advances in the assessment of lupus disease activity and damage. Curr Opin Rheumatol 26, 510–519 (2014). 2. Hochberg, M. C. Updating the American College of Rheumatology revised criteria for the classification of systemic lupus
erythematosus. Arthritis Rheum. 40, 1725 (1997).
3. Otten, M. H. et al. Disease activity patterns in juvenile systemic lupus erythematosus and its relation to early aggressive treatment. Lupus 19, 1550–1556 (2010).
4. Moritz, M. L. & Ayus, J. C. Preventing neurological complications from dysnatremias in children. Pediatr. Nephrol. 20, 1687–1700 (2005).
5. Corona, G. et al. Moderate hyponatremia is associated with increased risk of mortality: evidence from a meta-analysis. PLos One 8, e80451 (2013).
6. Mohan, S., Gu, S., Parikh, A. & Radhakrishnan, J. Prevalence of hyponatremia and association with mortality: results from NHANES. Am. J. Med. 126, 1127–1137 (2013).
7. Hoorn, E. J. & Zietse, R. Hyponatremia and mortality: moving beyond associations. Am. J. Kidney Dis. 62, 139–149 (2013). 8. Chawla, A., Sterns, R. H., Nigwekar, S. U. & Cappuccio, J. D. Mortality and serum sodium: do patients die from or with
hyponatremia? Clin. J. Am. Soc. Nephrol. 6, 960–5 (2011).
9. Martín Santos, J. M., Terroba Larumbe, M. C., Dib, B. & Armentia Medina, A. Systemic lupus erythematosus and the syndrome of inappropriate secretion of antidiuretic hormone. Clin. Exp. Rheumatol. 14, 578–579 (1996).
10. Elisaf, M. S., Milionis, H. J. & Drosos, A. A. Hyponatremia due to inappropriate secretion of antidiuretic hormone in a patient with systemic lupus erythematosus. Clin. Exp. Rheumatol. 17, 223–226 (1999).
11. Eisenhut, M. Changes in renal sodium transport during a systemic inflammatory response. Pediatr. Nephrol. 21, 1487–1488 (2006). 12. Eisenhut, M. Changes in ion transport in inflammatory disease. J. Inflamm. (Lond ) 3, 5 (2006).
13. Beasley, D., Dinerello, C. A. & Cannon, J. G. JG Interleukin-1 induces natriuresis in conscious rats: role of renal prostaglandins. Kidney Int. 33, 1059–1065 (1988).
14. Kreydiyyeh, S. I. & Al-Sadi, R. Interleukin-1beta increases urine flow rate and inhibits protein expression of Na [+ ]/K[+ ]-ATPase in the rat jejunum and kidney. J. Interferon Cytokine Res. 22, 1041–1048 (2002).
15. Linas, S. L. & Repine, J. E. Endothelial cells regulate proximal tubule epithelial cell sodium transport. Kidney Int. 55, 1251–1258 (1999). 16. Kreydiyyeh, S. I. & Al-Sadi, R. The signal transduction pathway that mediates the effect of interleukin-1 beta on the Na+ -K+
-ATPase in LLC-PK1 cells. Pflugers Arch. 448, 231–238 (2004) .
17. Zeidel, M. L., Brady, H. R. & Kohan, D. E. Interleukin-1 inhibition of Na+ -K+ -ATPase in inner medullary collecting duct cells: role
of PGE2. Am. J. Physiol. 261, 1013–1016 (1991).
18. Zeidel, M. L. Hormonal regulation of inner medullary collecting duct sodium transport. Am. J. Physiol. 34, 159–173 (1993). 19. Ortiz, P. A. & Garvin, J. L. Role of nitric oxide in the regulation of nephron transport. Am. J. Physiol. Renal Physiol. 282, 777–784
(2002).
20. McKee, M., Scavone, C. & Nathanson, J. A. Nitric oxide, cGMP, and hormone regulation of active sodium transport. Proc. Natl. Acad. Sci. USA 91, 12056–12060 (1994) .
21. Tsantikos, E. et al. Interleukin-6 trans-signaling exacerbates inflammation and renal pathology in lupus-prone mice. Arthritis Rheum. 65, 2691–2702 (2013).
22. McHale, J. F., Harari, O. A., Marshall, D. & Haskard, D. O. TNF-alpha and IL-1 sequentially induce endothelial ICAM-1 and VCAM-1 expression in MRL/lpr lupus-prone mice. J. Immunol. 163, 3993–4000 (1999).
23. Chun, H. Y. et al. Cytokine IL-6 and IL-10 as biomarkers in systemic lupus erythematosus. J. Clin. Immunol. 27, 461–466 (2007). 24. Sun, K. H., Yu, C. L., Tang, S. J. & Sun, G. H. Monoclonal anti-double-stranded DNA autoantibody stimulates the expression and
release of IL-1beta, IL-6, IL-8, IL-10 and TNF-alpha from normal human mononuclear cells involving in the lupus pathogenesis. Immunology 99, 352–360 (2000).
25. Dandona, P., Fonseca, V. & Baron, D. N. Hypoalbuminaemic hyponatraemia: a new syndrome? Br. Med. J. 291, 1253–1255 (1985). 26. Mastorakos, G., Weber, J. S., Magiakou, M. A., Gunn, H. & Chrousos, G. P. Hypothalamic-pituitary-adrenal axis activation and
stimulation of systemic vasopressin secretion by recombinant interleukin-6 in humans: potential implications for the syndrome of inappropriate vasopressin secretion. J. Clin. Endocrinol. Metab. 70, 934–939 (1994).
27. Ohta, M. & Ito, S. Hyponatremia and inflammation. Rinsho Byori 47, 408–416 (1999). 28. Shin, J. I. et al. Kawasaki disease and hyponatremia. Pediatr. Nephrol. 21, 1490–1491 (2006).
29. Park, S. J. et al. Hyponatremia may reflect severe inflammation in children with febrile urinary tract infection. Pediatr. Nephrol. 27, 2261–2267 (2012).
30. Park, S. J. & Shin, J. I. Inflammation and hyponatremia: an underrecognized condition? Korean J. Pediatr. 56, 519–522 (2013). 31. Oh, J. Y. & Shin, J. I. Syndrome of inappropriate antidiuretic hormone secretion and cerebral/renal salt wasting syndrome:
Author Contributions
J.I.S., S.J.P., C.H.S., S.Y.H., G.H.L., M.W.H., D.S.K. and J.H.K. designed study, coordinated data acquisition, performed the statistical analysis, interpreted the data, drafted and revised the manuscript. All authors read and approved the final manuscript.
Additional Information
Supplementary information accompanies this paper at http://www.nature.com/srep Competing financial interests: The authors declare no competing financial interests.
How to cite this article: Shin, J. I. et al. Hyponatremia in patients with systemic lupus erythematosus. Sci. Rep. 6, 25566; doi: 10.1038/srep25566 (2016).
This work is licensed under a Creative Commons Attribution 4.0 International License. The images or other third party material in this article are included in the article’s Creative Commons license, unless indicated otherwise in the credit line; if the material is not included under the Creative Commons license, users will need to obtain permission from the license holder to reproduce the material. To view a copy of this license, visit http://creativecommons.org/licenses/by/4.0/