저작자표시-비영리-변경금지 2.0 대한민국 이용자는 아래의 조건을 따르는 경우에 한하여 자유롭게 l 이 저작물을 복제, 배포, 전송, 전시, 공연 및 방송할 수 있습니다. 다음과 같은 조건을 따라야 합니다: l 귀하는, 이 저작물의 재이용이나 배포의 경우, 이 저작물에 적용된 이용허락조건 을 명확하게 나타내어야 합니다. l 저작권자로부터 별도의 허가를 받으면 이러한 조건들은 적용되지 않습니다. 저작권법에 따른 이용자의 권리는 위의 내용에 의하여 영향을 받지 않습니다. 이것은 이용허락규약(Legal Code)을 이해하기 쉽게 요약한 것입니다. Disclaimer 저작자표시. 귀하는 원저작자를 표시하여야 합니다. 비영리. 귀하는 이 저작물을 영리 목적으로 이용할 수 없습니다. 변경금지. 귀하는 이 저작물을 개작, 변형 또는 가공할 수 없습니다.
A DISSERATION
FOR THE DEGREE OF DOCTOR OF PHILOSOPHY
Constitutive type I IFN regulates phenotypic and
functional heterogeneity of naïve CD:
+T cells
based on self-reactivity
자가반응성에 기반한 항존적 제 ? 유형 인터페론의
naïve CD:
+T
세포 표현형 및 기능의 다양성 조절
January ABAB
By
Young-Jun Ju
Department of Agricultural Biotechnology
Graduate School
A dissertation submitted in partial fulfillment
of the requirements for the degree of
Doctor of Philosophy
Young-Jun Ju
Department of Agricultural Biotechnology
Graduate School
Abstract
In a steady-state, naïve CDK+ T cells have been defined as a homogeneous
population through low and high expression of CDPP and CDQRL, respectively. However, recent studies have demonstrated that CDThi naïve CDK+ T cells with
a number of surface molecules being differently expressed consisted of heterogenic population. In the present study focused on LyQC that is specifically expressed only on CDThi naïve CDK+ T cells at steady-state mice.
The LyQC induction in CDK+ T cells is known to be increased by type I
interferon (IFN). However, it needs to be further revealed how precisely generation of LyQC+ naïve CDK+ T cells are regulated at molecular level in the
extra-thymic environment at steady-state, and whether or not self-reactivity is involved in the generation of LyQC+ naïve CDK+ T cells. Furthermore, it also
remained to be uncovered whether the type I IFN induces not only the generation of LyQC+ naïve CDK+ T cells but also functional features, such as
clonal expansion and differentiation capacity, in acute viral infection.
The results showed that constitutive type I IFN induced generation of LyQC+
naïve CDK+ T cells in steady-state mice, in which the generation was enhanced
by self-T cell receptor (TCR) engagement. The effect of constitutive type I IFN was most prominent for the naïve CDK+ T cell with higher intrinsic
self-reactivity than lower counterpart, which is positively correlated to the expression level of CDT. Hence the greater heterogeneity has seen in CDThi
responsiveness to cytokines, especially type I IFN, and to high affinity of TCR contact with self-peptides.
The results further suggested that the constitutive type I IFN signal influences not only the induction of LyQC+ naïve CDK+ T cells but also their effector
function-related genetic landscape (T-bet, Eomes, IL-,-Rap, and CCL2) and pro-inflammatory cytokine production, especial to IFN-g. Furthermore, LyQC+
naïve CDK+ T cells favored to be differentiated into short-lived effector cell
(SLEC) while CDTlo naïve CDK+ T cells favor memory precursor effector cell
(MPEC) in lymphocytic choriomeningitis virus (LCMV) infection model. Same with the effector precursor differentiation, CDTlo naïve CDK+ T cells have
generated more memory CDK+ T cells than LyQC- or LyQC+ naïve CDK+ T cells.
Furthermore, by temporally blocking of interferon alpha receptor Z (IFNARZ) in the steady-state mice, LyQC+ naïve CDK+ T cells were increasingly
differentiated into MPEC while reducing SLEC differentiation. It suggested that constitutive type I IFN exposed during steady-state can affect the fate decision of naïve CDK+ T cells between MPEC and SLEC in LCMV infection
models.
Collectively, this study demonstrated that the effect of constitutive type I IFN on naïve CDK+ T cells is closely related to its self-reactivity and directly affects
their phenotype and effector function. Also type I IFN affected differentiation fate of naïve CDK+ T cells between SLEC and MPEC upon LCMV infection
model. At the best of my knowledge, this is the first to demonstrate that the differentiation fate in infection had been pre-determined within naïve T cell
phase dependent on type I IFN together with self-reactivity.
Keywords: Naïve CDK+ T cell, Self-reactivity, Constitutive type I IFN, SLEC,
MPEC, LCMV
Contents
Abstract ... I List of Figures ... VI List of Tables ... VII List of Abbreviations ... VIII
I. Literature review ... 1
1. Type I interferon ... 1
1.1. General feature of type I interferon ... 1
1.1.1. Discovery of interferon ... 1
1.1.2. Production of type I IFN ... 2
1.2. Regulation of type I IFN signaling ... 3
1.2.1. Initiation of type I IFN signals via JAK/STAT ... 3
1.2.2. Suppression of type I IFN signaling ... 5
1.3. Type I IFN on T cell immunity ... 6
1.3.1. Constitutive expression of type I IFN ... 6
1.3.2. Robust activation of type I IFN by external stimulation ... 7
2. CD8+ T cells ... 9
2.1. General characteristics ... 9
2.1.1. Developmental stage in thymus ... 9
2.1.2. Phenotypic categorization of CD8+ T cell ... 10
2.2. Features of naïve CD8+ T cells ... 12
2.2.1. Homeostatic maintenance ... 12
2.2.2. Differential expression of CD5 and consequential immune response ... 13
2.2.3. Classical linear differentiation pathway ... 16
2.2.4. Further perspective: new beginning at the effector precursor ... 17
3. Research rationale ... 20
II. Introduction ... 22
III. Materials and Method ... 27
IV. Results ... 34
V. Discussion ... 81
VI. Literature Cited ... 92
List of Figures
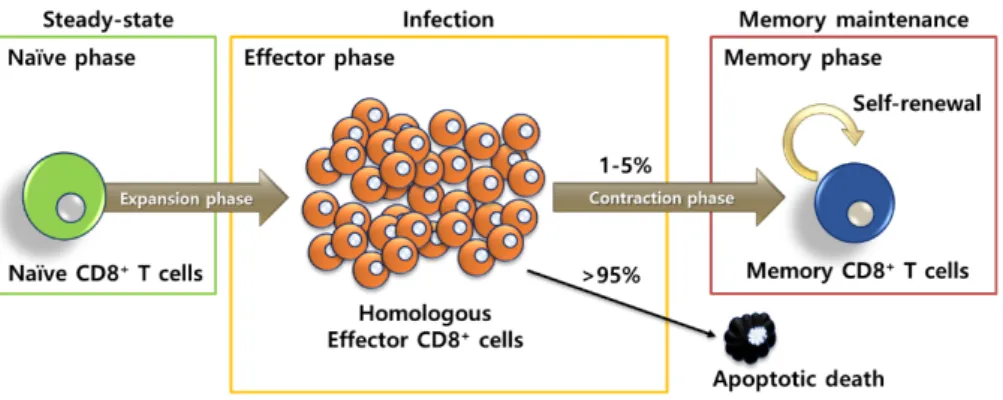
Figure 1. Cartoon of linear memory differentiation model. ... 16 Figure 2. Cartoon for effector precursor differentiation model. ... 18 Figure 3. Cartoon for summary of research rationale. ... 21 Figure 4. Naïve CD8+ T cells maintain heterogeneous phenotypes developed
following their CD5 expression. ... 38 Figure 5. Generation of Ly6C+ naïve CD8+ T cells is tightly regulated by Type
I IFN and self-TCR engagement. ... 44 Figure 6. Naïve CD8 T cell subsets have distinguishable genetic landscape. 49 Figure 7. Type I IFN enhances to cytokine production ability of naïve CD8+ T
cell subsets. ... 55 Figure 8. The expansion of Ly6C+ subsets is superior to Ly6C- subsets during
LCMV infection. ... 61 Figure 9. Naïve CD8+ T cell subsets have distinct preference for effector
precursor differentiation. ... 69 Figure 10. CD5lo cells have the best potential in long-term memory generation
among the three naive CD8+ T cell subsets. ... 73
Figure 11. Type I IFN modulates to pre-determined unique traits of naïve CD8+ T cell subsets in LCMV infection. ... 79
Figure 12. Novel findings from part I and II. ... 85 Figure 13. Novel findings from part III. ... 90
List of Tables
Table 1. Summary of three types of I IFN family. ... 2 Table 2. Responsiveness of CD5lo and CD5hi T cells in infection studies. ... 15
List of Abbreviations
BACHA BTB domain and CNC homolog R
Bak BclR-antagonist/killer
BclA/O/XL B cell lymphoma R/Q/XL Bim
(BCLAL??)
Bcl-R-like protein ZZ
Blimp-?
(Prdm%) B lymphocyte-induced maturation protein-Z (PR domain zinc finger protein ,)
CDS/CD:SP CDP/CDK single-positive
CKA Casein kinase R
CXCLU CXC-chemokine ligand m
DAMP Damage-associated molecular pattern
DN Double-negative
Eomes Eomesodermin
FOXO? Forkhead box protein O Z
GAS Gamma-interferon activated site
GSEA Gene set enrichment assay
HDAC?/A Histone deacetylase Z/R
IDA/Z DNA-binding protein inhibitor R/\
IFN Interferon
IFNAR?/A Interferon alpha receptor Z/R
IFNGR Interferon gamma receptor
IL Interleukin
IRF?/U Interferon regulatory factor Z/m
ISG Interferon-stimulated gene
ISRE Interferon-stimulated response element sequence
ITAM Immunoreceptor tyrosine-based activation motif
JAK Janus kinase
KLRG? Killer cell lectin-like receptor G Z
LCMV Lymphocytic choriomeningitis virus
LEF? Lymphoid enhancer binding factor Z
LM Listeria monocytogenes
MHC class I Major histocompatibility class I
MP Memory phenotype
MPEC Memory precursor effector cell
mTOR Mammalian target of rapamycin
MX? Myxovirus resistance Z
NCR Natural cytotoxicity receptor
NK cell Natural killer cell
OAS Oligoadenylate synthase
PAMP Pathogen-associated molecular pattern
pDC Plasmacytoid dendritic cell
PKCβ/δ Protein kinase C β/δ
PMA Phorbol myristate acetate
RAG Recombination-activating gene
SCID Severe combined immunodeficiency
SHA Src homology R
SHPA SHR domain-containing protein tyrosine phosphatase R
SINZA SIN\ transcription regulator homologue A
SLEC Short-lived effector cell
STAT?/A/Z/S/_ Signal transducer and activator of transcription Z/R/\/P/T T-bet (Tbx)%) T-box transcription factor
TAP? Transporter associated with antigen processing Z
TCF` Transcription factor q
TCR T cell receptor
TEC Thymic epithelial cell
TLR Toll like receptor
TYKA Tyrosine kinase R
I. Literature review
1. Type I interferon
1.1. General feature of type I interferon
1.1.1. Discovery of interferon
It has been discovered that a meaningful soluble factor from culture supernatant from pieces of chorio-allantoic membrane treated with heat-inactivated influenza virus can inhibit propagation of live influenza virus, named as interferon [1]. Since its discovery, over 50 years, interferon (IFN) has been studied as one of the most well-known soluble factors for survival, proliferation and differentiation of various immune and non-immune cells in vitro and in
vivo.
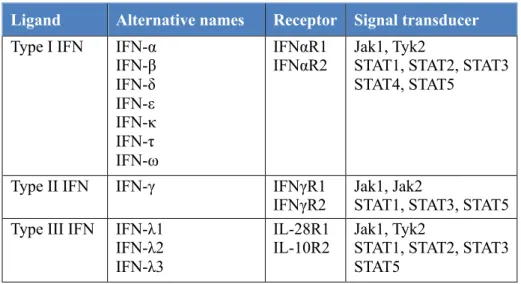
Basically, there are three types of IFN family, type I IFN, type II IFN (IFN-γ) and type III IFN (IFN-λ1, IFN-λ2, and IFN-λ3) [2] (Table 1). Especially, type I IFN consist of 14 functional IFN-α genes in mice (13 in human) and other subtypes of IFN-β, IFN-δ, IFN-ε, IFN-κ, IFN-τ, and IFN-ω. When those substances provoke to molecular signals through with the recognition by their specific receptors, they usually utilize JAK/STAT molecules for deliver the signals to down-stream pathways.
Table 1. Summary of three types of I IFN family.
Ligand Alternative names Receptor Signal transducer
Type I IFN IFN-α IFN-β IFN-δ IFN-ε IFN-κ IFN-τ IFN-ω IFNαR1 IFNαR2 Jak1, Tyk2
STAT1, STAT2, STAT3 STAT4, STAT5
Type II IFN IFN-γ IFNγR1
IFNγR2 Jak1, Jak2 STAT1, STAT3, STAT5 Type III IFN IFN-λ1
IFN-λ2 IFN-λ3
IL-28R1 IL-10R2
Jak1, Tyk2
STAT1, STAT2, STAT3 STAT5
1.1.2. Production of type I IFN
The concentration of type I IFN in general is dramatically increased upon infectious condition in blood stream as well as local tissues. It has been well-known that the highest amount of type I IFN under the infectious condition is produced by plasmacytoid dendritic cells (pDCs) through the stimulation of toll-like receptor (TLR) 7 and TLR9 [3, 4]. The pDC is arguably the strongest producer of type I IFN, but it is a limited fact only when the host has been infected or laid on the inflammatory condition [5, 6].
Recent studies have intensively suggested the importance of type I IFN, either constitutively produced or pre-existing, in uninfected host. Although it had been hard work to detect the exact concentration of constitutively produced type I IFN, recent studies have showed that basal level of type I IFN is evidently
produced in human and mice by measuring the mRNA level and suggesting developmental defect of thymus within IFNα receptor 1 knock out mice (IFNAR1 KO) [7-10]. Detection of type I IFN expression has been visualized by using IFN-β luciferase reporter mice [8]. Furthermore, the study showed that type I IFN is produced in not only lymphoid but also non-lymphoid organs, especially higher in the thymus than other lymphoid organs.
1.2. Regulation of type I IFN signaling
1.2.1. Initiation of type I IFN signals via JAK/STAT
The canonical signaling component of type I IFN is composed of IFNAR, signal transducer and activator of transcription 1 (STAT1), STAT2, IFN-regulatory factor 9 (IRF9), Janus kinase 1 (JAK1), and tyrosine kinase 2 (TYK2). All cells having these molecules in the cytoplasm of and play a role in binding to the heterodimers of IFNAR1 and IFNAR2. By the engagement of type I IFN to their receptors, activated JAK1 and TYK2 phosphorylates the IFNAR, followed by recruits and phosphorylates STAT protein. Then, the phosphorylated STAT proteins form dimer that acts as transcription factors to translocation into nuclear, and induce the activation of IFN-stimulated genes (ISGs) [11].
It has been uncovered that two predominant STAT complexes are formed in response to type I IFN, and that each can control distinct gene expression
program. The complex recruited with phosphorylated STAT1 (pSTAT1), pSTAT2, and IRF9, named interferon-stimulated gene factor 3 (ISGF3) [12] in cytoplasm translocate into nucleus and then bind to IFN-stimulated response element sequences (ISRE) to activate classical antiviral genes, such as
2ʹ-5ʹ-oligoadenylate synthase (OAS) and myxovirus resistance 1 (MX1) [13, 14].
Whereas, homodimer complex of pSTAT1 binds to gamma-interferon activated site sequences (GASs) to provoke the expression of pro-inflammatory genes, such as IRF1 and CXC-chemokine ligand 9 (CXCL9) [15, 16].
Another canonical signaling pathway for type I IFNs is the utilization of STAT3 homodimers. IFNα-activated STAT3 homodimers indirectly inhibit interferon stimulated genes (ISGs) by binding to transcriptional repressors, which are not well understood. On the other hand, IFNα-activated STAT3 homodimer can bind to co-repressor complex SIN3 transcription regulator homologue A (SIN3A) [17, 18]. The SIN3A which contains HDAC1 and HDAC2 suppresses induction of STAT3 target genes by promoting de-acetylation of STAT3 and histones [19]. Indeed, although STAT3 was sufficiently phosphorylated by the typical type I IFN signal, the reason for the lack of expression of STAT3 target genes had remained unknown. However, several studies, using SI3A knockdown system, showed to increase of STAT3 target genes suggesting that STAT3 can counterbalance type I IFN-induced STAT1 and ISGF3 function [19].
1.2.2. Suppression of type I IFN signaling
Suppression of type I IFN signaling plays an important role on the regulation of broad biological situations, including exacerbation of disease or lethality, both acute and chronic diseases, and toxicities [20]. The type I IFN signaling can be suppressed by downregulation of IFNAR and/or induction of negative regulators. The negative regulators as a part of negative feedback loop to suppress excessive type I IFN responses. The SOCS, the most well-defined negative regulators of type I IFN signaling, targets to tyrosine kinase activity of JAK to inhibit their function to phosphorylate IFNAR. Especially, the SOCS1 and SOCS3 that suppress phosphorylation of JAK1, TYK2, and STAT1 are the most potent negative regulator of type I IFN signaling [21]. Of these, SOCS1 has been known to inhibit type I IFN signaling more directly. Overexpression of the SOCS1 has shown inhibition of type I IFN-induced antiviral and anti-proliferative responses [21-23]. SOCS3 has been reported to inhibit IL-6 family signaling, but is also involved in suppressing type I IFN-mediated antiviral responses [24]. The downregulation of IFNAR can be induced by stimulation of interleukin (IL)-1, TLR4, immunoreceptor tyrosine-based activation motif (ITAM)-associated receptors, and oxidative and metabolic stress [25-27]. The best known internalization mechanism of IFNAR is induced by p38-mediated phosphorylation of IFNAR. Phosphorylation by p38 provokes CK2-mediated phosphorylation of IFNAR1, thereby increasing receptor internalization, ubiquitination and degradation [28]. On the other hand, recruitment of protein kinase C (PKC) β/δ or SH2 domain-containing protein
tyrosine phosphatase (SHP)2 to IFNAR also suppresses type I IFN signaling through dephosphorylation of signaling intermediate, such as JAK1 [29].
1.3. Type I IFN on T cell immunity
1.3.1. Constitutive expression of type I IFN
It has been suggested that tiny amount of type I IFN is constitutively maintained although host have never been infected with foreign antigen. These constitutive type I IFN has been postulated to be induced by on-going low-grade exposure to food antigen, commensal microbes, stimuli during tissue remodeling and damage, acting as important biological function of immune cells [30] (e.g. proliferation of hematopoietic stem cells [31, 32], development of NK and B cells [33, 34], macrophages function and homeostasis [35, 36]). In the field of T cell study, it is important to note that most studies have addressed the role of type I IFN in activating or activated, not naïve CD8+ T cells.
Recent studies have suggested T cells require constitutive type I IFN as regulatory factor during their development in thymus and functional modification in periphery. It has been reported that type I IFN signal deficient CD4 single-positive (CD4SP) and CD8 single-positive (CD8SP) thymocytes shows their phenotypic abnormality, reduction of absolute cell number, and diminished expression of STAT1 within their final step of maturation in thymus. It has suggested that constitutive type I IFN signaling is importantly involved
in maturation from thymocytes into naive T cells [10]. In addition, it has been shown that the phenotype, function and age-dependent expansion of CD44hiCD49dlo virtual memory (VM) CD8+ T cells are strongly affected in the
absence of type I IFN signaling by eomesodermin (eomes)-dependent fashion [37].
Even though aforementioned studies suggested importance of constitutive type I IFN in certain kind of CD8+ T cells and development of thymocytes, it was
paradoxically unrevealed the role of constitutive type I IFN to functionality of peripheral T cells [10, 37, 38]. Thus, it remains yet to be unveiled whether the constitutive type I IFN exposed during the steady-state condition could affect functional modification of peripheral naïve T cells.
1.3.2. Robust activation of type I IFN by external stimulation
A high amount of type I IFN is rapidly produced upon viral or bacterial infection. It is a frontline of defense mechanism, activating innate immune cells including DCs, macrophages, and NK cells [39]. Although type I IFN can be produced in almost all cells by recognizing the pathogen associated molecule patterns (PAMPs) or damage associated molecule patterns (DAMPs) in virus or bacterial infection [40-42], the most common source of robust type I IFN production during virus or bacterial infection has been known as TLR7- and TLR9-stimulated pDCs [43, 44].
Robust concentration of type I IFN produced in inflammatory condition affects various immune cells, as mentioned earlier. T cells are directly or indirectly affected by strong type I IFN stimulation. It has been shown that the clonal expansion and granzyme B production of effector CD8+ T cells are reduced in
IFNAR1-/- mice infected with lymphocytic choriomeningitis virus (LCMV)
[45]. It has been also reported the clonal expansion of CD8+ T cells in mice with
LCMV infection is accompanied by high phosphorylation of STAT4, not STAT1, by robust type I IFN [46]. And it has been confirmed that the high phosphorylation of STAT4 was seen only in the effector state of antigen-specific CD8+ T cells, and, interestingly, it was not observed in IFNAR1
deficient mice [47].
Together with the clonal expansion, the other direct role of robust type I IFN in LCMV infection is to protect the proliferating effector CD8+ T cells against
death by activated NK cells [48, 49]. NK cells has been well-reported to show strong cytolytic function against physiologically stressed cells such as tumor cells and virus-infected cells. The increased expression level of MHC class I and natural cytotoxicity receptor (NCR) ligand by robust type I IFN in LCMV infection plays an important role in selecting target cells for NK cells to attack [50]. It was reported that IFNAR1 deficient effector CD8+ T cells cannot
increase the expression of MHC class I and NCR ligand, consequently killed by NK cells [48, 49].
Together with the direct effect of robust type I IFN, it has been reported to affect T cells indirectly by controlling the function of DCs [51-53]. DC is one of the
most essential and well-studied innate immune cell that are directly required to CD8+ T cells for priming and antigen-presentation in infection situation [54]. A
study has reported that robust type I IFN produced early in LCMV infection directly enhances the cross-priming ability of DCs, making CD8+ T cells
possess more potent cytotoxicity. They also have suggested that this robust ability of type I IFN could improve cytotoxic capacity of CD8+ T cells without
the help of CD4+ helper T cells, and IFN-β administration alone was sufficient
without the need for LCMV infection [55]. The other study has shown that the expression of both IL-15 and the IL-15 receptor α-chain are increased by stimulation of poly(I:C) or IFN-α/β in DCs, and then co-stimulatory molecule and IFN-γ production in the DCs were increased by the autologous IL-15 and IFN-α/β. Consequently, the enhanced ability of DC induced to stronger clonal expansion of CD8+ T cells [51].
2. CD8
+T cells
2.1. General characteristics
2.1.1. Developmental stage in thymus
CD8+ T cells are developed at the thymus after migrating as T cell precursors
generated in the bone marrow. Then, CD8+ T cells underwent a series of
preprogrammed process, called β-selection followed by the positive selection and negative selection [52]. In the first step of CD8+ T cell development,
double-negative (DN) thymocytes expressing incomplete TCR (pre-TCR) received pre-TCR signaling for rearrangement of TCR β-chain, then underwent proliferation and expression of complete TCRβ [53]. In the next step, double-positive (DP) thymocytes are educated further by double-positive and negative selection. In the positive selection, ‘death by neglect’ happened, and a small number of thymocytes with TCR affinity to self-peptide loaded MHC (self-pMHC) survived [56]. Among the survivors of positive selection, thymocytes with too strong TCR affinity to self-pMHC, chosen once more by negative selection, are removed [57]. During the positive and negative selection, the CD8+ T cells are continuously receive self-TCR signals by contact with thymic
epithelial cells (TECs), which is known to assign the expression level of CD5 [58]. In general, CD5 acts as a negative regulator of self-TCR signals received during the thymic selection. Although the level of CD5 on CD8+ T cells remains
stable in periphery, the physiological function in periphery is not clear [59]. Thus, CD8+ T cells with fixed CD5 levels through thymic selection act as a
defense against external antigens in periphery. Indeed, research is needed to determine how the levels of CD5 in thymus can affect their defensive actions.
2.1.2. Phenotypic categorization of CD8
+T cell
About 1 million mature CD8+ T cells, egressed from thymus to periphery every
day in mice, are maintained the pool to ~25 million cells that contains under 100 microbial peptide specific cells per every clone [60]. Mature CD8+ T cell
pool maintains quiescence and stays in homeostasis. It was noting that CD8+ T
cells at the quiescent stage expressed CD44 and CD62L that are known to be the marker for the activation status of CD8+ T cells. However, they have also
been used widely to categorize the population of CD8+ T cells into naïve
(CD44loCD62Lhi) and memory phenotype (MP; CD44hiCD62L-/+) [61].
Recently, the expression level of CD5 has been used as a surface marker to categorize sub-population of naïve CD8+ T cells as well. While surface
expression of CD44 and CD62L can be rapidly changed, CD5 maintains at relatively stable level in thymus even though T cells are proliferating. During the thymic selection, CD8 single-positive (SP) cells express broad spectrum of CD5 molecules gained by entire avidity of self-peptide loaded MHC (self-MHC) and TCR [58]. It has been well reported that, in thymus, the expression of CD5 acted as a negative regulator of TCR signaling [58, 62], while it is unclear in periphery [59]. So, the expression level of CD5 in periphery is broadly accepted as a surrogate marker of TCR reactivity, not functional molecule [63]. However, because its expression on naïve CD8+ T cells is actively maintained
by continuous and obligatory contact with self-pMHC, researchers are still wondering why CD8+ T cells maintain their CD5 levels consistently, and
2.2. Features of naïve CD8
+T cells
2.2.1. Homeostatic maintenance
It is quite important to maintain number of naïve CD8+ T cells to construct
immune defense system against foreign antigen. Thus, the study of survival factors to maintain adequate number of naïve CD8+ T cells has been ongoing
[64]. The best known essential factors, required to survival of naïve CD8+ T
cells, are TCR signals from self-pMHC (shortly, self-TCR signals) and IL-7 receptor (IL-7R) signals [65]. It has been reported that depriving TCR contact with MHC class I molecules [66, 67] or ablating TCR expression [68, 69] causes naïve CD8+ T cells to die within several weeks. Also naïve CD8+ T cells
die within 1–2 weeks of transfer into IL-7−/− hosts [70] or after conditional
deletion of IL-7R [71]. Both self-TCR and IL-7R signals have been well reported to upregulate pro-survival molecules (e.g. Bim, Bcl-2, and Bcl-xL etc.
[72]) and inhibit pro-apoptotic molecules (e.g. Bax, Bak, and caspase 9 etc. [73]). In addition to survive longer, another mechanism for maintaining the pool of naïve CD8+ T cells is to maintain numbers through division in periphery.
Every peripheral naïve CD8+ T cells intermittently do the slow turnover, called
homeostatic proliferation, around 20 times in their lifetime after emigrant from the thymus [65]. Interestingly, the previous studies showed that naïve CD8+ T
cells which have deficient or reduced self-TCR and IL-7R signals showed a reduced homeostatic proliferation in lymphopenic condition in mouse model [74-77]. Therefore, self-TCR and IL-7 are crucial factors to not only survival but also homeostatic proliferation of naïve CD8+ T cells.
Another suggested role of homeostatic proliferation in some naïve T cells is to conversion into memory phenotype cells. When transferring naïve CD8+ T cells
into RAG recombinase deficient (RAG-/-) mice or severe combined
immunodeficiency (SCID) mice, a few cells showed a very rapid division rate in a IL-7 dependent manner [78]. In addition, such fast proliferation of naïve CD8+ T cells seems to be similar to the natural lymphopenia-induced
proliferation seen in neonatal mice that is a gut-microbiota dependent [79]. Then, the naïve CD8+ T cells acquire the activation markers as if they were
activated by foreign antigen stimulation to form a memory phenotype pool [80]. Even though local high concentrations of common γ-chain cytokines (e.g. IL-2, IL-7, and IL-15) [81], transient absence of negative signals (e.g. CD24, TAM receptors, PD-1 and CTLA-4) [82, 83], TCR revision by continuous stimulation of self-antigens [84] have been known to induce the conversion from naïve to memory phenotype, it is still unclear why a very little proportion of naive T cells continue to proliferate slowly and form memory phenotype cells in normal unimmunized mice.
2.2.2. Differential expression of CD5 and consequential immune
response
As aforementioned, crucial role of CD5 in thymocytes has been well reported, however it remained still unclear its role in peripheral naïve T cells. Moreover, functional ligand of CD5 is unknown although a few past studies suggested
CD72 and CD5L as possible ligands [85, 86]. So it has been widely accepted that CD5 is thought to reflect only the strength of self-reactivity, and persisting on peripheral naïve T cells as a footprint of thymic selection [58]. Actually, the naïve T cells express broad spectrum of CD5 level, and it is reported that the responsiveness of the cells are changed according to the high and low expression level of CD5 in external stimulation, such as homeostatic proliferation and foreign antigens [52]. It has been reported that CD5hi cells
(naïve T cells expressing high level of CD5) have a stronger reactivity to γc cytokines (e.g., IL-2, IL-7, and IL-15) than CD5lo cells (naïve T cells expressing
low level of CD5) [87, 88]. So CD5hi cells have been known to have a faster
homeostatic proliferation than CD5lo cells because reactivity to γc cytokines is
the most important factor to determine the speed of homeostatic proliferation [87, 88]. Consistent with these studies, it has been also proven that CD5hi cells
have superior responsiveness to viral or bacterial infection than CD5lo cells,
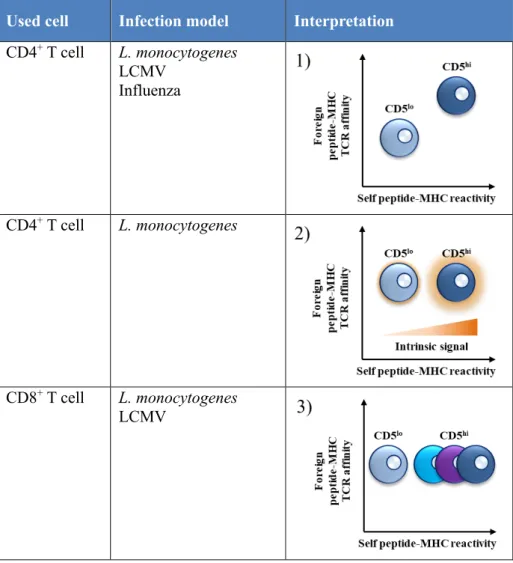
thus consequently much more vigorous generation of long-term memory cells [89-91]. The studies have suggested different interpretations of why CD5hi cells
are more reactive than CD5lo cells. It was suggested that CD5hi CD4+ T cells
have higher TCR binding affinity for foreign antigen epitopes than CD5lo CD4+
T cells in Listeria monocytogenes (LM), LCMV, and influenza virus infection (Table 2.1) [89]. Another study using CD4+ T cells in L. monocytogenes
infection has suggested that CD5hi CD4+ T cells have higher signaling intensity
for the same stimulus than CD5lo CD4+ T cells, and thus have high
(Table 2.2) [90]. A study using CD8+ T cells in LCMV and L. monocytogenes
infection has suggested that CD5hi cells have a more heterogeneous population
which contains cells ready to be activated than CD5lo cells, and thus have high
responsiveness although they have had a similar TCR binding affinity (Table 2.3) [91].
Table 2. Responsiveness of CD5lo and CD5hi T cells in infection studies.
Used cell Infection model Interpretation
CD4+ T cell L. monocytogenes LCMV Influenza CD4+ T cell L. monocytogenes CD8+ T cell L. monocytogenes LCMV
As mentioned above, although several researchers have struggled to interpret the different characteristics between CD5lo and CD5hi cells, it still remains to
be questioned what makes CD5hi cells different from CD5lo cells.
2.2.3. Classical linear differentiation pathway
Previous studies have suggested that the differentiation process of effector and memory CD8+ T cells from naïve CD8+ T cells are accompanied through the
series of linear differentiation like Naïve à Effector à Memory [92]. In this model, most of T cell pool is thought to have relatively homologous features during effector phase of infection, then the potential to memory differentiation is also expected to quite equivalent within effector T cell pool. Therefore, it was thought that the competition for, or withdrawal from environmental resources (e.g. antigen, cytokines, nutrients, and growth factor etc.) can limit the magnitude of T cell response, survival, and memory maintenance (Figure 1) [93].
After the linear differentiation model, another model was subsequently suggested that effector T cells progressively lose their potential to be memory cells by receiving prolonged TCR stimulation during the infection [94]. Although the linear differentiation model had been perfectly fitted to interpret fate of T cell differentiation during chronic infection [95], it had a fatal limitation that only antigenic stimulation was considered to determine the fate of T cells.
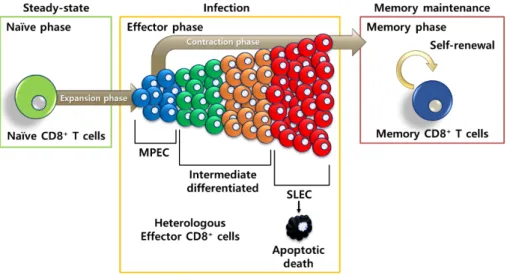
2.2.4. Further perspective: new beginning at the effector precursor
To complement the linear differentiation model, it has been suggested that T cell fates are committed early after the activation by strength of signals, such as TCR, cytokines, and co-stimulatory molecules [96]. By these strength of signals at the early phase of infection, effector CD8+ T cell fate is committed
by each effector precursor with entirely different feature. Before the proposal for effector precursors, effector CD8+ T cells were known to have homogenous
functions and phenotypes (e.g. CD44hi and CD11ahi) [97]. Later, effector CD8+
T cells were categorized by expression of several differential molecules, such as KLRG1 and CD127 (IL-7R), since then effector CD8+ T cells need to be
classified into two major subsets as memory precursor effector cells (MPEC; KLRG1loCD127hi) and short-lived effector cells (SLEC; KLRG1hiCD127lo) [98,
99]. It has been demonstrated that, at the peak of CD8+ T cell response during
(IL-7Rhi) with better memory potential than cells expressing low IL-7R (IL-7Rlo)
[99-101]. Therefore, based on the expression level of IL-7R, effector CD8+ T
cells can be categorized into MPEC and SLEC. The MPECs are relatively smaller subsets within the effector CD8+ T cells and not fully committed to
long-term memory cells, even they possess certain effector functions [96]. MPECs have properties to produce more IL-2 and have better multi-potency, especially be differentiated into long-term memory cells, than SLECs [102-104]. On the other hand, SLECs are the most abundant subsets among effector CD8+ T cells, and most of them are going to die after effector period of the
infection [54]. Because SLECs are terminally differentiated status within effector CD8+ T cells, it is conceivable that SLECs are more sensitive to cell
death than MPECs and no longer be able to differentiate into long-term memory cells (Figure 2) [98, 104].
Then it had been wondered which transcription factors could determine the fate of the effector CD8+ T cells. It was reported that mTOR is one of the most
crucial factor to decide fate of effector CD8+ T cells through the experiment
that to administrate rapamycin into mice by drinking water has enhanced generation of memory CD8+ T cells in LCMV infection model [105]. Since then,
it has been broadly accepted that reduction of mTOR signals could enhance the generation of memory CD8+ T cells. Since mTOR signals were provoked by
TCR signals, several studies suggested the strength of TCR signals at the early period of infection is the key factor for the commitment of memory cells during the T cell fate decision [106-108]. Together with issue of TCR engagement, there are key transcription factors to regulate differentiation of effector precursor for MPEC and SLEC [109, 110]. MPECs appeared to require IL-7, IL-15 to maintain their specific transcription factors, such as Eomes, Bcl-6, ID3, and STAT3 etc. [111-116]. Whereas, it has been reported that pro-inflammatory cytokine cues (e.g. IL-2, IL-12, and type I IFN) are required to SLEC commitment and induce the transcription factors, such as T-bet, Blimp-1, ID-2, and STAT4 [46, 47, 98, 117, 118].
One of the most important defense mechanisms of CD8+ T cells against foreign
antigens is to generate memory cells that can respond quickly to the same antigens they have experienced. Therefore, numerous studies are designed to find factors related to the mechanism of memory differentiation and to answer how to generate many memory cells within immunized host. At the end of this effort, they could define an effector precursor model and identify several
external factors that could affect MPEC and SLEC differentiation. However, it is still unknown which factors in naïve CD8+ T cells can predict their
differentiation into MPEC or SLEC.
In conclusion, future studies should demonstrate the following: 1) A classification scheme for naïve CD8+ T cell subsets should be established. 2)
Factors influencing naïve CD8+ T cell subset formation and characterization
should be identified. 3) The classification scheme should be used to demonstrate which naïve CD8+ T cells can differentiate into effector precursors
specialized for long-term memory cell formation.
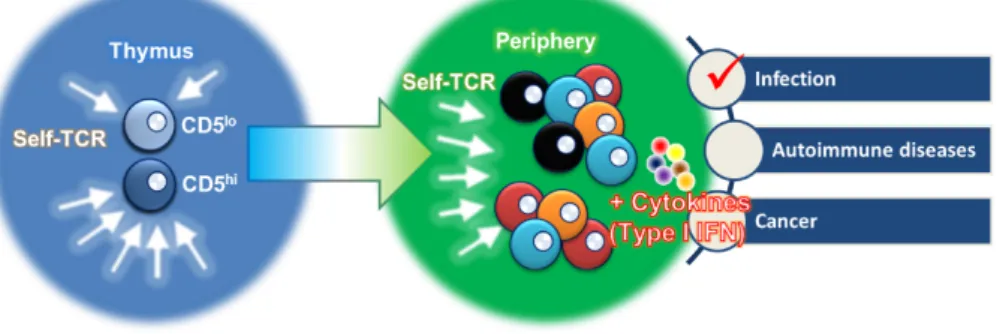
3. Research rationale
The fate of CD8+ T cell at the naïve stage is passing through effector phase and
a memory CD8+ T cell, at which each phase undergoes a significant change.
Peripheral naïve CD8+ T cells developed in the thymus are transformed into
high-heteorogeneity populations through the process of survival, self-renewal and post-thymic maturation by continuous self-TCR and homeostatic cytokine signals. The naïve CD8+ T cells, which have a high-heterogeneous pool,
participate in various immune responses provoked in hosts with certain condition such as infection, autoimmune disease and cancer.
Figure 3. Cartoon for summary of research rationale.
Based on this, the hypothesis of this study was set to “Self-TCR reactivity and exposure to constitutive type I IFN can highly impact to naïve CD8+ T cell pool
and its functionality in LCMV infection”. By verifying the hypothesis, I finally proposed the effects of self-reactivity and constitutive type I IFN on the differentiation of naïve CD8+ T cells into long-term memory CD8+ T cells in
II. Introduction
The contents herewith will be published elsewhere as a partial fulfillment of Young-Jun Ju’s Ph.D. program
Naïve CD8+ T cells, regard as a guardian against foreign antigen after becoming
active cytotoxic CD8+ T cells, go through clonal expansion, differentiation, and
then finally maintained to long-term memory CD8 T cells [109]. It has been well known that ~1 million of naïve CD8+ T cells egress from thymus to
periphery until before mice arrived to thymic atrophy, and they are maintained to ~25 million cells of naïve CD8+ T cell pool which contains to ~100 microbial
peptide specific cells per every clone in mice [60].
Those CD8+ T cells in the pool commonly express CD44 and CD62L molecules.
The high and low levels of CD44 molecules can define the CD8+ T cells as
"naïve (CD44lo)" and "memory phenotype (CD44hi; MP)", and the MP is also
divided into central MP (TCM; CD44hiCD62Lhi) and effector MP (TEM;
CD44hiCD62Llo) based on the expression level of CD62L [61]. Together with
CD44 and CD62L, expression level of CD5 has been studied to divide naïve CD8+ T cells into more subsets.
During the thymic selection, CD8 single-positive (SP) cells express broad spectrum of CD5 molecules gained by entire avidity of self-peptide loaded
MHC (self-MHC) and TCR [58]. While CD44 can be easily upregulated and CD62L be downregulated upon proliferation of CD8+ T cells, CD5 designated
during thymic selection is known to have stable expression. CD5 expression stably maintained via continuous contact with peripheral self-MHC, suggesting that the level of its expression represents to TCR sensitivity of naïve CD8+ T
cells [58, 119]. For the last decade, it has been broadly accepted that CD5 high expressing T cells (CD5hi) have better response than CD5 low expressing T
cells (CD5lo) to lymphopenia-induced homeostatic proliferation [88]. When
compared with responsiveness to foreign antigens, such as Listeria
monocytogenes and lymphocytic choriomeningitis virus (LCMV), CD5hi cells
are more proliferative than CD5lo cells [89-91].
The studies have postulated different reasons why CD5hi cells are more reactive
than CD5lo cells. 1) CD5hi cells have a more heterogeneous population which
contains cells ready to be activated than those of CD5lo cells [91]. 2) CD5hi cells
have higher T cell receptor (TCR) binding affinity for foreign antigen epitopes than CD5lo cells [89]. 3) CD5hi cells have higher signaling intensity for the same
stimulus than CD5lo cells [90]. However, it remains to be answered what makes
CD5hi cells different from CD5lo cells, and whether CD5 can fully classify
heterogeneous naive CD8+ T cells.
Type I IFN produced constitutively in mice after the exposure to pathogen, tissue remodeling and damage. It has been well-reported that constitutively produced type I IFN affects to biological function of immune cells (e.g., proliferation of hematopoietic stem cells [31, 32], developments of NK and B
cells [33, 34], function and homeostasis of macrophages [35, 36]). Most studies on T cell have addressed the role of type I IFN in activating or activated T cells. But, recently, it was reported that absence of type I IFN signaling strongly affects the phenotype, function and age-dependent expansion of CD44hiCD49dlo virtual memory (VM) CD8+ T cells via eomesodermin
(eomes)-dependent fashion [37]. And CD4 single-positive (CD4SP) and CD8 single-positive (CD8SP) thymocytes in the type I IFN signal deficient mice showed their phenotypic abnormality, including reduced absolute cell number, and low expression of STAT1 during final maturation of thymocytes [10]. Even though aforementioned studies have partially revealed on importance of type I IFN in the development of CD8+ T cells and thymocytes, any phenotypic or
functional changes of peripheral T cells due to type I IFN deficiency are not fully understood. Thus, it needs to be unveiled whether the constitutive type I IFN in the steady-state, uninfected, condition affects functional modification of peripheral naïve CD8+ T cells.
Recent studies dealing with functionality of CD8+ T cells have suggested the
model defines two types of effector precursor named as SLEC (short-lived effector cell) expressing low KLRG1 (killer cell lectin like receptor G1) and high CD127 (IL-7Ra) and MPEC (memory precursor effector cell) expressing high KLRG1 and low CD127 [109]. It has been well-reported that SLEC is very sensitive to cell death, has low pluripotency and low IL-2 production capacity, whereas MPEC has strong resistance to cell death, high pluripotency and high IL-2 production capacity [120]. As mentioned above, because these two
effector precursors have quite distinct feature, fate decision of effector CD8+ T
cells between SLEC and MPEC has been one of the most important issues to understand the functionality of CD8+ T cells. Several studies have found out the
transcription factors regulate the differentiation of SLEC or MPEC. It has been suggested that IL-2, IL-12, and type I IFN stimulation provoked in microbial infection actively induce SLEC with upregulation of T-bet, Blimp-1, and Zeb2 [117, 121-123]. In addition, the inflammatory cytokines suggested above downregulates transcription factors important for MPEC differentiation such as Il7r, Sell, Tcf7, Lef1, and Bach2 by inhibiting FOXO1 signal, and consequently leads to SLEC differentiation [124-127].
In this study, the cells were distinguished using CD5 level which has been known to represent self-reactivity within naïve CD8+ T cells, and the analysis
were performed to check differences in signaling intensity and phenotype for type I IFN signals depending on the level of CD5 expression. It was confirmed that these difference in signaling intensity and phenotype confers genetic features that are more responsive to external stimuli of naive CD8+ T cells,
especially in response to pro-inflammatory cytokine stimulation. Also the LCMV infection model was used to determine whether the genetic features and responsiveness to cytokines could affect the immune response to foreign antigens. In the LCMV infection model, it was analyzed whether the differentiation of effector precursor could vary depending on the expression level of CD5 and the effect of constitutive type I IFN exposed during the steady-state period.
Consequently, the objective of this study is to investigate the role of constitutive type I IFN based on difference of self-reactivity in naïve CD8+ T cells.
III. Materials and Method
Mice
C57BL/6 (B6) mice were provided from animal facility of POSTECH purchased from Jackson laboratory. P14, OT-1, IFNAR1-/-, STAT1-/-, IFNGR-/-,
and RAG1-/- mice were provided from Garvan Institute of Medical Research
(Australia). Then, IFNAR1-/- x IFNGR-/-, P14 IFANR1-/-, P14 Rag1-/- mice were bred using each pure strain. All animal experiments were performed following regulation by IACUC guideline of POSTECH and IBS (institute for basic science).
Reagents and antibodies
Recombinant mouse IL-2, IL-4, IL-6, IL-7, IL-12, IL-15, IL-21, IL-23, IFN-γ and TGF-β were purchased from PeproTech. Mouse IFN-β was from PBL Biomedical Laboratories. Peptides (KAVYNFATM (GP33) was purchased from Bioneer. All of the following monoclonal antibodies (mAbs) was purchased from eBioscience and BD Biosciences. Anti-CD3ε (145-2C11), anti-CD4 (RM4-5), anti-CD8α (53-6.7), anti-CD5 (53-7.3), anti-CD24 (1M/69), anti-CD25 (PC61.5), anti-CD27 (O323), anti-CD28 (37.51), anti-CD38 (90), anti-CD44 (IM7), anti-CD45.1 (A20), anti-CD45.2 (104), anti-CD45RA (HI100), anti-CD45RB (C363.16A), anti-CD62L (MEL-14), anti-CD90 (5E10),
anti-CD90.1 (HIS51), anti-CD90.2 (53-2.1), anti-CD98 (RL388), anti-CD103 (2E7), anti-CD122 (5H4 and TM-β1), anti-CD123 (6H6), anti-CD124 (X2/45-12), anti-CD126 (D7715A7), anti-CD127 (A7R34), anti-CD130 (KGP130), anti-CD132 (TUGm2 and 4G3), anti-CD183 (CXCR3-173), anti-Ly6C (HK1.4), anti-TCRβ (H57-597), anti-β2 (TS1/18), anti-β7 (FIB504), anti-GITR (DTA-1), anti-S1P (JM16-66), anti-IFNAR1 (13222-MM08-P; SinoBiological), anti-KLRG1 (2F1), anti-CX3CR1 (2A9-1), and anti-Ki67 (SolA15). Flow cytometry samples were run using a LSRII (customized to use 5 laser), LSRII (4 laser) or FACSCanto II (BD Biosciences) and analyzed by FlowJo software (Tree Star).
T cell preparation, in vitro Ly6C induction, and in vivo proliferation assay.
Cells were purified from pooled lymph nodes (LN) or spleen (SP) following sorting procedures referred in below. For in vitro culture, sorted cells were plated in 96-well plates in complete RPMI 1640 medium. The cultures were supplemented with the cytokines, such as IFN-β (as indicated), IL-2 (10 ng/ml), IL-4 (10 ng/ml), IL-6 (10 ng/ml), IL-7 (10 ng/ml), IL-12 (10 ng/ml), IL-15 (10ng/ml), IL-21 (10 ng/ml), TGF-β (10 ng/ml), and IFN-γ (10 ng/ml), or soluble anti-CD3 mAb (1μg/ml). For proliferation analysis in vivo using CTV, purified naive CD8+ T cells were labeled with CTV (CellTraceTM Violet)
(ThermoFisher) as described [88]. Cell proliferation was analyzed by measuring CTV dilution using flow cytometry.
Intracellular staining.
For intracellular cytokine staining, cells were cultured in vitro with the indicated stimuli (PMA (100 ng/ml), Ionomycin (1000 ng/ml), IL-2 (500 ng/ml), IL-12 (10 ng/ml), IL-18 (10 ng/ml), gp33 peptide (as indicated)), then GolgiPlug (BD Biosciences) was added during the last 5 hr of culture. The cells were stained for cell surface markers, fixed and permeabilized using Cytofix/Cytoperm buffer (BD Biosciences) and then stained with anti-IFN-γ (XMG1.2), anti-IL-2 (JES6-5H4), anti-TNFα (MP6-XT22) using Perm/Wash buffer (BD Biosciences) followed by analysis by flow cytometry; intracellular CD107a and granzyme B staining was examined using anti-CD107a (1D4B) and anti-human granzyme B mAb (GB11) (ThermoFisher).
Immunoblotting.
FACS-purified CD5lo, CD5hiLy6C-, and CD5hiLy6C+ subsets were incubated
with IFN-β (0.1 ng/ml) for indicated time, cell lysates (Tris-Cl 50 mM, pH 7.4, NP-40 0.5%, 0.15 M NaCl, 2 mM EDTA, 10 mM NaF, 10 mM P2O7, 0.5 µM Na3VO4, 100 µg/ml PMSF, 1 µg/ml aprotinin and leupeptin) were prepared and equal amounts of protein were analyzed by 10% SDS-PAGE, transferred onto nitrocellulose membrane (Amersham), blocked for 1 h at 23°C in blocking buffer (5% dry nonfat milk in Tris buffered saline, pH 7.4, containing 0.05%
Tween 20), and immunoblotted with the following monoclonal Abs: phospho-Stat1, phospoho-Stat2. After immunoblotting with these Abs, immunodetection was performed by incubation with horseradish peroxidase-conjugated anti-rabbit IgG (Santa Cruz Biotechnology) and developed with an ECL kit (Amersham).
CD8+ T cell enrichment
Generally, CD8+ T cell enrichment was done by negative selection method of
MACS or BD IMag CD8+ enrichment kit. In polyclonal LCMV infection
experiment, we used Thy1.1+ host mice and CD8+Ly5.1+ donor cells, so
primarily we excluded CD4+ and B220+ cells from total splenocytes by MACS
negative selection kit using anti-CD4, anti-B220, and then secondly excluded host cells by anti-Thy1.1 because only host cells were expressing Thy1.1.
Cell sorting and adoptive transfer
Cell sorting for all experiments was done by Astrios or XDP (Beckman Coulter). To sort, naïve CD8+ T cells were purified from pooled lymph nodes (LN) or
spleen (SP). Generally, we sorted cells to isolate pure CD5lo, CD5hiLy6C-, and
CD5hiLy6C+ subsets. In some experiment, we further sorted to isolate CD5lo,
CD5hiLy6C-, CD5hiLy6C+CD183-, and CD5hiLy6C+CD183+ subsets. Purity of
procedure of each experiment was done by information indicated in each Figure cartoon and Figure legend.
BrdU incorporation assay
Assay in expansion phase of LCMV infection, we injected to BrdU (1 mg/mice) by intraperitoneal route at 2 hours before sacrificing the mice [47]. For the memory phase of LCMV infection, we fed BrdU (1 mg/ml) by drinking water for 7-10 days before sacrificing the mice. Assay was done by using a BrdU assay kit (eBioscience) according to the instruction provided by company.
Infection
LCMV Armstrong and LM-gp33 was provided by Dr. SangJun Ha (Yonsei University, Korea). Propagation and titration of each pathogen was done by ourselves following general protocol [128, 129]. Mice were infected by i.p. route with 2x10⁵ pfu/mice LCMV Armstrong, and by i.v. with 1-2x10⁴ cfu
LM-gp33. And anti-NK1.1 (300 μg/mice) was injected once by i.p. route to host mice at the day of LCMV infection when IFNAR1-/- CD8+ T cells were used
[48].
Anti-IFNAR1 blocking antibody (MAR1-5A3) was purchased from BioXCell. In blocking experiment, mice were injected with the antibody for 7-10 days (200-300 μg/once/mice, every 2-3 days) by i.p. route.
RNA preparation and sequencing
Cells from spleens and lymph nodes were sorted by flow cytometry. Over 1 × 10⁶ sorted cells were used for RNA extraction with an NucleoZOL
(Macherey-Nagel). Biotinylated cRNA were prepared from 0.55 μg total RNA using the Illumina TotalPrep RNA Amplification Kit (Ambion). Following fragmentation, 0.75 μg of cRNA were hybridized were to the Illumina Expression Beadchip according to the protocols provided by the manufacturer.
Real-time PCR
Cells from lymph nodes or thymus were sorted by flow cytometry. Over 2 x 10⁵
sorted cells were used for RNA extraction with NucleoZOL (Macherey-Nagel) and stored at -80 ̊C before the further steps. Isolation of mRNA was done according to the manufacturer’s’ instruction. cDNA synthesized with the M-MLV reverse transcriptase and oligo dT (TAKARA). Real-time RT-PCR is done with the TaqMan Gene Expression Master Mix using StepOnePlus Real-Time PCR System (Applied Biosystems) with TaqMan probes. The following TaqMan probes (Applied Biosystems) were used: Tbx21 (Mn00450960_m1),
Eomes (Mm01351984_m1), IL-18Rap (Mm00516053_m1), and CCL5
(Mm01302427_m1).
Metabolic assay
Oxygen consumption rate (OCR) and extracellular acidification rate (ECAR) were assessed using a 96-well XF Extracellular flux analyzer, according to the manufacturer’s instruction (Seahorse Bioscience). SRC, OCR/ECAR ratios were defined as previously described [130, 131].
Statistical analysis
Unless indicated in the figure legend, a two-tailed, unpaired Student’s t-test was performed on log-transformed data with Prism (GraphPad Software). For multiple comparisons, one-way ANOVA with Dunnett’s multiple-comparison post-test was used.
IV. Results
Naïve CD8
+T cells with high CD5 expression constitutively express
Ly6C
It has been noted that naïve CD8+ T cells express broad spectrum of CD5 level,
of which the higher CD5 expressing cells the stronger reactivity to both self and foreign antigens. Beside high CD5 expressing cells (CD5hi) include more
pre-activated heterogenic population than those of low CD5 expressing cells (CD5lo). To find appropriate markers to further classify heterogenic CD5hi cells,
expression pattern of surface molecules on CD44lo, CD44loCD5lo and
CD44loCD5hi naïve CD8+ T cells was analyzed. Naïve CD8+ T cells, in spleen,
expressed Ly6C and CD183, which are known as molecules expressed on activated or memory CD8+ T cells (Figure 4A). When screening the surface
molecule expression of CD44loCD5lo and CD44loCD5hi cells, β2, β7, CD130,
GITR1, S1P, CD38, CD45RA, CD45RB, CD62L, CD98, CD122, CD123, CD124, CD126, CD127, CD183, CD28, and Ly6C were expressed significantly differently between CD44loCD5lo and CD44loCD5hi cells (Figure 4B).
Especially, Ly6C and CD183 were highly expressed on CD5hi cells only, not
CD5lo cells (Figure 4C). And most of the cells expressing CD183 appeared in
the subset with CD5hiLy6C+ phenotype (Figure 4D). These results suggested
that peripheral naïve CD8+ T cells can be classified to CD5lo, CD5hiLy6C-, and
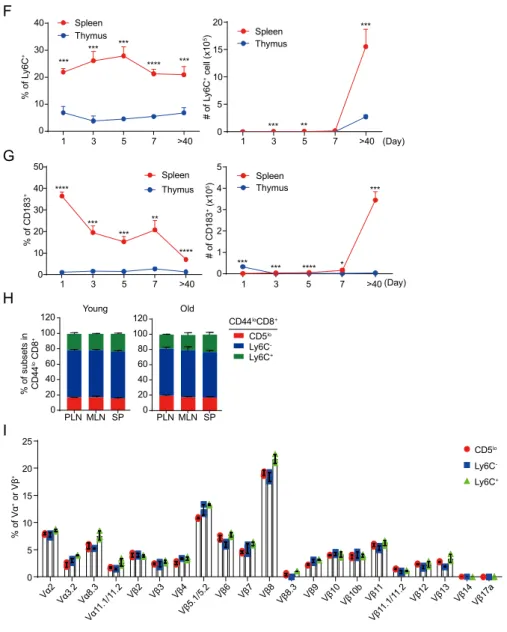
Next, to know whether CD5hiLy6C+ subsets were generated from thymus, Ly6C
and CD183 expressing cells were analyzed from thymus of adult mice. In consistent with peripheral naïve CD8+ T cells, Ly6C+ cells were found in only
CD5hi fraction of CD24lo mature thymocytes. In contrast, there was no CD183+
cells in both CD5lo and CD5hi cells of mature thymocytes (Figure 4E). To
confirm such discrepancy was induced by age-dependent thymic atrophy, spleen and thymus were obtained from neonatal and over 1-year-old mice. The results showed that around 5-10% of CD5hiLy6C+ cells were constantly
generated from the thymus during neonatal period while there was more CD5hiLy6C+ cells in spleen than those being generated from thymus (Figure
4F). In consistent with results from adult thymus, a few CD5hiCD183+ cells
were detected from the thymus during neonatal period (Figure 4G).
Next, the question was if CD5hiLy6C+ cells were induced from thymus and
egressed out to the periphery, the CD5hiLy6C+ cells might be accumulated in
periphery with age. Interestingly, inconsistent with the expectation, there was a comparable proportion of CD5hiLy6C+ cells in secondary lymphoid organs of
young and old mice (Figure 4H). Thus I asked whether biased generation of Ly6C+ cells within CD5hi fraction was forced by clonal differences of T cell. At
this end, the expression of TCR alpha and beta within three naïve CD8+ T cells
subsets, CD5lo, CD5hiLy6C-, and CD5hiLy6C+, were examined. The result
showed that the expression of TCR alpha and beta chain was comparable among three naïve CD8+ T cell subsets (Figure 4I).
based on the expression of CD5 as CD5lo and CD5hi cells, and the CD5hi cells
can be further classified by the expression of Ly6C and CD183. Therefore, naïve CD8+ T cells could have been classified to three subsets as CD5lo,
CD5hiLy6C-, and CD5hiLy6C+(including CD183- and CD183+) cells. And CD5lo,
CD5hiLy6C-, and CD5hiLy6C+ cells are stably and continuously produced in the
B6 CD8+ CD44hi CD44lo A Ly6C CD183 CD62L CD44 1.21 19.7 53.9 25.1 1.17 10.1 59.6 29.2 CD183 CD5 lo CD5 hi 0 10 20 30 40 50 % of Ly6 C + **** 0 5 10 15 20 % of C D 18 3 + **** CD5 lo CD5 hi CD44lo CD8+ CD5 Ly6 C C Ly6C -Ly6C + 0 20 40 60 % of C D 18 3 + **** 0.27 0 2.79 96.9 21.3 21.3 3.71 53.7 CD183 CD44lo CD8+ CD44lo CD8+ CD5hi CD5lo CD5hi Ly6 C D 0.47 6.94 74.5 18.1 0 0.60 88.9 10.5 Ly6 C CD24hi (Immature) CD24lo (Mature) E 0 5 10 15 20 % of Ly6 C + *** ** CD4- CD8+ thymocytes 0.033 0.62 79.8 19.6 0 0.10 89.4 10.5 CD1 83 CD24 hi CD5lo CD5hi 0 5 10 15 20 % of CD183 + CD24lo CD5 0 400 800 1200 1600 β2 MF I ** 0 700 1400 2100 2800 3500 ****β7 0 400 800 1200 1600 CD130**** 0 90 180 270 360 450 GITR**** 0 10 20 30 40 S1P**** 0 50 100 150 200 250 CD24 0 400 800 1200 CD27 0 60 120 180 240 CD38**** MF I 0 50 100 150 200 250CD45RA** 0 5000 10000 15000CD45RB* 0 2000 4000 6000 CD62L** 0 200 400 600 CD98** 0 50 100 150 200 CD122**** 0 10 20 30 40 CD123* 0 100 200 300 400 CD124**** MF I 0 70 140 210 280 CD127** 0 100 200 300 400 CD183 **** 0 200 400 600 800 Ly6C**** 0 2000 4000 6000 8000 CD28**** CD5 lo CD5 hi CD5 lo CD5 hi CD5 lo CD5 hi CD5 lo CD5 hi CD5 lo CD5 hi 0 100 200 300 400 CD126** 0 100 200 300 CD132 B CD5 lo CD5 hi CD5 lo CD5 hi
Figure 4. Naïve CD8+ T cells maintain heterogeneous phenotypes
developed following their CD5 expression.
Cells were analyzed by flow cytometry isolated from indicated organs. (A) Differential expression of surface molecules in CD44lo and CD44hi CD8+ T cells.
(B) Expression of surface molecules differently expressed in CD44loCD5lo and
CD44loCD5hi naïve CD8+ T cells. (C) Sub-population of naïve CD8+ T cells
F 1 3 5 7 >40 0 10 20 30 40 % of Ly6 C + Spleen Thymus *** *** **** *** *** 1 3 5 7 >40 0 5 10 15 20 # of Ly6 C + ce ll (x1 0 5) Spleen Thymus *** *** ** (Day) G 0 10 20 30 40 50 *** *** ** **** Spleen Thymus **** 1 3 5 7 >40 % of C D 18 3 + 0 1 2 3 4 5 Spleen Thymus *** * *** *** **** 1 3 5 7 >40 # of C D 183 + (x1 0 5) (Day) Young Old PLN MLN SP BM LV LG 0 20 40 60 80 100 120 % o f su bse ts in CD44 lo C D 8 + PLN MLN SP BM LV LG 0 20 40 60 80 100 120 CD44loCD8+ CD5lo Ly6C -Ly6C+ H 0 5 10 15 20 25 % o f Vα + o r Vβ + CD5lo Ly6C -Ly6C+ Vα2 Vβ2 Vα11. 1/11. 2 Vα3 .2 Vα8 .3 Vβ4 Vβ3 Vβ5. 1/5.2 Vβ 8 Vβ7 Vβ6 Vβ8. 3 Vβ10 Vβ11. 1/11. 2 Vβ14Vβ17 a Vβ12 Vβ13 Vβ9 Vβ11 Vβ10 b I
classified by differential expression of several surface molecules on highly CD5 expressing (CD5hi) naïve CD8+ T cells. (D) Proportion of CD183+ cells in
Ly6C- and Ly6C+ cells. (E) Generation of CD5hiLy6C+ and CD5hiCD183+ cells
in thymus. (F-G) Proportional changes of (F) CD5hiLy6C+ and (G)
CD5hiCD183+ cells in spleen and thymus during neonatal period. (H) Existence
of naïve CD8+ T cell subsets in young and aged mice. (I) Expression of several
TCR variable chain repertoire in naïve CD8+ T cell subsets. Data are
representative of at least two independent experiments. Unpaired Student’s t-test was used for the statistical analysis. *P<0.05; **P<0.01; ***P<0.005 ****P<0.001.
Generation of Ly6C
+subsets is regulated by constitutive type I IFN
and self-TCR engagement
It has been suggested that the Ly6C can be upregulated on T cells stimulated with IFN-β [132-134]. Therefore, to investigate whether type I IFN is essential for the generation of CD5hiLy6C+ cells, their expression was analyzed in several
kinds of type I IFN signal-deficient mice. CD5hiLy6C+ cells were almost
disappeared in Ifnar1-/-, Stat1-/-, and Ifnar1-/-Ifngr-/- mice compared to WT (B6)
mice (Figure 5A), whereas there were comparable CD5hiCD183+ cells in the
type I IFN signal-deficient mice (Figure 5B). Furthermore, it was evident that, in thymus, type I IFN is an essential factor for the generation of CD5hiLy6C+
cells (Figure 5C). To confirm whether type I IFN can directly induce Ly6C molecules to naïve CD8+ T cells, induction of Ly6C was examined from
purified Ly6C- naïve CD8+ T cells cultured with IFN-β or other cytokines. The
results clearly showed that IFN-β can induce Ly6C in a dose-dependent manner (Figure 5D), but not by other cytokines, including IFN-γ (Figure 5E). Because it was shown that proportion and absolute number of CD5hiLy6C+ cells are
higher in spleen compared to thymus after the birth (Figure 4F), it could be hypothesized that type I IFN-dependent Ly6C induction happened not only in thymus but also in periphery. To prove the hypothesis, purified Ly6C- naïve
CD8+ T cells from WT and Ifnar1-/- mice were co-transferred to B6 host, then
the donor cells were analyzed at 7 days after the transfer. The results showed Ifnar1-/- Ly6C- donor cells could not express Ly6C, while WT Ly6C- donor
in CD183 expression between WT and Ifnar1-/- Ly6C- donor cells (Figure 5G).
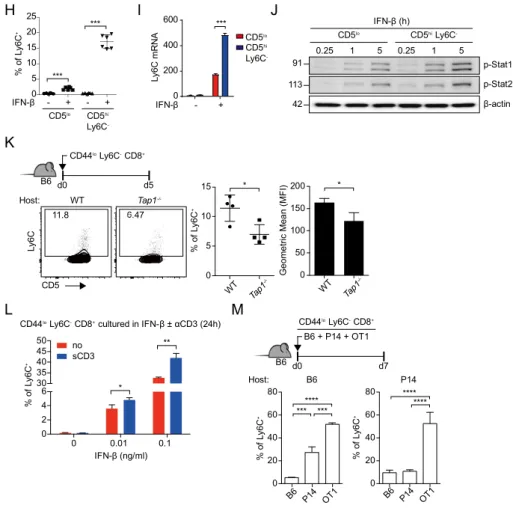
Also, when the cells were sorted into CD5lo Ly6C- and CD5hiLy6C- were
cultured with IFN-β, CD5hiLy6C- cells showed much better Ly6C expression
than those of CD5lo cells in both protein (Figure 5H) and mRNA (Figure 5I). In
addition, CD5hiLy6C- cells showed higher phosphorylation of STAT1 and
STAT2 upon IFN-β stimulation than that of CD5lo cells. Based on these results,
it showed that CD5hiLy6C- cells have higher IFN-β sensitivity than CD5lo cells
(Figure 5J).
While it was proven that CD5hiLy6C+ cells are generated by constitutive type I
IFN in periphery, it was still remaining to question what is the role of self-TCR contact to Ly6C induction. So it was hypothesized if the self-TCR engagement is correlated to Ly6C induction, CD5hiLy6C- cells might be influenced by
self-TCR signal better than CD5lo cells because it had been broadly accepted that
the CD5 level in periphery represents to self-TCR reactivity [58, 88]. To prove the hypothesis Ly6C- naïve CD8+ T cells were transferred to WT and TAP1
-/-host mice respectively, then Ly6C induction was analyzed on the donor cells at 5 days after the transfer. The result showed that there was significantly less induction of Ly6C+ subset in the donor cells in TAP1-/- mice than those in WT
(Figure 5K). Also, when the Ly6C- naïve CD8+ T cells were cultured with
IFN-β and soluble anti-CD3 antibody, type I IFN-dependent Ly6C induction was enhanced (Figure 5L). In addition, positive role of self-TCR engagement was confirmed by competitive Ly6C induction. The Ly6C- cells purified from B6,