Prognostic Significance of Volume-Based FDG PET/CT
Parameters in Patients with Locally Advanced Pancreatic Cancer
Treated with Chemoradiation Therapy
Hye Jin Choi,
1Jeong Won Lee,
2Beodeul Kang,
1Si Young Song,
3Jong Doo Lee,
2and Jae-Hoon Lee
2 1Division of Oncology, Department of Internal Medicine, Yonsei University College of Medicine, Seoul;Departments of 2Nuclear Medicine and 3Internal Medicine, Yonsei University College of Medicine, Seoul, Korea. Received: February 19, 2014
Revised: June 9, 2014 Accepted: June 17, 2014
Corresponding author: Dr. Jae-Hoon Lee, Department of Nuclear Medicine, Yonsei University College of Medicine, 50-1 Yonsei-ro, Seodaemun-gu, Seoul 120-752, Korea.
Tel: 82-2-2228-2350, Fax: 82-2-312-0578 E-mail: [email protected]
∙ The authors have no financial conflicts of interest.
© Copyright:
Yonsei University College of Medicine 2014
This is an Open Access article distributed under the terms of the Creative Commons Attribution Non-Commercial License (http://creativecommons.org/ licenses/by-nc/3.0) which permits unrestricted non-commercial use, distribution, and reproduction in any medium, provided the original work is properly cited.
Purpose: We investigated the prognostic role of volume-based parameters measured on 18F-fluorodeoxyglucose (FDG) positron emission tomography-computed
tomog-raphy (PET/CT) scans in patients with locally advanced pancreatic cancer (LAPC) treated with chemoradiation therapy (CRT). Materials and Methods: We enrolled 60 patients with LAPC who underwent FDG PET/CT before CRT. Maximum stan-dardized uptake value (SUVmax), metabolic tumor volume (MTV), and total lesion glycolysis (TLG) of primary pancreatic cancers were measured on FDG PET/CT scans. Treatment response was evaluated according to the Response Evaluation Cri-teria in Solid Tumors. Survival analysis was performed using the Kaplan-Meier method, and Cox proportional hazard models were used to determine independent prognostic factors. Results: The progression-free survival (PFS), locoregional pro-gression-free survival (LRFPS), and overall survival (OS) for this population were 6.2, 10.9, and 13.2 months, respectively. The overall treatment response rate was 16.7% at 4 weeks after CRT, and the disease control rate (DCR) was 80.0%. DCR was significantly higher in patients with low SUVmax, MTV, or TLG, and showed strong correlation with longer survival times. On univariate analysis, MTV and TLG were significant prognostic factors for PFS, LRPFS, and OS, together with pre-CRT and post-CRT CA19-9 levels. Multivariate analyses demonstrated that MTV togeth-er with the pre-CRT CA19-9 level wtogeth-ere independent prognostic factors for PFS,
LR-PFS, and OS, as was TLG for LRPFS and OS. Conclusion: MTV and the pre-CRT
CA19-9 level provided independent prognostic information in patients with LAPC treated with CRT. Volume-based PET/CT parameters may be useful in identifying which subgroup of patients would benefit from radiation therapy as a part of CRT.
Key Words: Locally advanced pancreatic cancer, FDG, PET, metabolic tumor volume, prognosis
INTRODUCTION
Pancreatic cancer is one of the most lethal cancers. According to a recent report, about 15% of patients with pancreatic cancer survived 1 year after diagnosis, and
part of a staging work-up prior to treatment at our institu-tion from January 2007 to December 2010. Patients with a diagnosis of stage III biopsy-confirmed ductal adenocarci-noma, who were initially deemed surgically unresectable upon staging work-up and who received CRT, were includ-ed in this study. Sixty patients met the inclusion criteria. Baseline patient and tumor characteristics were reviewed, in-cluding age, gender, Eastern Cooperative Oncology Group (ECOG) performance status, history of diabetes mellitus, tumor diameter (mm), tumor location, T stage, nodal status, and non-obstructive pre-CRT and post-CRT CA19-9 levels. The Institutional Review Board of our university approved this retrospective study, and the requirement to obtain in-formed consent was waived.
Acquisition and analysis of FDG PET/CT scans
All FDG PET/CT scans were performed using a dedicated PET/CT scanner (Discovery STe, GE Healthcare, Milwau-kee, WI, USA or Biograph TruePoint 40, Siemens Medical Systems, CTI, Knoxville, TN, USA). All patients fasted for at least 6 h prior to the PET/CT scan. Median blood glucose level was 100 mg/dL with a range of 72‒210 mg/dL. A dose of approximately 5.5 MBq/kg of FDG was intravenously injected 60 min before imaging. After the initial low-dose CT (Discovery STe: 30 mA, 130 kVp; Biograph TruePoint: 36 mA, 120 kVp), the PET scan extending from the neck to the proximal thighs with an acquisition time of 3 min per bed position in 3-D mode was performed. The PET scans were reconstructed using ordered subset expectation maxi-mization with attenuation correction.
Volume-based assessment of the primary pancreatic can-cer lesion was performed using the volume viewer software on a GE Medical Systems Advantage Workstation 4.5. Each tumor was examined with a spherical-shaped volume of in-terest (VOI) that included the entire lesion in the axial, sag-ittal, and coronal planes. The maximum SUV (SUVmax) of the VOI was calculated as (decay-corrected activity/tissue volume)/(injected dose/body weight). Once the threshold for volumetric analysis was assigned, the software automati-cally calculated MTV and mean SUV of the VOI from PET data by grouping all spatially connected voxels equal to or above the threshold. In this study, MTV was defined as total tumor volume with SUV ≥2.5, and TLG was calculated as (mean SUV)×MTV.
Treatment delivery
All 60 patients who underwent CRT received
gemcitabine-fewer than 5% survived 5 years.1 Only 20% of patients
with pancreatic cancer have resectable tumors at the time of presentation, with a long-term survival rate of approximate-ly 20%.2,3 A much higher percentage (40% to 45%) of
pa-tients present with metastatic disease and have a median survival of only 3‒6 months.4,5
Patients with locally advanced pancreatic cancer (LAPC) are an intermediate favorable prognostic group and are as-sociated with a median survival of 6‒10 months.4,6
Treat-ment for LAPC has evolved to consist of chemotherapy alone or in combination with radiotherapy. Although chemoradiation therapy (CRT) remains a treatment option, only a small number of randomized clinical trials have re-ported improved survival outcomes,7-9 and many have
ar-gued the value of radiation therapy (RT) for the subset of patients with LAPC due to the high rate of distant metasta-sis and subsequent poor survival outcomes even after suc-cessful local control.10
18F-fluorodeoxyglucose (FDG) positron emission
tomog-raphy-computed tomography (PET/CT) is now widely used to assess many different types of malignancy, and several studies have demonstrated an important role of FDG PET/ CT in staging, detecting postoperative recurrence, and eval-uating treatment response in patients with pancreatic can-cer.11,12 Other studies have shown that the standardized
up-take value (SUV) of primary pancreatic cancer lesions measured on pretreatment FDG PET/CT scans can help to predict survival outcomes in patients with pancreatic can-cer.12-16 Recently, PET/CT-based volumetric imaging
param-eters, including metabolic tumor volume (MTV) and total lesion glycolysis (TLG), have also been shown to be useful prognostic indicators for various neoplasms.17-19 However,
few studies have evaluated volumetric parameters as prog-nostic factors in patients with LAPC.20 Moreover, while
in-vestigators have established prognostic factors for pancreat-ic cancer, data regarding LAPC are limited. The objective of this study was to investigate the prognostic significance of volumetric parameters measured on pretreatment FDG PET/CT scans for predicting treatment outcomes in patients with LAPC treated with CRT.
MATERIALS AND METHODS
PatientsWe retrospectively reviewed the medical records of all pan-creatic cancer patients who underwent FDG PET/CT as
the first day of treatment and the date of death or last visit. For statistical analyses, all variables for survival were grouped into two categories according to specific cutoff values. The optimal cutoff values were determined using receiver-operating characteristic (ROC) curve analysis. The significance of the predictive value of each variable was evaluated using log-rank tests for univariate analysis and Cox proportional hazards regression tests for multivariate analysis. Multicollinearity between MTV and TLG was evaluated by calculating the Spearman rank correlation co-efficient before multivariate analysis. Statistical analyses were performed using SPSS 20.0 for Windows (SPSS Inc., Chicago, IL, USA). Results with p-values <0.05 were con-sidered statistically significant.
RESULTS
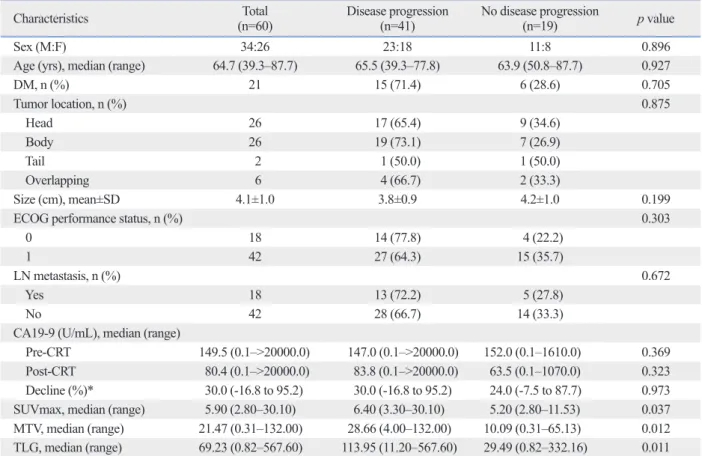
Patient characteristicsTable 1 summarizes the pretreatment characteristics of all 60 patients enrolled in the study according to disease status at the 1-year follow up. The median PFS was 6.2 months [95% confidence interval (CI): 3.8‒8.6 months] and the overall 1-year progression-free survival rate was 68%. Distant re-lapse (n=34; 82.9%) was the main cause of initial treatment failure, 31 instances of which were isolated (75.6%) and 3 (7.3%) that were concomitant with locoregional progression. Local treatment failure without concomitant distant metasta-sis was observed in 8 patients (19.5%), 6 (75%) of whom eventually had relapse with distant metastasis. Sites of distant metastasis included the liver (n=17), peritoneum (n=9), mul-tiple organs (n=7), and lungs (n=1). There was no significant relationship between the pattern of initial disease progression (distant versus local) and PET/CT parameters (SUVmax, MTV, and TLG). In comparing patients with and without disease progression, SUVmax, MTV, and TLG were signifi-cantly different between these two groups (p<0.05, all) while the other demographic and clinical characteristics did not show statistical significance. From the ROC analyses, the op-timal cut-off values for SUVmax, MTV, and TLG were set at 6.5, 10.0 cm3, and 45.0 g, respectively. Cut-off values for the
pre-CRT CA19-9 level, post-CRT CA19-9 level, and decline in the CA19-9 levels after CRT were also defined as 646 U/ mL, 144 U/mL, and 87.8%, respectively.
Tumor response assessment
Overall treatment response was 16.7% at the 4-week follow
based chemotherapy. Only gemcitabine (1000 mg/m2 on
days 1, 8, 15, 29, and 36) was administered to most patients. Cisplatin (70 mg/m2 on days 1 and 29) or capecitabine (total
daily dose of 2000 mg/m2 for days 1‒14 and 21‒35) was
ad-ditionally administered to some patients depending on the preference of the responsible physicians and the general condition of the patient. Chemotherapy was withheld until the resolution of any grade 3 or 4 non-hematologic toxicity.
Patients also received conformal radiotherapy or tomo-therapy as a part of CRT. According to the standard CRT protocol, patients received involved-field irradiation con-sisting of the gross tumor volume (GTV) with a liberal margin (2 cm). If significant lymphadenopathy was noted on the pre-treatment scans, radiotherapy of the specified lymph node areas was also performed. A median total dose of 50.4 Gy with a range of 45.0‒58.4 Gy was applied with daily fractions of 1.8 Gy for 5 days per week using a 10 MV linear accelerator. After CRT, patients received
mainte-nance gemcitabine chemotherapy (1000 mg/m2 on days 1,
8, and 15, every 4 weeks) until disease progression or unac-ceptable toxicities occurred.
Response evaluation
All 60 enrolled patients had clinical follow-ups that includ-ed diagnostic imaging studies and blood tests. Tumor re-sponse was assessed according to the Rere-sponse Evaluation Criteria in Solid Tumors on contrast-enhanced CT scans ob-tained at 4 weeks after completion of CRT. Disease control status, defined as complete response, partial response, or stable disease, was also evaluated at each time point.
Data analysis
All 60 patients were assessed and grouped according to whether they had experienced progression of disease at the 1-year follow up. The SUVmax, MTV, and TLG on FDG PET/CT scans, as well other tumor factors, were compared between the 2 subgroups using Mann-Whitney U tests, chi-squared tests, t-tests, and Fisher’s exact tests. Survival curves were estimated using the Kaplan-Meier method to calculate the cumulative locoregional progression-free survival (LR-PFS), progression-free survival ((LR-PFS), and overall survival (OS). LRPFS was defined as survival without local or re-gional treatment failure, calculated as the time between the first day of treatment and the date of local or regional fail-ure, death, or last visit. The PFS was calculated as the time between the first day of treatment and any type of disease progression, while the OS was defined as the time between
sults between the responder and non-responder groups. However, the DCR was significantly higher in patients whose tumors had lower SUVmax, MTV, or TLG values than those in the other group, while none of the CA19-9 pa-rameters showed statistical differences. These results are summarized in Table 2.
up after CRT, and the disease control rate (DCR) was 80%. To assess the predictive value of the PET/CT parameters and CA19-9 levels, we classified patients into 2 groups, higher and lower, based on the cut-off values obtained from the ROC analyses described above. There were no signifi-cant statistical differences in the PET/CT and CA19-9
re-Table 1. Patient Characteristics According to Disease Progression at the 1-Year Follow-Up
Characteristics (n=60)Total Disease progression (n=41) No disease progression (n=19) p value
Sex (M:F) 34:26 23:18 11:8 0.896
Age (yrs), median (range) 64.7 (39.3–87.7) 65.5 (39.3–77.8) 63.9 (50.8–87.7) 0.927
DM, n (%) 21 15 (71.4) 6 (28.6) 0.705 Tumor location, n (%) 0.875 Head 26 17 (65.4) 9 (34.6) Body 26 19 (73.1) 7 (26.9) Tail 2 1 (50.0) 1 (50.0) Overlapping 6 4 (66.7) 2 (33.3) Size (cm), mean±SD 4.1±1.0 3.8±0.9 4.2±1.0 0.199
ECOG performance status, n (%) 0.303
0 18 14 (77.8) 4 (22.2)
1 42 27 (64.3) 15 (35.7)
LN metastasis, n (%) 0.672
Yes 18 13 (72.2) 5 (27.8)
No 42 28 (66.7) 14 (33.3)
CA19-9 (U/mL), median (range)
Pre-CRT 149.5 (0.1–>20000.0) 147.0 (0.1–>20000.0) 152.0 (0.1–1610.0) 0.369 Post-CRT 80.4 (0.1–>20000.0) 83.8 (0.1–>20000.0) 63.5 (0.1–1070.0) 0.323 Decline (%)* 30.0 (-16.8 to 95.2) 30.0 (-16.8 to 95.2) 24.0 (-7.5 to 87.7) 0.973 SUVmax, median (range) 5.90 (2.80–30.10) 6.40 (3.30–30.10) 5.20 (2.80–11.53) 0.037 MTV, median (range) 21.47 (0.31–132.00) 28.66 (4.00–132.00) 10.09 (0.31–65.13) 0.012 TLG, median (range) 69.23 (0.82–567.60) 113.95 (11.20–567.60) 29.49 (0.82–332.16) 0.011 DM, diabetes mellitus; ECOG, Eastern Cooperative Oncology Group; LN, lymph node; SUVmax, maximum standardized uptake value; MTV, metabolic tu-mor volume; TLG, total lesion glycolysis; CRT, chetu-moradiation therapy.
*Values below 0.0 indicate increase in CA19-9 level after CRT.
Table 2. Treatment Response and Disease Control Rate According to the PET/CT Parameters
Responder Non-responder Tumor
response rate Odds ratio* (95% CI) p value control rateDisease Odds ratio (95% CI) p value
CR PR SD PD SUVmax, n 1.000 0.005 ≤6.5 0 6 29 3 15.8% 0.8 (0.2–3.4) 92.1% 8.1 (1.9–34.6) >6.5 0 4 9 9 18.2% 59.1% MTV, n 0.426 0.027 ≤10.0 cm3 0 1 14 0 6.7% 0.3 (0.1–2.4) 100.0% - >10.0 cm3 0 9 24 12 20.0% 73.3% TLG, n 0.727 0.020 ≤45.0 g 0 3 19 1 13.0% 0.6 (0.2–2.8) 95.7% 9.4 (1.1–78.9) >45.0 g 0 7 19 11 18.9% 70.3% Total 0 10 38 12 16.7% 80.0%
CR, complete response; PR, partial response; SD, stable disease; PD, progressive disease; SUVmax, maximum standardized uptake value; MTV, metabolic tumor volume; TLG, total lesion glycolysis; PET/CT, positron emission tomography-computed tomography; CI, confidence interval.
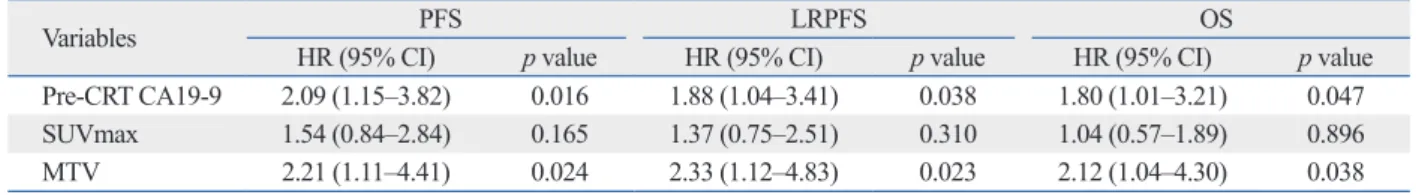
Among the significant prognostic variables found by uni-variate analysis, only those variables that could be assessed before treatment were included in the multivariate analysis (i.e., SUVmax, MTV, TLG, and the pre-CRT CA19-9 lev-el). As TLG is calculated by multiplying the mean SUV and the MTV, there was a significant correlation between the MTV and TLG (r=0.946, p<0.0001). Therefore, MTV and TLG were assessed separately. On the multivariate analysis, the pre-CRT CA19-9 level and MTV were identi-fied as independent prognostic factors for PFS, LRPFS, and OS (p<0.05, all) (Table 4), while TLG remained statistical-ly significant for both LRPFS (p=0.008) and OS (p=0.019) (Table 5).
DISCUSSION
To date, few prognostic factors from heterogeneous study populations have been identified for LAPC. Bjerregaard, et al.21 reported that good performance status with small
tu-mors was significantly associated with favorable prognosis. In a multi-center study including patients with LAPC and metastatic pancreatic cancer, the pretreatment CA19-9 level
Survival analysis and prognostic factors
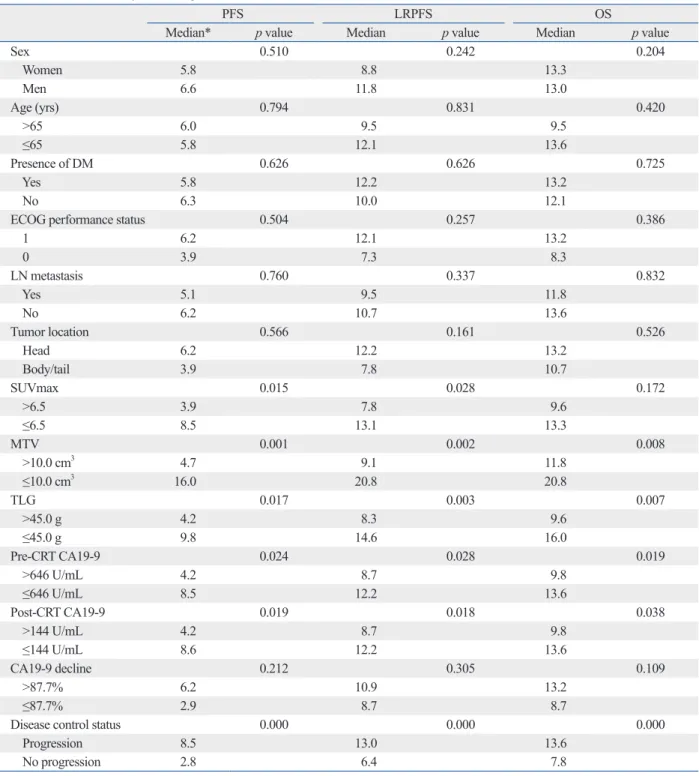
At a median follow up of 13 months (range, 3‒67 months), 58 out of the 60 evaluated patients (96.7%) had died. One patient was alive without disease progression, and the other remaining patient was also alive but had liver metastasis and peritoneal carcinomatosis. Both patients had consis-tently lower SUVmax, MTV, and TLG and lower pre-CRT and post-CRT CA19-9 levels, which declined significantly after CRT. During follow-up, 41 patients (68.3%) experi-enced some degree of treatment failure. The median dura-tions of PFS, LRPFS, and OS were 6.2 months (95% CI: 3.8‒8.6 months), 10.9 months (95% CI: 8.1‒13.7 months), and 13.2 months (95% CI: 11.9‒14.5 months), respectively. Comparison of survival data using the log-rank test showed that MTV and TLG were significant prognostic indicators for PFS, LRPFS, and OS (Figs. 1 and 2), as was SUVmax for PFS and LRPFS. Through univariate analysis, pre-CRT and post-CRT CA19-9 levels were found to have prognos-tic significance for PFS, LRPFS, and OS. In addition, dis-ease progression at 4 weeks after treatment was an adverse prognostic factor in terms of PFS, LRPFS, and OS. Median survival times and corresponding results of univariate anal-ysis are shown in Table 3.
Fig. 1. (A) Cumulative progression-free survival, (B) locoregional progression-free survival, and (C) overall survival according to the metabolic tumor volume
(MTV) of pancreatic cancer lesions.
Fig. 2. (A) Cumulative progression-free survival, (B) locoregional progression-free survival, and (C) overall survival according to the total lesion glycolysis
(TLG) of pancreatic cancer lesions.
B B C C Time (months) Time (months) Time (months) Time (months) Time (months) Time (months) 0 0 0 0 0 0 20 20 20 20 20 20 40 40 40 40 40 40 60 60 60 60 60 60 80 80 80 80 80 80 100 100 100 100 100 100 Cu m ul at ive su rv iva l ( % ) Cu m ul at ive su rv iva l ( % ) Cu m ul at ive su rv iva l ( % ) Cu m ul at ive su rv iva l ( % ) Cu m ul at ive su rv iva l ( % ) Cu m ul at ive su rv iva l ( % ) 0 0 0 0 0 0 10 10 10 10 10 10 20 20 20 20 20 20 30 30 30 30 30 30 40 40 40 40 40 40 50 50 50 50 70 70 60 60 50 50 A A p=0.001 p=0.007 p=0.002 p=0.003 p=0.001 p=0.007 MTV≤10.0 cm3 MTV>10.0 cm3 TLG≤45.0 g TLG>45.0 g TLG≤45.0 g TLG>45.0 g TLG≤45.0 g TLG>45.0 g MTV≤10.0 cm3 MTV>10.0 cm3 MTV≤10.0 cm 3 MTV>10.0 cm3
dependent prognostic factor for poor survival in patients with LAPC who were treated with CRT, while a decline in the CA19-9 level was not. The post-CRT CA19-9 level did have statistical significance upon univariate analysis; howev-er in the present study, it was excluded from multivariate analysis due to our focus on prognostic factors that can be as-(<1000 U/mL) as well as a CA19-9 decline of >25% after
treatment were strongly correlated with longer time-to-pro-gression and OS.22 A decrease in the CA19-9 level (>90%)
was also an independent predictor of improved median sur-vival in a study performed by Yang, et al.23 Our analysis
indi-cated that a pre-CRT CA19-9 level of >646 U/mL was an
in-Table 3. Univariate Analysis of Prognostic Factors for Survival Outcomes
PFS LRPFS OS
Median* p value Median p value Median p value
Sex 0.510 0.242 0.204 Women 5.8 8.8 13.3 Men 6.6 11.8 13.0 Age (yrs) 0.794 0.831 0.420 >65 6.0 9.5 9.5 ≤65 5.8 12.1 13.6 Presence of DM 0.626 0.626 0.725 Yes 5.8 12.2 13.2 No 6.3 10.0 12.1
ECOG performance status 0.504 0.257 0.386
1 6.2 12.1 13.2 0 3.9 7.3 8.3 LN metastasis 0.760 0.337 0.832 Yes 5.1 9.5 11.8 No 6.2 10.7 13.6 Tumor location 0.566 0.161 0.526 Head 6.2 12.2 13.2 Body/tail 3.9 7.8 10.7 SUVmax 0.015 0.028 0.172 >6.5 3.9 7.8 9.6 ≤6.5 8.5 13.1 13.3 MTV 0.001 0.002 0.008 >10.0 cm3 4.7 9.1 11.8 ≤10.0 cm3 16.0 20.8 20.8 TLG 0.017 0.003 0.007 >45.0 g 4.2 8.3 9.6 ≤45.0 g 9.8 14.6 16.0 Pre-CRT CA19-9 0.024 0.028 0.019 >646 U/mL 4.2 8.7 9.8 ≤646 U/mL 8.5 12.2 13.6 Post-CRT CA19-9 0.019 0.018 0.038 >144 U/mL 4.2 8.7 9.8 ≤144 U/mL 8.6 12.2 13.6 CA19-9 decline 0.212 0.305 0.109 >87.7% 6.2 10.9 13.2 ≤87.7% 2.9 8.7 8.7
Disease control status 0.000 0.000 0.000
Progression 8.5 13.0 13.6
No progression 2.8 6.4 7.8
PFS, progression-free survival; LRPFS, locoregional progression-free survival; OS, overall survival; DM, diabetes mellitus; ECOG, Eastern Cooperative Oncology Group; LN, lymph node; SUVmax, maximum standardized uptake value; MTV, metabolic tumor volume; TLG, total lesion glycolysis; CRT, chemo-radiation therapy.
more accurately reflect the metabolic tumor burden and pre-dict survival outcomes when compared to SUVmax, which is a single-voxel value.17-19,24
Previous studies on prognostic significance of volumetric parameters of PET/CT used simple fixed SUV threshold, percentage threshold of SUVmax, or SUV of the liver or mediastinal blood pool; however, there is still no consensus or standardization on defining the threshold for metabolic tumor volume delineation.25,26 We used a fixed SUV
thresh-old of 2.5 and demonstrated that MTV and TLG had prog-nostic significances. The choice of a fixed SUV threshold of 2.5 was largely based on early studies demonstrating that an SUV within this range is optimal for differentiating be-nign lesions from malignant lesions and minimizes inclu-sion of unwanted physiological FDG uptake in normal tis-sues.26-29 One recent study using a phantom demonstrated
that an SUV of 40‒50% of the maximum was appropriate for the contouring of actual tumor volume;30 however, we
could not clearly delineate the primary tumor from sur-rounding normal structures when 40‒50% of the SUVmax of the tumor was applied to a threshold in several cases. In addition, it is noteworthy that suggested cutoff values to identify a favorable prognostic group vary widely by tumor site and study group. Therefore, further studies should fo-cus on both standardization of threshold SUV and individu-alization of cutoff values in order to eventually integrate volumetric analysis of FDG PET/CT into clinical practices.
CRT has been regarded as a reasonable treatment option for LAPC, although the role of radiation therapy remains highly controversial. As LAPC is associated with a high rate of distant metastases and subsequent poor OS, it is now sessed before treatment. Nevertheless, we believe that our
study has reinforced the prognostic value of CA19-9 levels. Several recent studies have investigated the prognostic value of FDG PET/CT results in patients with pancreatic cancer. Despite an absence of standardized cutoff values, poorer survival has consistently been associated with high SUVmax values measured on pretreatment FDG PET/CT scans of patients with primary pancreatic cancer.13-16
How-ever, to the best of our knowledge, only one other study has evaluated the use of FDG PET/CT volumetric parameters for predicting clinical outcomes in patients with LAPC. In that study, Parlak, et al.20 used the GTV measured during
ra-diotherapy planning as a metabolic parameter measured on FDG PET/CT scans of 30 patients with LAPC and showed that those with a GTV of <100.0 cm3 had significantly
lon-ger OS and PFS than those with a GTV of >100 cm3. GTV
is typically used as a parameter for radiotherapy, and MTV and TLG are corresponding FDG PET/CT volumetric pa-rameters used for survival analysis.17-19 In this study, we
eval-uated the prognostic value of MTV and TLG measured on pretreatment FDG PET/CT scans of patients with LAPC who underwent CRT. Although TLG failed to remain statisti-cally significant for predicting PFS by multivariate analysis, the results of our study demonstrated that MTV and TLG were independent prognostic factors and had a stronger as-sociation with survival outcomes compared to SUVmax. MTV is defined as the volume of tumor tissue that shows increased FDG uptake over a certain threshold, which in our study was an SUV of 2.5, and TLG is representative of the metabolic activity throughout the entire tumor. There-fore, volumetric parameters such as MTV and TLG can
Table 4. Multivariate Analysis of Prognostic Factors for Survival Outcomes–Metabolic Tumor Volume Model
Variables PFS LRPFS OS
HR (95% CI) p value HR (95% CI) p value HR (95% CI) p value
Pre-CRT CA19-9 2.09 (1.15–3.82) 0.016 1.88 (1.04–3.41) 0.038 1.80 (1.01–3.21) 0.047 SUVmax 1.54 (0.84–2.84) 0.165 1.37 (0.75–2.51) 0.310 1.04 (0.57–1.89) 0.896 MTV 2.21 (1.11–4.41) 0.024 2.33 (1.12–4.83) 0.023 2.12 (1.04–4.30) 0.038 PFS, progression-free survival; LRPFS, locoregional progression-free survival; OS, overall survival; HR, hazard ratio; CI, confidence interval; SUVmax, maxi-mum standardized uptake value; MTV, metabolic tumor volume; CRT, chemoradiation therapy.
Table 5. Multivariate Analysis of Prognostic Factors for Survival Outcomes –Total Lesion Glycolysis Model
Variables PFS LRPFS OS
HR (95% CI) p value HR (95% CI) p value HR (95% CI) p value
Pre-CRT CA19-9 2.21 (1.22–3.98) 0.009 2.24 (1.23–4.08) 0.008 2.14 (1.20–3.84) 0.010 SUVmax 1.69 (0.87–3.27) 0.122 1.26 (0.68–2.34) 0.466 0.94 (0.50–1.76) 0.838 TLG 1.56 (0.82–2.98) 0.178 2.41 (1.26–4.61) 0.008 2.19 (1.14–4.21) 0.019 PFS, progression-free survival; LRPFS, locoregional progression-free survival; OS, overall survival; HR, hazard ratio; CI, confidence interval; SUVmax, maxi-mum standardized uptake value; TLG, total lesion glycolysis; CRT, chemoradiation therapy.
cancer lesion, mainly due to obstructive pancreatitis. In those patients, it was difficult to clearly differentiate tumor uptake from inflammatory uptake due to pancreatitis, which may have affected the measurement of MTV. We theorize that simultaneous anatomic correlation with other imaging modalities, such as contrast-enhanced CT or PET-magnetic resonance imaging (PET/MRI) would be one so-lution to this problem. Third, use of different PET/CT scan-ners may have contributed to SUV variability to a certain extent and biased the results of the present study, although the variations of SUV among PET/CT systems in our insti-tute were within the acceptable limit.35
In conclusion, MTV measured on pretreatment FDG PET/ CT scans was an independent and significant prognostic fac-tor for predicting the PFS, LRPFS, and OS, as was TLG for predicting the LRPFS and OS, in patients with LAPC treated with gemcitabine-based CRT. FDG PET/CT volumetric pa-rameters might have the potential to identify the subgroup of patients who would benefit from RT as a part of CRT.
ACKNOWLEDGEMENTS
This study was supported by a faculty research grant of Yon-sei University College of Medicine for 2014 (6-2014-0030).
REFERENCES
1. Coupland VH, Kocher HM, Berry DP, Allum W, Linklater KM, Konfortion J, et al. Incidence and survival for hepatic, pancreatic and biliary cancers in England between 1998 and 2007. Cancer Epidemiol 2012;36:e207-14.
2. Li D, Xie K, Wolff R, Abbruzzese JL. Pancreatic cancer. Lancet 2004;363:1049-57.
3. Geer RJ, Brennan MF. Prognostic indicators for survival after re-section of pancreatic adenocarcinoma. Am J Surg 1993;165:68-72. 4. Heinemann V. Gemcitabine in the treatment of advanced
pancre-atic cancer: a comparative analysis of randomized trials. Semin Oncol 2002;29(6 Suppl 20):9-16.
5. Willett CG, Czito BG, Bendell JC, Ryan DP. Locally advanced pancreatic cancer. J Clin Oncol 2005;23:4538-44.
6. Real FX. A “catastrophic hypothesis” for pancreas cancer progres-sion. Gastroenterology 2003;124:1958-64.
7. Treatment of locally unresectable carcinoma of the pancreas: com-parison of combined-modality therapy (chemotherapy plus radio-therapy) to chemotherapy alone. Gastrointestinal Tumor Study Group. J Natl Cancer Inst 1988;80:751-5.
8. Chauffert B, Mornex F, Bonnetain F, Rougier P, Mariette C, Bou-ché O, et al. Phase III trial comparing intensive induction chemo-radiotherapy (60 Gy, infusional 5-FU and intermittent cisplatin) followed by maintenance gemcitabine with gemcitabine alone for
considered as part of the spectrum of metastatic diseases. Multiple clinical trials have attempted to identify the best treatment for LAPC, and trials of only chemotherapy ver-sus CRT have reported mixed results regarding the survival benefits of CRT; therefore, the debate continues.7-9,31,32
Re-cently Iacobuzio-Donahue, et al.33 have identified a
promis-ing biomarker, the tumor suppressor SMAD4, as a potential predictor of local versus distant disease progression. Inter-estingly, patients with intact SMAD4 expression had a lo-cal-dominant pattern of disease spread, while those with the loss of SMAD4 had a distant-dominant pattern. This corre-lation between SMAD4 expression and the pattern of dis-ease spread has been validated by a phase II clinical tri-al.33,34 It has been argued that patients with occult metastatic
disease or a high risk of distant metastasis might not be candidates for RT because the benefit from RT would not outweigh its side effects. In the present study, none of the PET/CT parameters that were analyzed succeeded in predict-ing a pattern of initial disease progression or which group of patients would show response to CRT at the 4-week follow up. However, the DCR was significantly higher in patients with lower SUVmax, MTV, or TLG, and the univariate analysis showed that the DCR was a significant prognostic indicator of survival outcomes (all p<0.001 for PFS, LR-PFS, and OS). Therefore, we postulate that the metabolic activity of pancreatic cancer lesions demonstrated on FDG PET/CT scans might be helpful to guide treatment deci-sions in cases of LAPC. Given the rapid disease progres-sion and shorter survival times of patients with LAPC, RT would not be recommended when high metabolic activity is detected on pretreatment FDG PET/CT scans. As FDG PET/CT is a relatively non-invasive diagnostic tool, these metabolic parameters are more easily assessed compared to SMAD4 expression. However, a large-scale comparative study is mandatory to validate the clinical use of FDG PET/ CT for predicting survival outcomes and guiding treatment decisions in patients with LAPC.
There were several limitations to our study. First, as we enrolled only patients who completed full cycles of CRT and as our hospital is a tertiary referral center, those patients with poor performance and tolerability who chose to dis-continue treatment or to receive palliative care at hospice centers were excluded, potentially skewing the study popu-lation to a group of better prognosis. Second, we used a threshold SUV of 2.5 for measuring the MTV of pancreatic cancer lesions. Some of the enrolled patients showed dif-fuse FDG uptake by the pancreatic parenchyma distal to the
Prognostic factors for survival and resection in patients with initial nonresectable locally advanced pancreatic cancer treated with chemoradiotherapy. Int J Radiat Oncol Biol Phys 2012;83:909-15. 22. Haas M, Heinemann V, Kullmann F, Laubender RP, Klose C,
Bruns CJ, et al. Prognostic value of CA 19-9, CEA, CRP, LDH and bilirubin levels in locally advanced and metastatic pancreatic cancer: results from a multicenter, pooled analysis of patients re-ceiving palliative chemotherapy. J Cancer Res Clin Oncol 2013; 139:681-9.
23. Yang GY, Malik NK, Chandrasekhar R, Ma WW, Flaherty L, Iyer R, et al. Change in CA 19-9 levels after chemoradiotherapy pre-dicts survival in patients with locally advanced unresectable pan-creatic cancer. J Gastrointest Oncol 2013;4:361-9.
24. Davison J, Mercier G, Russo G, Subramaniam RM. PET-based primary tumor volumetric parameters and survival of patients with non-small cell lung carcinoma. AJR Am J Roentgenol 2013;200: 635-40.
25. Moon SH, Hyun SH, Choi JY. Prognostic significance of volume-based PET parameters in cancer patients. Korean J Radiol 2013; 14:1-12.
26. Van de Wiele C, Kruse V, Smeets P, Sathekge M, Maes A. Predic-tive and prognostic value of metabolic tumour volume and total lesion glycolysis in solid tumours. Eur J Nucl Med Mol Imaging 2013;40:290-301.
27. Kang WJ, Chung JK, So Y, Jeong JM, Lee DS, Lee MC. Differen-tiation of mediastinal FDG uptake observed in patients with non-thoracic tumours. Eur J Nucl Med Mol Imaging 2004;31:202-7. 28. Nakamoto Y, Higashi T, Sakahara H, Tamaki N, Kogire M, Doi R,
et al. Delayed (18)F-fluoro-2-deoxy-D-glucose positron emission tomography scan for differentiation between malignant and be-nign lesions in the pancreas. Cancer 2000;89:2547-54.
29. Orlacchio A, Schillaci O, Antonelli L, D’Urso S, Sergiacomi G, Nicolì P, et al. Solitary pulmonary nodules: morphological and metabolic characterisation by FDG-PET-MDCT. Radiol Med 2007;112:157-73.
30. Uto F, Shiba E, Onoue S, Yoshimura H, Takada M, Tsuji Y, et al. Phantom study on radiotherapy planning using PET/CT--delinea-tion of GTV by evaluating SUV. J Radiat Res 2010;51:157-64. 31. Hazel JJ, Thirlwell MP, Huggins M, Maksymiuk A, MacFarlane
JK. Multi-drug chemotherapy with and without radiation for car-cinoma of the stomach and pancreas: a prospective randomized trial. J Can Assoc Radiol 1981;32:164-5.
32. Huguet F, André T, Hammel P, Artru P, Balosso J, Selle F, et al. Impact of chemoradiotherapy after disease control with chemo-therapy in locally advanced pancreatic adenocarcinoma in GER-COR phase II and III studies. J Clin Oncol 2007;25:326-31. 33. Iacobuzio-Donahue CA, Fu B, Yachida S, Luo M, Abe H,
Hen-derson CM, et al. DPC4 gene status of the primary carcinoma cor-relates with patterns of failure in patients with pancreatic cancer. J Clin Oncol 2009;27:1806-13.
34. Crane CH, Varadhachary GR, Yordy JS, Staerkel GA, Javle MM, Safran H, et al. Phase II trial of cetuximab, gemcitabine, and oxali-platin followed by chemoradiation with cetuximab for locally ad-vanced (T4) pancreatic adenocarcinoma: correlation of Smad4 (Dpc4) immunostaining with pattern of disease progression. J Clin Oncol 2011;29:3037-43.
35. Park HH, Park DS, Kweon DC, Lee SB, Oh KB, Lee JD, et al. In-ter-comparison of 18F-FDG PET/CT standardized uptake values in Korea. Appl Radiat Isot 2011;69:241-6.
locally advanced unresectable pancreatic cancer. Definitive results of the 2000-01 FFCD/SFRO study. Ann Oncol 2008;19:1592-9. 9. Klaassen DJ, MacIntyre JM, Catton GE, Engstrom PF, Moertel CG.
Treatment of locally unresectable cancer of the stomach and pancre-as: a randomized comparison of 5-fluorouracil alone with radiation plus concurrent and maintenance 5-fluorouracil--an Eastern Coop-erative Oncology Group study. J Clin Oncol 1985;3:373-8. 10. Hammel P, Huguet F, van Laethem JL, Goldstein D, Glimelius B,
Borbath I, et al. Comparison of chemoradiotherapy (CRT) and chemotherapy (CT) in patients with locally advanced pancreatic cancer (LAPC) controlled after 4 months of gemcitabine with or without erlotinib: final results of the international phase III LAP 07 study. Pancreatology 2013;13:S89.
11. Kauhanen SP, Komar G, Seppänen MP, Dean KI, Minn HR, Kaja-nder SA, et al. A prospective diagnostic accuracy study of 18F-flu-orodeoxyglucose positron emission tomography/computed tomog-raphy, multidetector row computed tomogtomog-raphy, and magnetic resonance imaging in primary diagnosis and staging of pancreatic cancer. Ann Surg 2009;250:957-63.
12. Topkan E, Parlak C, Kotek A, Yapar AF, Pehlivan B. Predictive value of metabolic 18FDG-PET response on outcomes in patients with locally advanced pancreatic carcinoma treated with definitive concurrent chemoradiotherapy. BMC Gastroenterol 2011;11:123. 13. Choi HJ, Kang CM, Lee WJ, Song SY, Cho A, Yun M, et al. Prog-nostic value of 18F-fluorodeoxyglucose positron emission tomog-raphy in patients with resectable pancreatic cancer. Yonsei Med J 2013;54:1377-83.
14. Lee SM, Kim TS, Lee JW, Kim SK, Park SJ, Han SS. Improved prognostic value of standardized uptake value corrected for blood glucose level in pancreatic cancer using F-18 FDG PET. Clin Nucl Med 2011;36:331-6.
15. Hwang JP, Lim I, Chang KJ, Kim BI, Choi CW, Lim SM. Prog-nostic value of SUVmax measured by Fluorine-18 Fluorodeoxy-glucose Positron Emission Tomography with Computed Tomog-raphy in Patients with Pancreatic Cancer. Nucl Med Mol Imaging 2012;46:207-14.
16. Moon SY, Joo KR, So YR, Lim JU, Cha JM, Shin HP, et al. Pre-dictive value of maximum standardized uptake value (SUVmax) on 18F-FDG PET/CT in patients with locally advanced or meta-static pancreatic cancer. Clin Nucl Med 2013;38:778-83. 17. Fendler WP, Philippe Tiega DB, Ilhan H, Paprottka PM,
Heine-mann V, Jakobs TF, et al. Validation of several SUV-based param-eters derived from 18F-FDG PET for prediction of survival after SIRT of hepatic metastases from colorectal cancer. J Nucl Med 2013;54:1202-8.
18. Oh JR, Seo JH, Chong A, Min JJ, Song HC, Kim YC, et al. Whole-body metabolic tumour volume of 18F-FDG PET/CT im-proves the prediction of prognosis in small cell lung cancer. Eur J Nucl Med Mol Imaging 2012;39:925-35.
19. Ryu IS, Kim JS, Roh JL, Lee JH, Cho KJ, Choi SH, et al. Prog-nostic value of preoperative metabolic tumor volume and total le-sion glycolysis measured by 18F-FDG PET/CT in salivary gland carcinomas. J Nucl Med 2013;54:1032-8.
20. Parlak C, Topkan E, Onal C, Reyhan M, Selek U. Prognostic val-ue of gross tumor volume delineated by FDG-PET-CT based ra-diotherapy treatment planning in patients with locally advanced pancreatic cancer treated with chemoradiotherapy. Radiat Oncol 2012;7:37.