R E S E A R C H A R T I C L E
Open Access
The differences in healthcare utilization for
dental caries based on the implementation
of water fluoridation in South Korea
Myung-Soo Cho
1,2†, Kyu-Tae Han
3,4†, Sohee Park
5, Ki Tae Moon
6and Eun-Cheol Park
4,7*Abstract
Background: There were some debates about the water fluoridation program in South Korea, even if the program had generally substantial effectiveness. Because the out-of-pocket expenditures for dental care were higher in South Korea than in other countries, an efficient solution was needed. Therefore, we examined the relationship between the implementation of water fluoridation and the utilization of dental care.
Methods: We used the National Health Insurance Service National Sample Cohort. In this study, data finally included 472,250 patients who were newly diagnosed with dental caries during 2003–2013. We performed survival analysis using cox proportional hazard model, negative binomial-regression, and regression analyses using generalized estimating equation models.
Results: There were 48.49 % outpatient dental care visit during study period. Individuals with water fluoridation had a lower risk of dental care visits (HR = 0.949, 95 % CI = 0.928–0.971). Among the individuals who experienced a dental care visit, those with water fluoridation program had a lower number of dental care visits (β = −0.029), and the period of water fluoridation had an inverse association with the dental care expenditures.
Conclusion: The implementation of water fluoridation programs and these periods are associated with reducing the utilization of dental health care. Considering these positive impacts, healthcare professionals must consider preventive strategies for activating water fluoridation programs, such as changes in public perception and relations, for the effective management of dental care in South Korea.
Keywords: Water fluoridation, Dental caries, Healthcare expenditures, Public program
Background
Dental caries are the most common diseases related to oral health worldwide [1]. The insufficient management of oral health to prevent dental caries could cause several symptoms and large cost burdens associated with the treatment of dental caries. Naturally, many strategies for preventing dental caries were developed, such as the improvement of oral health behaviors, changes in dietary patterns, the brushing of teeth, the use of fluoride toothpaste, flu dental screenings, dental
scaling, and water fluoridation programs [2–4]. Re-cently, the oral health, especially that related to dental caries, of individuals has been generally improved com-pared with that in the past [5].
Water fluoridation is a program that introduces fluor-ide at an optimal level into drinking water to improve pubic dental health. It was first introduced in Grand Rapids in 1945 and was considered effective in the pre-vention of dental caries [6]. A previous report by the World Health Organization (WHO) suggested that the program could positively affect oral health, and the WHO recommended introducing water fluoridation in countries where such programs would be technically and culturally feasible [7]. Hence, many countries began to introduce water fluoridation. In the previous study which was conducted based on systematic review in UK, * Correspondence:[email protected]
†Equal contributors 4
Institute of Health Services Research, Yonsei University College of Medicine, Seoul, Republic of Korea
7Department of Preventive Medicine, Yonsei University College of Medicine,
Seoul, Republic of Korea
Full list of author information is available at the end of the article
© The Author(s). 2016 Open Access This article is distributed under the terms of the Creative Commons Attribution 4.0 International License (http://creativecommons.org/licenses/by/4.0/), which permits unrestricted use, distribution, and reproduction in any medium, provided you give appropriate credit to the original author(s) and the source, provide a link to the Creative Commons license, and indicate if changes were made. The Creative Commons Public Domain Dedication waiver (http://creativecommons.org/publicdomain/zero/1.0/) applies to the data made available in this article, unless otherwise stated. Choet al. BMC Oral Health (2016) 16:119
the water fluoridation had positive impact for reducing dental caries about 14 % [8]. This program in New Zealand and Australia also made about positive out-comes in oral health related to dental caries [9, 10]. The result in Japan also showed that positive effect too [11].
Since 1981, South Korea has implemented and grad-ually expanded a water fluoridation program. In 2002, the 32 regions among the ~250 regions in South Korea had implemented water fluoridation programs [12]. Since the late 1990s, some concerns about adverse effects of water fluoridation have been generally raised through media sources in South Korea. Each local gov-ernment, with the support of voters, faces choices in its decision making for the implementation of water fluor-idation. The expansion of water fluoridation thus faces difficulties, even if the program is effective in aspects of both quality of life and costs. Finally, only 17 regions im-plemented water fluoridation in 2013. Previous studies suggest, however, that there have been no significant adverse effects of introducing water fluoridation since the beginning of the 21st century [7, 8, 13].
Because of the effectiveness of water fluoridation and the continuous progress against dental caries in South Korea (age-adjusted prevalence rates of dental caries: 39.1 % in 2007, 31.4 % in 2014), we assumed that water fluoridation programs could significantly affect the re-duction of dental caries in South Korea [14]. Although some previous studies in South Korea examined the ef-fectiveness of water fluoridation, there were no studies took the perspective of the whole nation in South Korea. Also, the cost burden, including out-of-pocket expenses, for dental care is one of the major causes of medical expenditures (2011: Organization for Economic Co-operation and Development [OECD] average = 55 %, South Korea = 84 %) [15]. Therefore, we examined the relationship between the implementation of water fluor-idation and the utilization of dental care using national sample cohort data. Based on our findings, we expect that decision makers could make appropriate strategies for the management of oral health in South Korea.
Methods Study population
The data used in this study was the National Health Insurance Service National Sample Cohort 2002–2013. It include a random sample of 1,025,340 individuals as about 2.2 % of the overall South Korean in 2002. To rep-resent total medical expenditure per year of South Korean within each of 1,476 strata (defined by age, sex, types of insurance coverage, and income level), this data was made through using probability sampling methods, and the model used proportional allocation. Thus, total medical claims of 1,025,340 individuals during 2002– 2013 was included in this data. To examine the
association between the implementation of water fluor-idation program and the utilization of outpatient care for dental caries, represented by factors such as the fre-quency of outpatient visits and the medical expenditures by individuals, we only included patients who lived in non-metropolitan areas, because water fluoridation pro-grams were rarely implemented in metropolitan areas (one metropolitan area in 2013). Then, we included only the patients who were newly diagnosed with dental car-ies (International Classification of Diseases [ICD]-10: K02) through outpatient care after 2003 (589,346 pa-tients). We excluded those who were first diagnosed with dental caries before 2003 to ensure that only newly diagnosed patients were included. These patients were annually followed up. Finally, the data included 472,250 patients in 164 regions during 2003–2013 (average 9.12 years follow up). In addition, we added information about which regions had implemented water fluoridation from the Ministry of Health & Welfare. Regional vari-ables were obtained from the ‘e-provincial indicators’ which was collected by Statistics Korea. It contained the regional characteristics of about 250 Si-Gun-Gu in South Korea. This data was used in this study for reflecting regional characteristics for each region where the patients with dental caries lived.
Variables
The outcome variables used in this study were based on information about healthcare utilization for dental caries within the study population. The first outcome variable used in this study was whether each patient visited to dental clinic due to dental caries through outpatient care during study period. Next, other outcome variables were used in this study were the frequencies of dental care visits and the cost of outpatient care as indicators of medical expenditures for only the patients who had ex-perienced outpatient care for dental caries in each year.
The major variables of interest were whether or not each community implemented water fluoridation during the study period and how long the period of the gram was. Based on 2013, the water fluoridation pro-gram was implemented in 13 Si-Gun-Gu among 164 non-metropolitan areas. In this study, the patients who lived in those regions were considered to live in regions where water fluoridation had been implemented. Add-itionally, to consider the effect of the time since the ini-tial implementation the program, the time since the implementation of water fluoridation was also included in this study. We hypothesized that the implementation of water fluoridation and the time since the implementa-tion in each region would affect the outpatient visits and medical expenditures by the patients.
The patients and regional variables were controlled in analyses for association between water fluoridation and
the outcome variables. The patient variables were as fol-lows: age, sex, income, type of insurance coverage, study year, dental care expenditures in the previous year, den-tal care visits in the previous year, dentofacial anomalies, and disorders of tooth development and eruption. The patients’ age was categorized based on 10 years. The in-come was divided into deciles based on mean household
income as follows: ≤10, 11–20, 21–30, 31–40, 41–50,
51–60, 61–70, 71–80, 81–90, and ≥91 %. The types of insurance coverage were categorized based on the NHI criteria as: medical aid, National Health Insurance (NHI) employee insurance, or NHI self-employed insurance. First, medical aid was defined as individuals with income less than poverty level in South Korea or individuals with a physical or mental disability. They could receive the healthcare services as free or low copayment by gov-ernment funds. And, the other individuals were defined as NHI beneficiaries. The NHI beneficiaries were catego-rized in employee or self-employed based on job status. If individuals included workers and employers in all workplaces, they were included to NHI employee insur-ance, and paid a premium of about 7 % in their monthly income as withholding tax.The NHI self-employed in-surance defined as individuals who did not fall into the NHI employee insurance group. They paid NHI pre-mium based on their income, property, and living stand-ard. Thus, this category could reflect the socio-economic status of each individual. We also included the number of pre-dental care visits, the pre-dental care cost, dento-facial anomalies (ICD-10: K07), and disorders of tooth development and eruption (ICD-10: K00) to adjust the severity of disease which could affect to the risk in den-tal caries in each patient. The number of pre-denden-tal care visits was defined as the number of outpatient visits re-lated to dental care during the previous year after the baseline year. The pre-dental care costs were calculated as the sum of the healthcare expenditures for dental care during the previous year after the baseline year. Dentofa-cial anomalies and disorders of tooth development and eruption were defined based on whether the patient was diagnosed with those symptoms as comorbidities in a specific year. The regional variables were the number of dentists per 1,000 people and the financial independence rate of the local government. The financial independence rate of the local government is an index of the finance utilization capacity of a local government with independ-ent discretionary power. It was calculated as follows: (local taxes + non tax revenue)/budgets of local govern-ment × 100.
Statistical analysis
First, we showed the frequencies of categorical variable and averages of continuous variable to examine the dis-tribution of general characteristics at the baseline. We
also performed χ2 tests and Cochran–Mantel–Haenszel tests to investigate the association between each categorical variables and visiting dental care by the implementation of water fluoridation as unit of person-years during study period. Next, we showed the averages and standard deviation of each continu-ous variable at the baseline and also performed a Mann-Whitney test, a Kruskal-Wallis test, and an analysis of covariance for continuous variable by the water fluoridation program during the study period. We also showed the Kaplan-Meier survival curve to compare the risk for visiting dental care by the water fluoridation. Finally, we performed a survival analysis using cox proportional hazard model to investigate whether patient visited to dental clinic due to dental caries during study period. Then, for the patients who had experienced outpatient care for dental caries dur-ing the study period, to examine the associations with the number of dental care visits and the dental care expenditures, we performed a multiple negative bino-mial regression, and regression analysis using a Generalized Estimating Equation (GEE) model with link logit regarding the overdispersion of outcome variables [16]. Additionally, we performed subgroup analyses according to age group or experience of pre-dental care within each region to examine the differ-ence of association related to water fluoridation. The statistical analyses in used this study were analyzed using SAS statistical software version 9.4.
Results
The data included 472,250 patients at baseline.
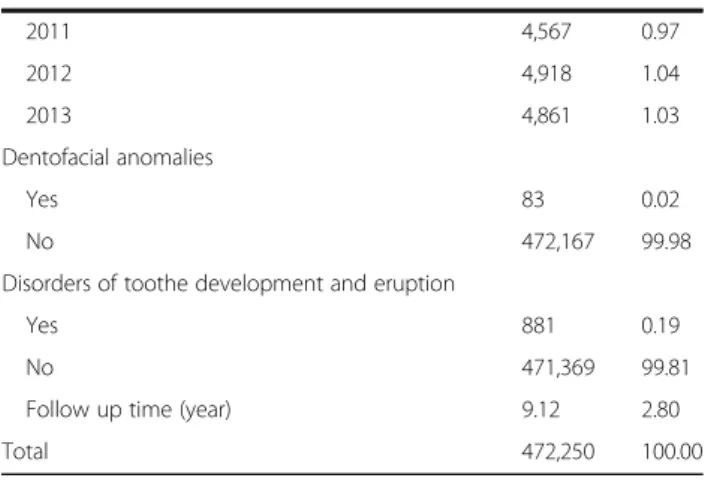
Appendix 1 shows the general characteristics of the study population at baseline. The patients with water fluoridation were 10.40 % of the total patients at baseline. The average follow-up time was 9.12 years during the study period.
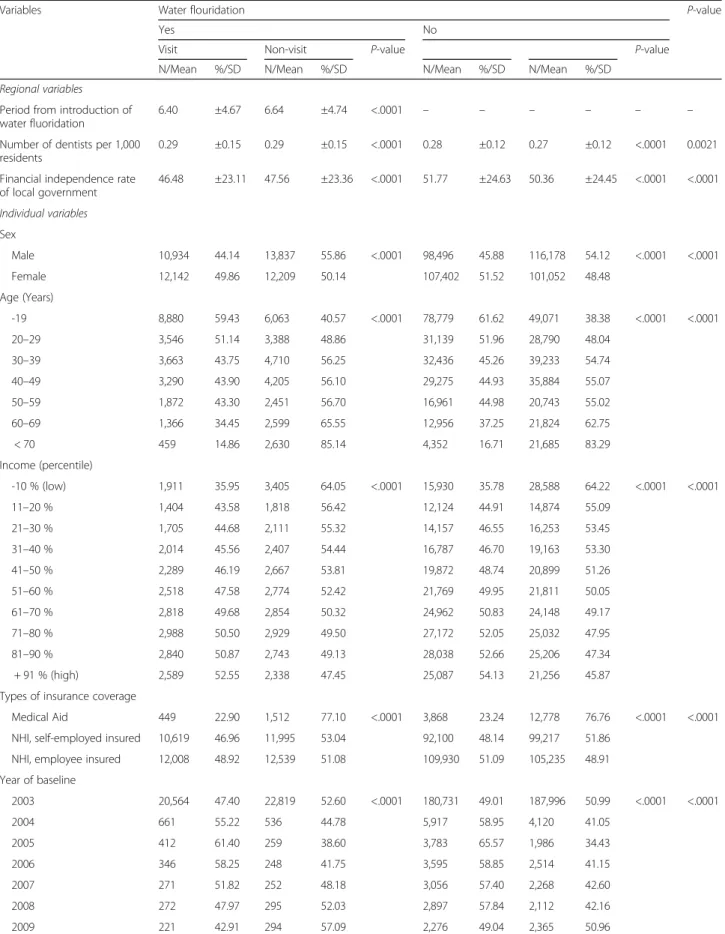
Table 1 shows the associations among the patient and regional characteristics of baseline, the outpatient dental care visits for dental caries, and the presence of water fluoridation during the study period. The average per-centage of patients that experienced an outpatient dental visit was 46.98 % in regions with water fluoridation and 48.66 % in regions without water fluoridation, respect-ively (p-value < .0001). The distributions of the other in-dependent variables based on water fluoridation were similar among the groups. Females more frequently experienced outpatient dental care than males (p-value < .0001). In addition, younger or wealthier groups were generally more likely to make dental visits because of dental caries than other groups (p-value < .0001). Benefi-ciaries of NHI employee insurance more visited to dental care than individuals with other types of insur-ance (p-value < .0001).
Table 1 The association between baseline characteristics and dental care visit during study period by water fluoridation program
Variables Water flouridation P-value
Yes No
Visit Non-visit P-value P-value
N/Mean %/SD N/Mean %/SD N/Mean %/SD N/Mean %/SD
Regional variables Period from introduction of water fluoridation
6.40 ±4.67 6.64 ±4.74 <.0001 – – – – – –
Number of dentists per 1,000 residents
0.29 ±0.15 0.29 ±0.15 <.0001 0.28 ±0.12 0.27 ±0.12 <.0001 0.0021
Financial independence rate of local government 46.48 ±23.11 47.56 ±23.36 <.0001 51.77 ±24.63 50.36 ±24.45 <.0001 <.0001 Individual variables Sex Male 10,934 44.14 13,837 55.86 <.0001 98,496 45.88 116,178 54.12 <.0001 <.0001 Female 12,142 49.86 12,209 50.14 107,402 51.52 101,052 48.48 Age (Years) -19 8,880 59.43 6,063 40.57 <.0001 78,779 61.62 49,071 38.38 <.0001 <.0001 20–29 3,546 51.14 3,388 48.86 31,139 51.96 28,790 48.04 30–39 3,663 43.75 4,710 56.25 32,436 45.26 39,233 54.74 40–49 3,290 43.90 4,205 56.10 29,275 44.93 35,884 55.07 50–59 1,872 43.30 2,451 56.70 16,961 44.98 20,743 55.02 60–69 1,366 34.45 2,599 65.55 12,956 37.25 21,824 62.75 < 70 459 14.86 2,630 85.14 4,352 16.71 21,685 83.29 Income (percentile) -10 % (low) 1,911 35.95 3,405 64.05 <.0001 15,930 35.78 28,588 64.22 <.0001 <.0001 11–20 % 1,404 43.58 1,818 56.42 12,124 44.91 14,874 55.09 21–30 % 1,705 44.68 2,111 55.32 14,157 46.55 16,253 53.45 31–40 % 2,014 45.56 2,407 54.44 16,787 46.70 19,163 53.30 41–50 % 2,289 46.19 2,667 53.81 19,872 48.74 20,899 51.26 51–60 % 2,518 47.58 2,774 52.42 21,769 49.95 21,811 50.05 61–70 % 2,818 49.68 2,854 50.32 24,962 50.83 24,148 49.17 71–80 % 2,988 50.50 2,929 49.50 27,172 52.05 25,032 47.95 81–90 % 2,840 50.87 2,743 49.13 28,038 52.66 25,206 47.34 + 91 % (high) 2,589 52.55 2,338 47.45 25,087 54.13 21,256 45.87
Types of insurance coverage
Medical Aid 449 22.90 1,512 77.10 <.0001 3,868 23.24 12,778 76.76 <.0001 <.0001
NHI, self-employed insured 10,619 46.96 11,995 53.04 92,100 48.14 99,217 51.86
NHI, employee insured 12,008 48.92 12,539 51.08 109,930 51.09 105,235 48.91
Year of baseline 2003 20,564 47.40 22,819 52.60 <.0001 180,731 49.01 187,996 50.99 <.0001 <.0001 2004 661 55.22 536 44.78 5,917 58.95 4,120 41.05 2005 412 61.40 259 38.60 3,783 65.57 1,986 34.43 2006 346 58.25 248 41.75 3,595 58.85 2,514 41.15 2007 271 51.82 252 48.18 3,056 57.40 2,268 42.60 2008 272 47.97 295 52.03 2,897 57.84 2,112 42.16 2009 221 42.91 294 57.09 2,276 49.04 2,365 50.96
Appendix 2 shows the Kaplan-Meier survival curve for time to first diagnosis of dental caries by the im-plementation water fluoridation. Individuals in regions with water fluoridation program was less likely to visit dental care than individuals in regions without program (p-value for log-rank test < .0001).
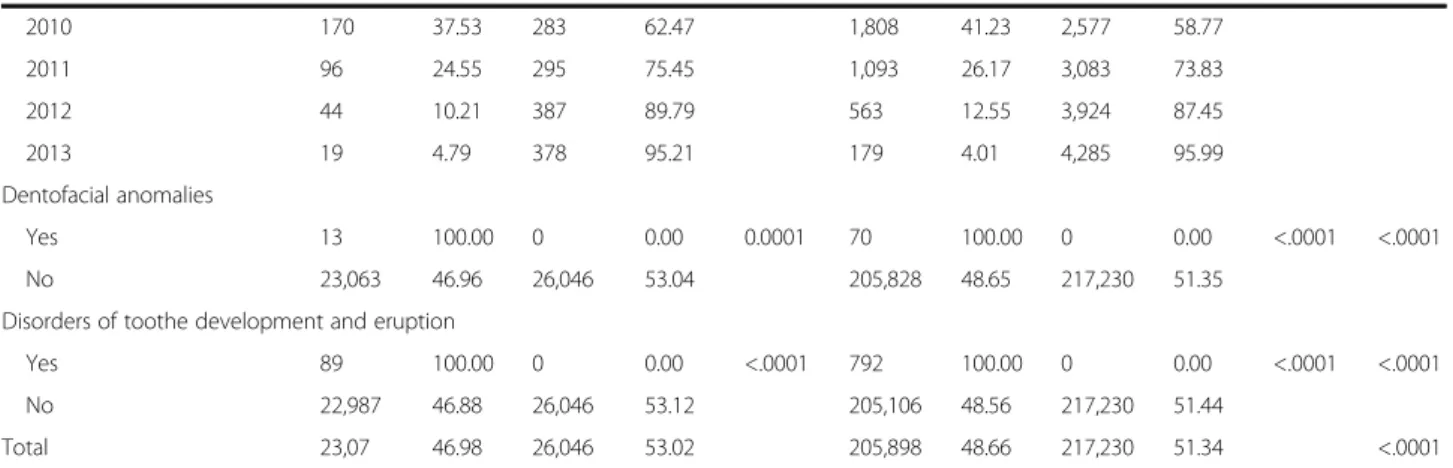
Table 2 shows the distribution based on water fluorid-ation of the average values and the standard devifluorid-ation for dental care visits or cost per year among only the pa-tients who made dental visits because of dental caries. The average number of dental care visits and the costs were lower among patients with water fluoridation than among those without the program (p-value < .0001).
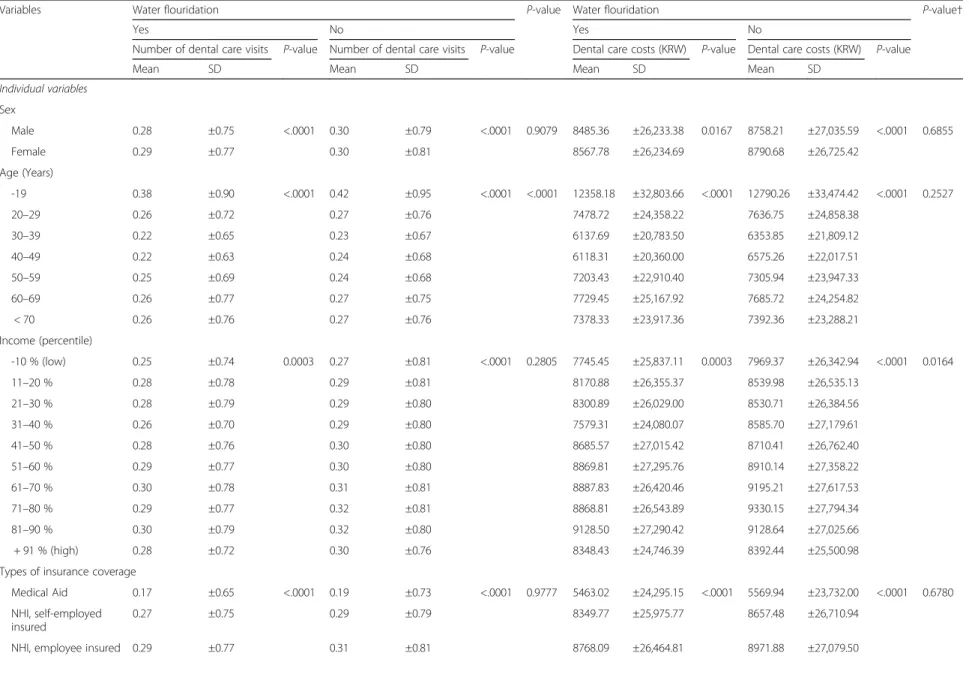
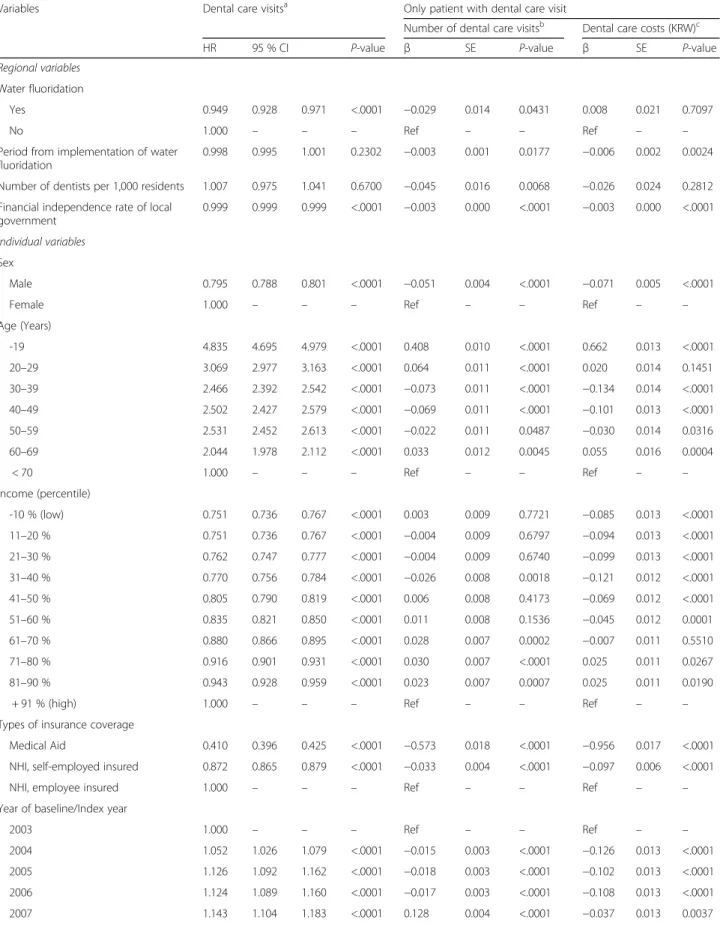
Table 3 shows the results of the survival analysis using cox proportional hazard model, negative binomial re-gression, and regression analysis for dental care expendi-tures, represented by the number of visits or the costs, among only the patients that experienced a dental visit. Patient with water fluoridation program had higher risk in the dental care visit during study period (Yes = HR: 0.949, 95 % CI: 0.928–0.971, p-value < .0001). Female and younger people was had more tend to dental care visits due to dental caries (p-value < .0001). By the eco-nomic status, people with higher income or employee insured NHI had high risk in dental care visits than other groups (p-value < .0001). In addition, people with dental comorbidities was also more visited in dental care (p-value < .0001).
The results of the regression analysis for dental care expenditures showed that patients in regions that implemented a water fluoridation program had a lower number of dental visits or lower costs, although the results about dental care cost was not statistically signifi-cant (number of dental visits: β = −0.029, p-value = 0.0431; dental care costs: β = −0.008, p-value = 0.7097). In addition, patients in regions with more dentists made less dental visits and spent less on dental care. On the
other hand, the financial independence rate in each re-gion had an inverse association with the risk of dental visits (p-value < .05). For the patient characteristics, males had an inverse association with the number of dental visits and costs (p-value < .0001). On the other hand, beneficiaries of Medical Aid or self-employed NHI had a lower number of dental visits and lower costs than beneficiaries of employee NHI (p-value < .05). Expenditures related to pre-dental care or comorbidity had a positive association with the out-come variables (p-value < .001).
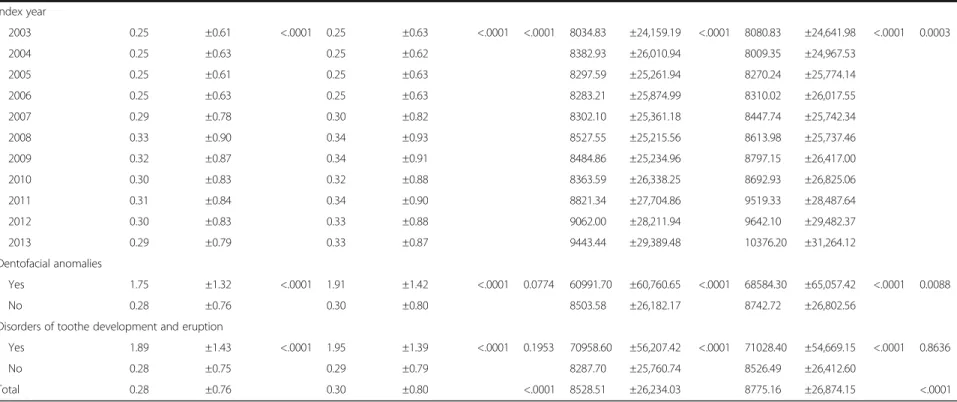
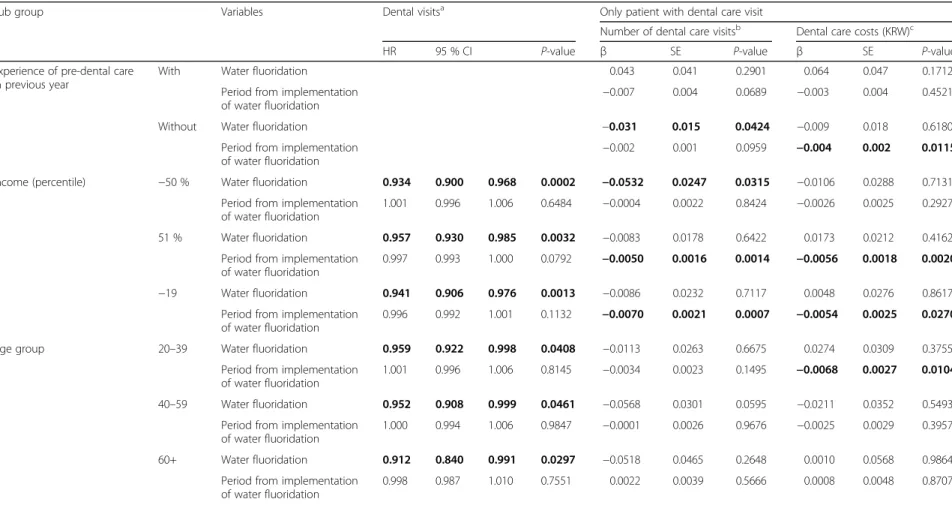
We performed subgroup analyses for the survival ana-lysis using cox proportional hazard model, negative bi-nomial regression, and regression analyses using GEE models to investigate the relationship between water fluoridation and the outcome variables based on experi-ence of pre-dental care visits (visit or no visit), income (−50 % and +51 %), and age group (≤19 years, 20–39 years, 40–59 years, ≥60 years). The associations between the presence of a water fluoridation program and the number of dental visits was greater for patients who had not experienced a pre-dental care visit in the previous year than for patients who had experienced a pre-dental care visit in the previous year (with, water fluoridation =β: 0.043, p-value = 0.2901; without, water
fluoridation =β: −0.031, p-value = 0.0424). By age
group, the inverse associations between water fluoridation and outcome variables were greater in the elderly popula-tion than in the younger populapopula-tion. In the younger groups, the inverse associations with dental care expendi-tures were analyzed based on period from implementation of water fluoridation (Table 4).
Discussion
To effectively manage oral health, and particularly patients with dental caries in South Korea, the South Korean government has introduced water fluoridation
Table 1 The association between baseline characteristics and dental care visit during study period by water fluoridation program (Continued) 2010 170 37.53 283 62.47 1,808 41.23 2,577 58.77 2011 96 24.55 295 75.45 1,093 26.17 3,083 73.83 2012 44 10.21 387 89.79 563 12.55 3,924 87.45 2013 19 4.79 378 95.21 179 4.01 4,285 95.99 Dentofacial anomalies Yes 13 100.00 0 0.00 0.0001 70 100.00 0 0.00 <.0001 <.0001 No 23,063 46.96 26,046 53.04 205,828 48.65 217,230 51.35
Disorders of toothe development and eruption
Yes 89 100.00 0 0.00 <.0001 792 100.00 0 0.00 <.0001 <.0001
No 22,987 46.88 26,046 53.12 205,106 48.56 217,230 51.44
Total 23,07 46.98 26,046 53.02 205,898 48.66 217,230 51.34 <.0001
†The results of a Cochran–Mantel–Haenszel test to investigate the differences of distribution for categorical variables based on water fluoridation
Table 2 The averages and standard deviations of dental care visits and costs for patients who visited dental care through outpatient care†
Variables Water flouridation P-value Water flouridation P-value†
Yes No Yes No
Number of dental care visits P-value Number of dental care visits P-value Dental care costs (KRW) P-value Dental care costs (KRW) P-value Mean SD Mean SD Mean SD Mean SD
Individual variables Sex Male 0.28 ±0.75 <.0001 0.30 ±0.79 <.0001 0.9079 8485.36 ±26,233.38 0.0167 8758.21 ±27,035.59 <.0001 0.6855 Female 0.29 ±0.77 0.30 ±0.81 8567.78 ±26,234.69 8790.68 ±26,725.42 Age (Years) -19 0.38 ±0.90 <.0001 0.42 ±0.95 <.0001 <.0001 12358.18 ±32,803.66 <.0001 12790.26 ±33,474.42 <.0001 0.2527 20–29 0.26 ±0.72 0.27 ±0.76 7478.72 ±24,358.22 7636.75 ±24,858.38 30–39 0.22 ±0.65 0.23 ±0.67 6137.69 ±20,783.50 6353.85 ±21,809.12 40–49 0.22 ±0.63 0.24 ±0.68 6118.31 ±20,360.00 6575.26 ±22,017.51 50–59 0.25 ±0.69 0.24 ±0.68 7203.43 ±22,910.40 7305.94 ±23,947.33 60–69 0.26 ±0.77 0.27 ±0.75 7729.45 ±25,167.92 7685.72 ±24,254.82 < 70 0.26 ±0.76 0.27 ±0.76 7378.33 ±23,917.36 7392.36 ±23,288.21 Income (percentile) -10 % (low) 0.25 ±0.74 0.0003 0.27 ±0.81 <.0001 0.2805 7745.45 ±25,837.11 0.0003 7969.37 ±26,342.94 <.0001 0.0164 11–20 % 0.28 ±0.78 0.29 ±0.81 8170.88 ±26,355.37 8539.98 ±26,535.13 21–30 % 0.28 ±0.79 0.29 ±0.80 8300.89 ±26,029.00 8530.71 ±26,384.56 31–40 % 0.26 ±0.70 0.29 ±0.80 7579.31 ±24,080.07 8585.70 ±27,179.61 41–50 % 0.28 ±0.76 0.30 ±0.80 8685.57 ±27,015.42 8710.41 ±26,762.40 51–60 % 0.29 ±0.77 0.30 ±0.80 8869.81 ±27,295.76 8910.14 ±27,358.22 61–70 % 0.30 ±0.78 0.31 ±0.81 8887.83 ±26,420.46 9195.21 ±27,617.53 71–80 % 0.29 ±0.77 0.32 ±0.81 8868.81 ±26,543.89 9330.15 ±27,794.34 81–90 % 0.30 ±0.79 0.32 ±0.80 9128.50 ±27,290.42 9128.64 ±27,025.66 + 91 % (high) 0.28 ±0.72 0.30 ±0.76 8348.43 ±24,746.39 8392.44 ±25,500.98 Types of insurance coverage
Medical Aid 0.17 ±0.65 <.0001 0.19 ±0.73 <.0001 0.9777 5463.02 ±24,295.15 <.0001 5569.94 ±23,732.00 <.0001 0.6780 NHI, self-employed
insured
0.27 ±0.75 0.29 ±0.79 8349.77 ±25,975.77 8657.48 ±26,710.94 NHI, employee insured 0.29 ±0.77 0.31 ±0.81 8768.09 ±26,464.81 8971.88 ±27,079.50
Cho et al. BMC Oral Health (2016) 16:119 Page 6 of 14
Table 2 The averages and standard deviations of dental care visits and costs for patients who visited dental care through outpatient care† (Continued) Index year 2003 0.25 ±0.61 <.0001 0.25 ±0.63 <.0001 <.0001 8034.83 ±24,159.19 <.0001 8080.83 ±24,641.98 <.0001 0.0003 2004 0.25 ±0.63 0.25 ±0.62 8382.93 ±26,010.94 8009.35 ±24,967.53 2005 0.25 ±0.61 0.25 ±0.63 8297.59 ±25,261.94 8270.24 ±25,774.14 2006 0.25 ±0.63 0.25 ±0.63 8283.21 ±25,874.99 8310.02 ±26,017.55 2007 0.29 ±0.78 0.30 ±0.82 8302.10 ±25,361.18 8447.74 ±25,742.34 2008 0.33 ±0.90 0.34 ±0.93 8527.55 ±25,215.56 8613.98 ±25,737.46 2009 0.32 ±0.87 0.34 ±0.91 8484.86 ±25,234.96 8797.15 ±26,417.00 2010 0.30 ±0.83 0.32 ±0.88 8363.59 ±26,338.25 8692.93 ±26,825.06 2011 0.31 ±0.84 0.34 ±0.90 8821.34 ±27,704.86 9519.33 ±28,487.64 2012 0.30 ±0.83 0.33 ±0.88 9062.00 ±28,211.94 9642.10 ±29,482.37 2013 0.29 ±0.79 0.33 ±0.87 9443.44 ±29,389.48 10376.20 ±31,264.12 Dentofacial anomalies Yes 1.75 ±1.32 <.0001 1.91 ±1.42 <.0001 0.0774 60991.70 ±60,760.65 <.0001 68584.30 ±65,057.42 <.0001 0.0088 No 0.28 ±0.76 0.30 ±0.80 8503.58 ±26,182.17 8742.72 ±26,802.56
Disorders of toothe development and eruption
Yes 1.89 ±1.43 <.0001 1.95 ±1.39 <.0001 0.1953 70958.60 ±56,207.42 <.0001 71028.40 ±54,669.15 <.0001 0.8636 No 0.28 ±0.75 0.29 ±0.79 8287.70 ±25,760.74 8526.49 ±26,412.60
Total 0.28 ±0.76 0.30 ±0.80 <.0001 8528.51 ±26,234.03 8775.16 ±26,874.15 <.0001
† The results of analysis of covariance to investigate the differences of distribution for continuous variables based on water fluoridation
Cho et al. BMC Oral Health (2016) 16:119 Page 7 of 14
Table 3 The results of survival analysis, negative binomial regression, and regression for dental care visits and expenditures including both patient and regional characteristics
Variables Dental care visitsa Only patient with dental care visit
Number of dental care visitsb Dental care costs (KRW)c
HR 95 % CI P-value β SE P-value β SE P-value
Regional variables Water fluoridation
Yes 0.949 0.928 0.971 <.0001 −0.029 0.014 0.0431 0.008 0.021 0.7097
No 1.000 – – – Ref – – Ref – –
Period from implementation of water fluoridation
0.998 0.995 1.001 0.2302 −0.003 0.001 0.0177 −0.006 0.002 0.0024
Number of dentists per 1,000 residents 1.007 0.975 1.041 0.6700 −0.045 0.016 0.0068 −0.026 0.024 0.2812
Financial independence rate of local government
0.999 0.999 0.999 <.0001 −0.003 0.000 <.0001 −0.003 0.000 <.0001
Individual variables Sex
Male 0.795 0.788 0.801 <.0001 −0.051 0.004 <.0001 −0.071 0.005 <.0001
Female 1.000 – – – Ref – – Ref – –
Age (Years) -19 4.835 4.695 4.979 <.0001 0.408 0.010 <.0001 0.662 0.013 <.0001 20–29 3.069 2.977 3.163 <.0001 0.064 0.011 <.0001 0.020 0.014 0.1451 30–39 2.466 2.392 2.542 <.0001 −0.073 0.011 <.0001 −0.134 0.014 <.0001 40–49 2.502 2.427 2.579 <.0001 −0.069 0.011 <.0001 −0.101 0.013 <.0001 50–59 2.531 2.452 2.613 <.0001 −0.022 0.011 0.0487 −0.030 0.014 0.0316 60–69 2.044 1.978 2.112 <.0001 0.033 0.012 0.0045 0.055 0.016 0.0004 < 70 1.000 – – – Ref – – Ref – – Income (percentile) -10 % (low) 0.751 0.736 0.767 <.0001 0.003 0.009 0.7721 −0.085 0.013 <.0001 11–20 % 0.751 0.736 0.767 <.0001 −0.004 0.009 0.6797 −0.094 0.013 <.0001 21–30 % 0.762 0.747 0.777 <.0001 −0.004 0.009 0.6740 −0.099 0.013 <.0001 31–40 % 0.770 0.756 0.784 <.0001 −0.026 0.008 0.0018 −0.121 0.012 <.0001 41–50 % 0.805 0.790 0.819 <.0001 0.006 0.008 0.4173 −0.069 0.012 <.0001 51–60 % 0.835 0.821 0.850 <.0001 0.011 0.008 0.1536 −0.045 0.012 0.0001 61–70 % 0.880 0.866 0.895 <.0001 0.028 0.007 0.0002 −0.007 0.011 0.5510 71–80 % 0.916 0.901 0.931 <.0001 0.030 0.007 <.0001 0.025 0.011 0.0267 81–90 % 0.943 0.928 0.959 <.0001 0.023 0.007 0.0007 0.025 0.011 0.0190
+ 91 % (high) 1.000 – – – Ref – – Ref – –
Types of insurance coverage
Medical Aid 0.410 0.396 0.425 <.0001 −0.573 0.018 <.0001 −0.956 0.017 <.0001
NHI, self-employed insured 0.872 0.865 0.879 <.0001 −0.033 0.004 <.0001 −0.097 0.006 <.0001
NHI, employee insured 1.000 – – – Ref – – Ref – –
Year of baseline/Index year
2003 1.000 – – – Ref – – Ref – –
2004 1.052 1.026 1.079 <.0001 −0.015 0.003 <.0001 −0.126 0.013 <.0001
2005 1.126 1.092 1.162 <.0001 −0.018 0.003 <.0001 −0.102 0.013 <.0001
2006 1.124 1.089 1.160 <.0001 −0.017 0.003 <.0001 −0.108 0.013 <.0001
2007 1.143 1.104 1.183 <.0001 0.128 0.004 <.0001 −0.037 0.013 0.0037
programs since 1981 [12]. Previous studies of the water fluoridation programs showed that the programs had a positive role in preventing dental caries and improving oral health [10, 17, 18]. Based on those results, the water fluoridation programs seemed to gradually expand on the whole in South Korea. However, in the late 20th cen-tury, some concerns related to negative effects of water fluoridation, such as fluoride toxicity, were raised and proliferated. After that, the activation of the programs faced difficulties such as a negative public awareness. However, the previous studies of the adverse effects of water fluoridation found no significant adverse effects related to fluoride [7, 8, 13]. There was a need to change the public perception and provide evidence supporting the activation of water fluoridation programs for effect-ive public health. Therefore, we examined the relation-ship between the implementation of water fluoridation and dental care utilization by South Koreans using a na-tional sample cohort during 2003–2013.
Our findings showed that the implementation of the water fluoridation program in each region had a pre-ventive role, decreasing dental care utilizations such as dental visits and expenditures. In the regions with water fluoridation programs, the duration of the program had an inverse association with the number of dental visits per year. Those findings were similar to the findings of previous studies including results in the other countries [8–11]. Water fluoridation programs as a prevention strategy could positively affect the improvement of oral health, and individuals who lived in regions with water fluoridation had less need to access dental care
because of their improved oral health. The out-of-pocket expenditures for dental care in South Korea were remarkably higher than those in other OECD countries; introducing such prevention strategies had a quite positive affect on the reduction of the disease burden in South Korea [15]. Therefore, the implemen-tation of water fluoridation improved oral health in South Korea, and a national recommendation for the activation of this program would be worthwhile based on our findings.
In addition, our study suggests some interesting results related to other covariates. The results for the financial independence rate of the local government as an indirect indicator of regional wealth revealed some inequalities in oral health among regions based on wealth, even if some community oral health programs were already im-plemented [19]. Hence, governments need to consider public health programs, such as regular dental screening programs, which could reduce inequalities. Also, the pa-tients with a lower economic level, represented by in-come or type of insurance coverage, had a lower risk of dental visits and expenditures. Such results might be caused by the accessibility of health care. The wealthier individuals made more dental visits in the early stages of their clinical symptoms, and they used regular screening or consultation as part of primary and secondary pre-vention. On the other hand, individuals with low eco-nomic status could not make dental visits in the early stages of their symptoms and could not engage in pre-vention behaviors because of the cost burden [20, 21]. Therefore, the makers of health policy such as Korea
Table 3 The results of survival analysis, negative binomial regression, and regression for dental care visits and expenditures including both patient and regional characteristics (Continued)
2008 1.104 1.065 1.144 <.0001 0.209 0.004 <.0001 0.016 0.013 0.2238 2009 1.038 0.997 1.080 0.0710 0.192 0.004 <.0001 0.000 0.013 0.9752 2010 0.974 0.931 1.018 0.2418 0.176 0.004 <.0001 −0.073 0.013 <.0001 2011 0.736 0.695 0.779 <.0001 0.163 0.004 <.0001 0.079 0.013 <.0001 2012 0.483 0.445 0.523 <.0001 0.157 0.004 <.0001 0.045 0.013 0.0007 2013 0.304 0.265 0.350 <.0001 0.149 0.004 <.0001 0.091 0.014 <.0001
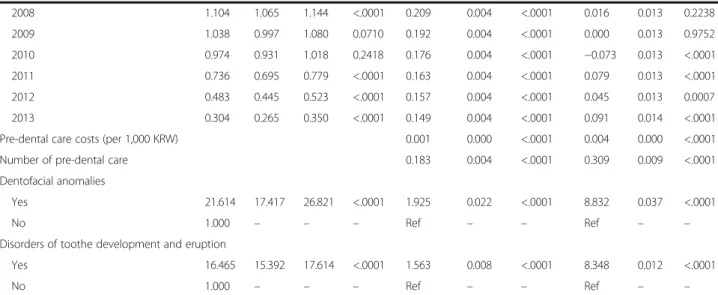
Pre-dental care costs (per 1,000 KRW) 0.001 0.000 <.0001 0.004 0.000 <.0001
Number of pre-dental care 0.183 0.004 <.0001 0.309 0.009 <.0001
Dentofacial anomalies
Yes 21.614 17.417 26.821 <.0001 1.925 0.022 <.0001 8.832 0.037 <.0001
No 1.000 – – – Ref – – Ref – –
Disorders of toothe development and eruption
Yes 16.465 15.392 17.614 <.0001 1.563 0.008 <.0001 8.348 0.012 <.0001
No 1.000 – – – Ref – – Ref – –
a
The survival analysis using cox proportional hazard models was applied to investigate the association with risk of dental care visits during study period
b
The negative binomial regression using GEE models was performed for patients who had experienced a dental care visit at least once per year to investigate the associations with dental care visits
c
The regression using GEE models was performed for patients who had experienced a dental care visit at least once per year to investigate the associations with dental care cost
Table 4 The results of subgroup analysis for survival analysis, negative binomial regression, and regression by pre-dental care and patient age
Sub group Variables Dental visitsa Only patient with dental care visit
Number of dental care visitsb Dental care costs (KRW)c HR 95 % CI P-value β SE P-value β SE P-value Experience of pre-dental care
in previous year
With Water fluoridation 0.043 0.041 0.2901 0.064 0.047 0.1712 Period from implementation
of water fluoridation
−0.007 0.004 0.0689 −0.003 0.004 0.4521 Without Water fluoridation −0.031 0.015 0.0424 −0.009 0.018 0.6180
Period from implementation
of water fluoridation −0.002
0.001 0.0959 −0.004 0.002 0.0115 Income (percentile) −50 % Water fluoridation 0.934 0.900 0.968 0.0002 −0.0532 0.0247 0.0315 −0.0106 0.0288 0.7131
Period from implementation of water fluoridation
1.001 0.996 1.006 0.6484 −0.0004 0.0022 0.8424 −0.0026 0.0025 0.2927 51 % Water fluoridation 0.957 0.930 0.985 0.0032 −0.0083 0.0178 0.6422 0.0173 0.0212 0.4162
Period from implementation of water fluoridation
0.997 0.993 1.000 0.0792 −0.0050 0.0016 0.0014 −0.0056 0.0018 0.0020 −19 Water fluoridation 0.941 0.906 0.976 0.0013 −0.0086 0.0232 0.7117 0.0048 0.0276 0.8617
Period from implementation of water fluoridation
0.996 0.992 1.001 0.1132 −0.0070 0.0021 0.0007 −0.0054 0.0025 0.0270 Age group 20–39 Water fluoridation 0.959 0.922 0.998 0.0408 −0.0113 0.0263 0.6675 0.0274 0.0309 0.3755
Period from implementation of water fluoridation
1.001 0.996 1.006 0.8145 −0.0034 0.0023 0.1495 −0.0068 0.0027 0.0104 40–59 Water fluoridation 0.952 0.908 0.999 0.0461 −0.0568 0.0301 0.0595 −0.0211 0.0352 0.5493
Period from implementation of water fluoridation
1.000 0.994 1.006 0.9847 −0.0001 0.0026 0.9676 −0.0025 0.0029 0.3957 60+ Water fluoridation 0.912 0.840 0.991 0.0297 −0.0518 0.0465 0.2648 0.0010 0.0568 0.9864
Period from implementation of water fluoridation
0.998 0.987 1.010 0.7551 0.0022 0.0039 0.5666 0.0008 0.0048 0.8707
The reference level of water fluoridation was that of regions without a program, and the period since the implementation of water fluoridation was a continuous variable The bold face indicates statistically significant results
These were results of sub group analyses for survival analysis and negative binomial regression analyses
a
The survival analysis using cox proportional hazard models was applied to investigate the association with the risk of dental care visits
b
The negative binomial regression using GEE model was performed for patients who had experienced a dental care visit at least once per year to investigate the associations with dental care visits.
c
The regression using GEE model was performed for patients who had experienced a dental care visit at least once per year to investigate the associations with dental care costs
Cho et al. BMC Oral Health (2016) 16:119 Page 10 of 14
Health Promotion Foundation must consider some in-terventions to reduce economic barriers for those with low economic status to reduce health inequalities caused by economic issues. Finally, there were results showing that younger patients or patients with comor-bidities utilized more dental care. Those results were similar to previous results about dental care. That is be-cause younger patients are at a period of change from primary teeth to permanent teeth, whereas the elderly had fewer teeth because of deformation [22, 23]. Also,
the patients with comorbid conditions such as
dentofacial anomalies or disorders of tooth develop-ment and eruption made more dental visits than pa-tients without those problems [24, 25]. Such papa-tients need to activate preventive healthcare to reduce pre-ventable expenditures.
The reduction of dental care utilization by the introduction of water fluoridation showed some dif-ferences in the subgroup analyses. The results showed that such associations were greater among patients that had not experienced dental care. It was suggested that the water fluoridation program had a major role in the reduction of the incidence of dental caries as a primary prevention rather than a secondary preven-tion. The implementation of such programs would be effective for individuals who managed their dental
care well without clinical symptoms. Therefore,
healthcare professionals need to recommend the im-portance of managing oral health even for individuals without any symptoms [26].
Our study has some strengths compared with previous studies. First, we used national health insurance national sampling cohort data to analyze the relationship between the implementation of water fluoridation programs and dental visits or expenditures. Therefore, the data used in
our study are especially helpful for establishing
evidence-based health policy for dental care. Second, to our best knowledge, this study is the first attempt to in-vestigate the impact of water fluoridation programs on the whole nation of South Korea. So far, several previous studies of water fluoridation have been conducted, but most of those only investigated the impact of the pro-grams at the community level [27–29]. Therefore, our findings would be effective evidence for establishing public health programs or policies. Third, we included the dental visits and expenditures as outcome variables. Therefore, our results could reflect overall dental care utilization by each patient. Finally, we adjusted the data for pre-dental care and other comorbid conditions to provide a more detailed study. Thus, we could reflect the severity of the dental caries experienced by the pa-tients in our analyses.
Our study had also some limitations. Based on previous studies of dental caries or oral health, various factors
including lifestyles, types of tooth paste, and frequencies of tooth brushing could affect the health outcome [1, 30]. The impact of water fluoridation program could be differ-ent by cultural factors which affect to heathy behaviors in each countries. Also, the outcome variables in previous studies were used with other clinical indicators including the Patient Hygiene Performance index [31]. However, the relevant details were not included in the data, as the data used in our study had the characteristics of health insur-ance claim data. Therefore, we were unable to consider other variables that could affect dental caries. Next, we could not consider the fluoride level in the water or the actual consumption volume for each individual because of limitations of the data [32, 33]. In addition, we excluded the regions that quit the program during the study period, because we could not clearly identify the period effect after the introduction of water fluoridation. Therefore, more detailed studies are needed. Third, in the character-istics of dental care, there were many non-payment items related to dental care in South Korea. However, because of the characteristics of the NHI claim data, we could not consider those items. Thus, it is possible that the measurement of the dental care expenditures could have been underestimated. Finally, regarding some studies of water fluoridation programs that suggested that the programs had an adverse effect, there was a need to evaluate adverse effects. However, we only analyzed the dental care utilization and did not in-clude any adverse effects.
Despite those limitations, our findings suggest that the implementation of water fluoridation programs had a positive role in improving oral health, and es-pecially dental caries. Regarding the negative public perception of water fluoridation programs and the high out-of-pocket expenditures for dental care in South Korea, those findings could be helpful in the management of dental care expenditures from the perspective of health policy and public health. Al-though further detailed studies using clinical factors will be needed in the near future, makers of health policy and professionals in the area of dental care must consider efficient strategies for activating water fluoridation programs.
Conclusions
The implementation of water fluoridation programs is inversely associated with the risk of dental visits and ex-penditures related to dental caries. Considering that as-sociation, makers of health policy and decision makers such as Korea Health Promotion Foundation have to consider preventive strategies for activating water fluor-idation programs, such as changes in public perception and relations, in order to effectively manage dental care in South Korea.
Appendix 1
Table 5 Characteristics of study population at baseline
Variables N/Mean %/SD
Regional variables Water fluoridation
Yes (n = 13) 49,122 10.40
No (n = 151) 423,128 89.60
Period from implementation of water fluoridation 0.68 2.51
Number of dentists per 1,000 residents 0.28 0.12
Financial independence rate of local government 50.63 24.45 Individual variables Sex Male 239,445 50.70 Female 232,805 49.30 Age (Years) -19 142,793 30.24 20–29 66,863 14.16 30–39 80,042 16.95 40–49 72,654 15.38 50–59 42,027 8.90 60–69 38,745 8.20 > 70 29,126 6.17 Income (percentile) -10 % (low) 49,834 10.55 11–20 % 30,220 6.40 21–30 % 34,226 7.25 31–40 % 40,371 8.55 41–50 % 45,727 9.68 51–60 % 48,872 10.35 61–70 % 54,782 11.60 71–80 % 58,121 12.31 81–90 % 58,827 12.46 + 91 % (high) 51,270 10.86
Types of insurance coverage
Medical Aid 18,607 3.94
NHI, self-employed insured 213,931 45.30
NHI, employee insured 239,712 50.76
Year of baseline 2003 412,110 87.27 2004 11,234 2.38 2005 6,440 1.36 2006 6,703 1.42 2007 5,847 1.24 2008 5,576 1.18 2009 5,156 1.09 2010 4,838 1.02
Table 5 Characteristics of study population at baseline (Continued) 2011 4,567 0.97 2012 4,918 1.04 2013 4,861 1.03 Dentofacial anomalies Yes 83 0.02 No 472,167 99.98
Disorders of toothe development and eruption
Yes 881 0.19
No 471,369 99.81
Follow up time (year) 9.12 2.80
Total 472,250 100.00
Appendix 2
Abbreviations
CI:Confidence interval; GEE: Generalized estimating equation; HR: Hazard ratio; ICD: International classification of diseases; KNHIS: Korean National Health Insurance Service; NHI: National Health Insurance; OECD: Organization for Economic Co-operation and Development; SE: Standard error;
WHO: World Health Organization
Acknowledgement
No specific funding supported this study.
Availability of data and materials
The data used in this study were obtained from the NHIS National Sample Cohort, it can only be disclosed to the people who had authorized by NHIS. For obtaining the NHIS National Sampling Cohort, go to the following web site, and submit the application form (https://nhiss.nhis.or.kr/bd/ab/ bdaba021eng.do). The committee will evaluate that, and notice the determination of deliberation within 25 days from the data of application. And then, applicants who passed deliberation can use this data after payment of fee.
Authors’ contributions
MSC and KTH designed the study, performed the research and statistical analyses, and wrote the manuscript. SHP, KTM, and ECP contributed to the discussion and reviewed and edited the manuscript. ECP is the guarantor of this work and as such has full access to all the data in the study and takes responsibility for the integrity of the data and the accuracy of the data analysis. The English in this document has been checked by at least two professional editors, both native English speakers. All authors read and approved the final manuscript.
Competing interests
The authors declare that they have no competing interests.
Consent for publication Not applicable.
Ethics approval and consent to participate
The data used in this study included the information about dental care utilization of patients, and it was not included informed consents of each patient. This is because that the data was anonymized and not identified prior to analysis. This study was approved by the Institutional Review Board, Yonsei University Graduate School of Public Health (2014–239).
Author details
1
Department of Health Policy and Management, Graduate School of Public Health, Yonsei University, Seoul, Republic of Korea.2Division of Management
& Planning, Korea Health Promotion Foundation, Seoul, Republic of Korea.
3Department of Public Health, Graduate School, Yonsei University, Seoul,
Republic of Korea.4Institute of Health Services Research, Yonsei University College of Medicine, Seoul, Republic of Korea.5Department of Biostatistics,
Graduate School of Public Health, Yonsei University, Seoul, Republic of Korea.
6National Evidence-Based Healthcare Collaborating Agency, Seoul, Republic
of Korea.7Department of Preventive Medicine, Yonsei University College of Medicine, Seoul, Republic of Korea.
Received: 10 July 2016 Accepted: 26 October 2016
References
1. Selwitz RH, Ismail AI, Pitts NB. Dental caries. Lancet. 2007;369(9555):51–9. 2. Marinho VC, Higgins J, Logan S, Sheiham A. Fluoride toothpastes for
preventing dental caries in children and adolescents. The Cochrane Libr. 2003. 3. Tinanoff N, Palmer CA. Dietary determinants of dental caries and dietary
recommendations for preschool children. J Public Health Dent. 2000;60(3): 197–206.
4. Axelsson P, Lindhe J, Nyström B. On the prevention of caries and periodontal disease. J Clin Periodontol. 1991;18(3):182–9. Fig. 1 The Kaplan-Meier Survival curve for time to first diagnosis of dental caries by the implementation water fluoridation
5. Lee HJ, Han DH: Exploring the determinants of secular decreases in dental caries among Korean children. Community Dent Oral Epidemiol. 2015;43(4):357–65. 6. Arnold Jr FA, Dean HT, Jay P, Knutson JW. Effect of fluoridated public water
supplies on dental caries prevalence: tenth year of the Grand Rapids-Muskegon study. Public Health Rep. 1956;71(7):652.
7. Petersen PE, Lennon MA. Effective use of fluorides for the prevention of dental caries in the 21st century: the WHO approach. Community Dent Oral Epidemiol. 2004;32(5):319–21.
8. McDonagh MS, Whiting PF, Wilson PM, Sutton AJ, Chestnutt I, Cooper J, Misso K, Bradley M, Treasure E, Kleijnen J. Systematic review of water fluoridation. BMJ. 2000;321(7265):855–9.
9. Lee M, Dennison PJ. Water fluoridation and dental caries in 5-and 12-year-old children from Canterbury and Wellington. N Z Dent J. 2004;100(1):10–5. 10. Armfield JM. Community effectiveness of public water fluoridation in
reducing children's dental disease. Washington, DC: Public Health Reports; 2010:655–64.
11. Kobayashi S, Kawasaki K, Takagi O, Nakamura M, Fujii N, Shinzato M, Maki Y, Takaesu Y. Caries experience in subjects18–22 years of age after 13 years’ discontinued water fluoridation in Okinawa. Community Dent Oral Epidemiol. 1992;20(2):81–3.
12. Dl P, Hs M, Horowitz AM, Gift HC, Kl J, Ss S. Knowledge of and practices related to caries prevention among Koreans. J Public Health Dent. 1994; 54(4):205–10.
13. Parnell C, Whelton H, O’Mullane D. Water fluoridation. Eur Arch Paediatr Dent. 2009;10(3):141–8.
14. Prevalence of dental caries. http://kosis.kr/statHtml/statHtml.do?orgId= 117&tblId=DT_11702_N116&conn_path=I2. Accessed 18 July 2016. 15. Organization for Economic Cooperation and Development. Health at a
Glance 2013: OECD Indicators. 2013.
16. Zorn CJ: Generalized estimating equation models for correlated data. A review with applications. Am J Pol Sci. 2001;45(2):470–90.
17. Armfield JM, Spencer AJ, Roberts-Thomson KF, Plastow K. Water fluoridation and the association of sugar-sweetened beverage consumption and dental caries in Australian children. Am J Public Health. 2013;103(3):494–500. 18. Cobiac LJ, Vos T. Cost‐effectiveness of extending the coverage of water
supply fluoridation for the prevention of dental caries in Australia. Community Dent Oral Epidemiol. 2012;40(4):369–76.
19. Hobdell M, Petersen PE, Clarkson J, Johnson N. Global goals for oral health 2020. Int Dent J. 2003;53(5):285–8.
20. Jeon JE, Chung WG, Kim NH. The reason of unmet dental need related socioeconomic status in Korea: Using the 4th Korea National Health and Nutritional Examination Survey. J Korean Acad Oral Health. 2012;36(1):73–81. 21. Swank ME, Vernon SW, Lairson DR. Patterns of preventive dental behavior.
Public Health Rep. 1986;101(2):175.
22. Fure S, Zickert I. Incidence of tooth loss and dental caries in 60‐, 70‐ and 80‐year‐old Swedish individuals. Community Dent Oral Epidemiol. 1997;25(2):137–42.
23. Harris R, Nicoll AD, Adair PM, Pine CM. Risk factors for dental caries in young children: a systematic review of the literature. Community Dent Health. 2004;21(1):71–85.
24. Solorzano I, Salas M, Chavarría P, Beltrán‐Aguilar E, Horowitz H. Prevalence and severity of dental caries in Costa Rican schoolchildren: results of the 1999 national survey. Int Dent J. 2005;55(1):24–30.
25. Barmes DE. Epidemiology of dental disease. J Clin Periodontol. 1977;4(5):80–93. 26. Wilkins EM. McCullough PA. Clinical practice of the dental hygienist.
Philadelphia: Lea & Febiger; 1983.
27. Cho HJ, Lee HS, Paik DI, Bae KH. Association of dental caries with socioeconomic status in relation to different water fluoridation levels. Community Dent Oral Epidemiol. 2014;42(6):536–42.
28. Kim M-K, Jung J-I, Kim M-J, Jun E-J, Kim H-N, Kim S-Y, Han D-H, Jeong S-H, Kim J-B. Cost-benefit analysis of a water fluoridation program for 11 years in Jinju, Korea. J Korean Acad Oral Health. 2014;38(2):118–28.
29. Cho HJ, Jin BH, Park DY, Jung SH, Lee HS, Paik DI, Bae KH. Systemic effect of water fluoridation on dental caries prevalence. Community Dent Oral Epidemiol. 2014;42(4):341–8.
30. Petersen PE. Sociobehavioural risk factors in dental caries–international perspectives. Community Dent Oral Epidemiol. 2005;33(4):274–9.
31. Ismail AI, Sohn W, Tellez M, Willem JM, Betz J, Lepkowski J. Risk indicators for dental caries using the International Caries Detection and Assessment System (ICDAS). Community Dent Oral Epidemiol. 2008;36(1):55–68.
32. Bassin EB, Wypij D, Davis RB, Mittleman MA. Age-specific fluoride exposure in drinking water and osteosarcoma (United States). Cancer Causes Control. 2006;17(4):421–8.
33. Pizzo G, Piscopo MR, Pizzo I, Giuliana G. Community water fluoridation and caries prevention: a critical review. Clin Oral Investig. 2007;11(3):189–93.
• We accept pre-submission inquiries
• Our selector tool helps you to find the most relevant journal
• We provide round the clock customer support
• Convenient online submission
• Thorough peer review
• Inclusion in PubMed and all major indexing services
• Maximum visibility for your research Submit your manuscript at
www.biomedcentral.com/submit