Like Growth Factor Binding Protein 3 Controls Cell
Survival in Alzheimer’s Disease
Hye Youn Sung1, Eun Nam Choi1, Dahyun Lyu1, Inhee Mook-Jung3, Jung-Hyuck Ahn1,2*
1 Department of Biochemistry, School of Medicine, Ewha Womans University, Seoul, Republic of Korea, 2 Tissue Injury Defense Research Center, School of Medicine, Ewha Womans University, Seoul, Republic of Korea,3 Department of Biochemistry and Biomedical Sciences, Seoul National University College of Medicine, Seoul, Republic of Korea
Abstract
Swedish double mutation (KM670/671NL) of amyloid precursor protein (APP) is reported to increase toxic amyloid b (Ab) production via aberrant cleavage at the b-secretase site and thereby cause early-onset Alzheimer’s disease (AD). However, the underlying molecular mechanisms leading to AD pathogenesis remains largely unknown. Previously, our transcriptome sequence analyses revealed global expressional modifications of over 600 genes in APP-Swedish mutant-expressing H4 (H4-sw) cells compared to wild type H4 cells. Insulin-like growth factor binding protein 3 (IGFBP3) is one gene that showed significantly decreased mRNA expression in H4-sw cells. In this study, we investigated the functional role of IGFBP3 in AD pathogenesis and elucidated the mechanisms regulating its expression. We observed decreased IGFBP3 expression in the H4-sw cell line as well as the hippocampus of AD model transgenic mice. Treatment with exogenous IGFBP3 protein inhibited Ab1–42- induced cell death and caspase-3 activity, whereas siRNA-mediated suppression of IGFBP3 expression
induced cell death and caspase-3 cleavage. In primary hippocampal neurons, administration of IGFBP3 protein blocked apoptotic cell death due to Ab1–42toxicity. These data implicate a protective role for IGFBP3 against Ab1–42-mediated
apoptosis. Next, we investigated the regulatory mechanisms of IGFBP3 expression in AD pathogenesis. We observed abnormal IGFBP3 hypermethylation within the promoter CpG island in H4-sw cells. Treatment with the DNA methyltransferase inhibitor 5-aza-29-deoxycytidine restored IGFBP3 expression at both the mRNA and protein levels. Chronic exposure to Ab1–42 induced IGFBP3 hypermethylation at CpGs, particularly at loci 2164 and 2173, and
subsequently suppressed IGFBP3 expression. Therefore, we demonstrate that expression of anti-apoptotic IGFBP3 is regulated by epigenetic DNA methylation, suggesting a mechanism that contributes to AD pathogenesis.
Citation: Sung HY, Choi EN, Lyu D, Mook-Jung I, Ahn J-H (2014) Amyloid Beta-Mediated Epigenetic Alteration of Insulin-Like Growth Factor Binding Protein 3 Controls Cell Survival in Alzheimer’s Disease. PLOS ONE 9(6): e99047. doi:10.1371/journal.pone.0099047
Editor: Jaya Padmanabhan, University of S. Florida College of Medicine, United States of America Received November 7, 2013; Accepted May 11, 2014; Published June 25, 2014
Copyright: ß 2014 Sung et al. This is an open-access article distributed under the terms of the Creative Commons Attribution License, which permits unrestricted use, distribution, and reproduction in any medium, provided the original author and source are credited.
Funding: This research was supported by Basic Science Research Program through the National Research Foundation of Korea (NRF) funded by the Ministry of Education, Science and Technology (2011-0013882) and this work was supported by the National Research Foundation of Korea (NRF) grant funded by the Korea government (MSIP) (No. 2012R1A5A2A32671867). This research was supported by Basic Science Research Program through the National Research Foundation of Korea (NRF) funded by the Ministry of Education (2012R1A1A2004214). The funders had no role in study design, data collection and analysis, decision to publish, or preparation of the manuscript.
Competing Interests: The authors have declared that no competing interests exist. * Email: [email protected]
Introduction
Alzheimer’s disease (AD) is the most common form of age-dependent dementia and is characterized by increased beta amyloid (Ab) levels, extracellular senile plaques, intracellular neurofibrillary tangles, and massive neuronal loss in the brain. Senile plaques are deposits of Ab that arise from abnormal sequential cleavage of amyloid precursor protein (APP) by b- and c-secretases[1,2]. Several genetic mutations have been reported in genes such as APP, presenilin 1 (PSEN1), and presenilin 2 (PSEN2) [1]. All of these mutations are associated with increased production of toxic Ab and its secretion [2,3] suggesting APP processing is the key causative factor in AD pathogenesis.
The Swedish mutation of APP harboring double mutations at codons 595 and 596 (APP695numbering) substituting Lys-Met to
Asn-Leu is a predominant form of familial Alzheimer’s disease. Cells expressing Swedish mutant APP have dramatic increases (up to 6- to 8-fold) in Ab1–40 and Ab1–42 production via elevated
endoproteolytic cleavage at the b-secretase site [4,5]. Our previous study also found global alterations in gene expression, including genes associated with AD pathogenesis in APP-Swedish mutant cells [6]. Insulin-like growth factor binding protein-3 (IGFBP3) was one gene whose expression was significantly down-regulated in APP-Swedish mutant cells.
IGFBP3 is one of six IGFBP family members that bind peptide growth factors, such as insulin-like growth factor (IGF) -I and –II, with high affinity and thus regulates their biological actions, including cellular proliferation, differentiation, and metabolic activity by blocking subsequent IGF-I receptor activation [7,8]. IGFBP3 has been widely studied because of its induction of apoptosis and/or suppression of cell proliferation. IGFBP3 attenuates the interaction between IGF-I and the IGF-I receptor, as well as via IGF-independent effectors such as the transforming growth factor (TGF)-bV receptor, tumor necrosis factor (TNF)-a receptor, retinoid X receptor (RXR)-a, and nuclear factor-kB
(NF-kB) cascades [9,10]. In contrast to the pro-apoptotic effects of IGFBP3, a number of studies have demonstrated that IGFBP3 stimulates cell proliferation and protects cells from apoptotic insults in a variety of cell types through IGFdependent or -independent [11–14]. Furthermore, several studies have reported that IGFBP3 may facilitate cell survival or death in the same cellular system depending on the stimulus. IGFBP3 can be regulated by both TNF-a and IGF-I via different pathways in response to specific stimuli to regulate cell fate in bovine secretory mammary epithelial cells [15]. Another study also reported dual effects of IGFBP3 on survival and apoptosis in human umbilical vein endothelial cells. IGFBP3 enhanced doxorubicin-induced apoptosis but also promoted cell survival in serum-deprived conditions by regulating ceramide levels in these cells [16]. Accumulating evidence indicates that IGFBP3 is a multi-functional protein whose functions depend on the specific condition of the cell. However, the underlying molecular mechanisms of IGFBP3 biological action remain largely unknown. IGFBP3 expression can be induced or suppressed by a variety of agents and factors, such as vitamin D, estrogen, androgen, retinoic acid, TGF-b, TNF-a, hypoxia, p53, and DNA methylation [9]. Several cancer studies have described aberrant hypermethylation in CpG islands of the IGFBP3 promoter as one of the mechanisms responsible for IGFBP3 gene silencing [17–19]. However, meth-ylation-dependent epigenetic regulation of IGFBP3 has not previously been investigated in AD.
In this study, we investigated the functional role of IGFBP3 using an AD model cell line. Furthermore, we elucidated the mechanism that regulates IGFBP3 expression and contributes to AD pathogenesis.
Materials and Methods Cell culture
Human glioblastoma H4 cells and APP695-Swedish mutant (K595N/M596L)-expressing H4 cells (H4-sw) were kindly pro-vided by Sangmee Ahn Jo’s lab (Dankook University, Chungnam, Korea)and have been reported previously [20,21]. H4 and H4-sw cells were cultured as previously described in Dulbecco’s modified Eagle media (DMEM; Gibco/BRL) containing 10% fetal bovine serum (FBS; Gibco/BRL), 100 U/mL penicillin (Gibco/BRL), 100mg/mL streptomycin (Gibco/BRL), and 2 mM L-glutamine (Gibco/BRL) [6]. To maintain H4-sw cells, 500mg/mL geneticin (Gibco/BRL) was added to the growth media.
Rat hippocampal neuronal culture
Hippocampal neuronal cultures were prepared from 3- to 6-day-old Sprague-Dawley rats. All procedures used in this study for handling and sacrificing the animals were in strict compliance with the guidelines of Korean animal protection law and approved by the Institutional Animal Care and Use Committee of Ewha Womans University School of Medicine (Permit Number: 13-0220). Briefly, hippocampi were dissected from 3- to 6-day-old rats into DMEM (Biowest), trypsinized for 1 hour at 37uC with 0.25% Trypsin/0.53 mM EDTA (Gibco/BRL), triturated with fire-polished Pasteur pipettes, and plated in 6-well plates coated with poly-L-lysine (Sigma-Aldrich) at a density of 46105cells/well in Neurobasal media (Gibco/BRL) with 10% FBS. After 16 h, the media were changed to Neurobasal media supplemented with serum-free supplements containing 0.5 mM L-glutamine, 2% B-27, 1% N-2, and 1% penicillin/streptomycin (Invitrogen) for further culturing. Half of the media were changed every 2 days by aspirating and replacing it with fresh culture media for 14 days, at which time Ab1–42treatment was initiated.
Mice
The APP swe/PS1 transgenic (Tg) mice
(B6C3-Tg(APP695)85Dbo Tg(PSEN1)85Dbo) were originally purchased from The Jackson Laboratory and subsequently bred in the animal care facility at the College of Medicine, Ewha Womans University. These mice doubly express human APP carrying Swedish familial AD-linked mutations (K670N/M671L) and human Presenilin1 encoding a mutant exon 9-deleted variant (PSEN1/dE9). Twelve-month-old age-matched transgenic and wild-type (WT) littermates were used in experiments. They were sacrificed by cervical dicapitation under anaesthesia according to the Institutional Animal Care and Use Committee of Ewha Womans University School of Medicine approved procedures (Permit Number: 12-0206). Their brains were harvested and the frontal cortex, hippocampus, and cerebellum were isolated and freshly used for gene expression analyses.
RNA extraction, reverse-transcription polymerase chain reaction (RT-PCR), and quantitative polymerase chain reaction (qPCR)
Total RNA was extracted using the RNeasy Plus Mini Kit (Qiagen) and RNeasy Lipid Tissue Mini Kit (Qiagen) for cultured cells and brain tissues, respectively, according to the manufactur-er’s protocol. Total RNA (1mg) was converted to cDNA using Superscript II reverse transcriptase (Invitrogen) and oligo-(dT)12–18
primers (Invitrogen) according to the manufacturer’s instructions. qPCR was performed in a 20-ml reaction mixture containing 1ml cDNA, 10ml SYBR Premix EX Taq (Takara Bio), 0.4ml Rox reference dye (506, Takara Bio), and 200 nM primers for each gene. The primer sequences were as follows: human IGFBP3
(forward), 59-CTCTGCGTCAACGCTAGTGC-39; human
IGFBP3 (reverse), 59-CGGTCTTCCTCCGACTCACT-39;
mouse IGFBP3 (forward), 59-CGAGTCTAAGCGGGAGACAG-39; mouse IGFBP3 (reverse),
59-ACTTGTCCACACACCAG-CAG-39; human GAPDH (forward),
59-AATCCCATCAC-CATCTTCCA-39; human GAPDH (reverse),
59-TGGACTC-CACGACGTACTCA-39 mouse GAPDH (forward),
59-AATGTGTCCGTCGTGGATCT-39; mouse GAPDH (reverse), 59-GGTCCTCAGTGTAGCCCAAG-39. Reactions were run on an ABI PRISM 7000 sequence detection system (Applied BioSystems) at 50uC for 2 min and 95uC for 10 min, followed by 40 cycles of 95uC for 15 sec and 60uC for 1 min, and a dissociation stage of 1 cycle at 95uC for 15 sec, 60uC for 20 sec, and 95uC for 15 sec. All PCR reactions were performed in triplicate, and the specificity of the reaction was detected by melting curve analyses at the dissociation stage. Comparative quantification of each target gene was performed based on the cycle threshold (CT), which was normalized to GAPDH using the
DDCTmethod.
Western blot analyses
Proteins (40–50mg) were resolved using denaturing 10 or 15% sodium dodecyl sulfate- polyacrylamide gel electrophoresis (SDS-PAGE) and transferred to polyvinylidene fluoride (PVDF) membranes. Membranes were blocked in 5% skim milk in Tris-buffered saline with 0.1% Tween 20 (TBST) and subsequently incubated overnight at 4uC with the following primary antibodies: goat anti-IGFBP3 polyclonal antibody (1:2000, R&D Systems), rabbit anti-cleaved caspase 3 polyclonal antibody (1:1000, Cell Signaling), and mouse anti-b-actin monoclonal antibody (1:2000, Santa Cruz). After washing, the membranes were incubated with secondary antibodies conjugated to horseradish peroxidase for 1 h at room temperature. Chemiluminescence was detected using
Super Signal West Dura substrate (Thermo Scientific) according to the manufacturer’s protocol. Bands were visualized using a Luminescent Image analyser LAS-300 (General Electric) and quantified using Image Gauge software (Science Lab)
Small interfering RNA (siRNA) transfection
Pre-designed siRNA for IGFBP3 (siBP3, CAT#ID L-004777-00-0005) and a non-targeting control (siNC, CAT#ID D-001206-13-05) were purchased from Thermo Scientific. To deplete IGFBP3 expression, H4 cells were either transfected with 100 nM siBP3 or siNC using the DharmaFECT 4 transfection reagent (Thermo Scientific) according to the manufacturer’s protocol. Knockdown of IGFBP3 expression was confirmed using qPCR 24 h transfection and western blot analyses 48 h post-transfection.
Flow cytometric apoptosis analyses
Apoptosis-induced cells or untreated cells were trypsinized with 0.25% trypsin/0.53 mM EDTA and harvested by centrifugation (200 6 g, 5 min, 4uC). After two washes in phosphate-buffered saline (PBS) containing 0.1% glucose, cells were resuspended in propidium iodide (PI) staining buffer (0.1% sodium citrate, 0.1% Triton X-100, 10mg/ml PI, and 10mg/ml RNase A) and incubated for 15 min in the dark. Cell-cycle profiles were determined counting 20,000 cells using a FACSCalibur (Becton Dickinson). The percentage of apoptotic cells was analyzed using Modfit LT software (Verity Software House) as the percentage of cells in the sub-G1 phase.
Bisulfite conversion
Bisulfite modified gDNA was prepared using the EpiTech Bisulfite kit (Qiagen, catalog #59104) according to the manufac-turer’s instructions. The bisulfate reaction was performed on 2.0mg gDNA and the reaction volume was adjusted to 20ml with sterile water and 120ml of conversion reagent, containing 85ml of Bisulfite mix and 35ml of DNA protect buffer, was added. The sample tubes were placed in a thermal cycler (MJ Research) and the following steps were performed: 5 min at 95uC, 25 min at 60uC, 5 min at 95uC, 85 min at 60uC, 5 min at 95uC, 175 min at 60uC and stored at 20uC. The converted samples were mixed with 560ml of the freshly prepared Buffer BL and added into the column. The column was centrifuged at full speed for 1 min and discarded the flow-through. The column was then washed by adding 500ml of Buffer BW and incubated with 500ml of Buffer BD at room temperature (15,25uC) for 15 min. After incubation, the column was centrifuged at full speed for 1 min. The column was again washed by adding 500ml of Buffer BW and spun at full speed (this step was repeated). The converted gDNA was eluted by adding 20ml of Buffer EB into the column and spin. The bisulfite converted gDNA samples were stored at 220uC until methylation analysis.
Bisulfite sequencing analyses of DNA methylation patterns using the 454 GS-FLX system
Bisulfite PCR of the IGFBP3 promoter regions was performed in 50ml reactions containing 10 ng bisulfite-modified genomic DNA, 1.5 mM MgCl2, 200mM dNTPs, 1 U Platinum Taq polymerase
(Invitrogen), 16 Platinum Taq buffer, and 200 nM each specific BSP forward and reverse primers. The BSP primers were designed using MethPrimer software. The bisulfite IGFBP3 PCR product was 350 bp (position in the human GRCh37/hg19 assembly: ch7 45,960,812–45,961,161) and contained 38 cytosine-phosphate-guanine (CpG) sites. Sequences of the bisulfite PCR primers are:
GTTGTGGAATTTAGGTAGGAAG-39 (forward) and 59-AAAATACTAAAATAACCTAAAATACC-39 (reverse). The re-action was run at 95uC for 5 min, followed by 30 cycles at 95uC for 30 sec, 55uC for 30 sec, and 72uC for 30 sec. There was a final elongation step at 72uC for 5 min. Bisulfite PCR products were purified using QIAquick Gel Extraction kits (Qiagen) according to the manufacturer’s protocol.
A library was prepared according to the GS FLX titanium library prep guide using bisulfite PCR products. Libraries were quantified using Ribogreen assays (Invitrogen). The emPCR, corresponding to clonal amplification of the purified library, was performed using the GSFLX titanium emPCR Kit (Roche/454 Life Sciences). Briefly, libraries were immobilized onto DNA capture beads. The library-beads obtained were added to a mixture of amplification mix and oil, and vigorously shaken on a Tissue LyserII (Qiagen) to create "micro-reactors" containing both amplification mix and a single bead. The emulsion was dispensed into 96-well plates and the PCR amplification program was run according to the manufacturer’s recommendations. Following amplification, the emulsion was chemically broken and beads carrying the amplified DNA library were recovered and washed by filtration. Positive beads were purified using the biotinylated primer A (complementary to adaptor A), which binds streptavidin-coated magnetic beads. DNA library beads were then separated from magnetic beads by melting the double-stranded amplification products, leaving a population of bead-bound single-stranded template DNA fragments. The sequencing primer was then annealed to the amplified single-stranded DNA. Finally, beads carrying amplified single-stranded DNA were counted using a Particle Counter (Beckman Coulter). Sequencing was performed on a Genome Sequencer FLX titanium (Roche/454 Life Sciences), and each sample was loaded in one region of a 70 mm675 mm Pico Titer plate (Roche/454 Life Sciences) fitted with an 8-lane gasket.
For data analyses, we used Amplicon Variant Analyzer (AVA) software (Roche). The report includes auto-detected variants using the "computation load detected variants" command from the command line interface (CLI). The auto-detected variants show the frequency at which all the variants defined in the project were observed.
Pyrosequencing for DNA methylation analyses
We used bisulfite pyrosequencing for methylation analyses of the IGFBP3 target region. Each primer was designed using the PSQ assay design program (Qiagen, USA). Primer sequences were as follows: 59-AGAAGTAGGGGTGGTTTAGGAT-39 (forward), 59- AAATAACCCAACACACCTTAATTCTTATAA-39 (bioti-nylated-reverse), 59- GTTAGTGTTTAGTTTTGAGTAG-39 (sequencing primer). PCR reactions were performed in a volume of 20ml with 20 ng or less bisulfite-converted gDNA, 10ml 26 Hot/Start PCR premix (Enzynomics), 1ml forward primer (10 pmole/ml), and 1ml biotinylated-reverse primer (10 pmole/ ml). Amplifications were performed according to the general guidelines suggested by pyrosequencing: denaturating at 95uC for 10 min, followed by 50 cycles at 95uC for 30 sec, 56uC for 30 sec, 72uC for 30 sec, and a final extension of 72uC for 10 min. The PCR reaction (2ml) was confirmed by electrophoresis in a 2.5% agarose gel and visualized by ethidium bromide staining.
ssDNA template was prepared from 16–18ml of biotinylated PCR product using streptavidin Sepharose HP beads (Amersham Biosciences), following the PSQ 96 sample preparation guide using multichannel pipets. The respective sequencing primers (15 pM) were added for analyses. Sequencing was performed on a PyroMark ID system using the Pyro Gold reagent kit (Biotage)
according to the manufacturer’s instructions. The sequence to
analyze was
TYGGGGTYGAGTTYGGGGGYGTGTAGT-TYG (position in the human GRCh37/hg19 assembly: ch7 45,961,016–45,961,045). The methylation percentage was calcu-lated by the average degree of methylation at five CpG sites formulated in pyrosequencing.
Bisulfite sequencing analyses
Bisulfite PCR products of the IGFBP3 promoter regions (position in the human GRCh37/hg19 assembly: ch7 45,960,812–45,961,161) were purified using QIAquick Gel Extraction kits (Qiagen) according to the manufacturer’s protocol and ligated into the yT&A cloning vector (Yeastern Biotech). The ligation products were used to transform competent DH5a Esherichia coli cells (RBC Bioscience) using standard procedures. PCR product-positive clones were confirmed by colony PCR using bisulfite PCR primers to verify insert size. Plasmid DNA was then extracted from at least twenty insert-positive clones using QIAprep Spin Miniprep kits (Qiagen) and sequenced using M13 primers to analyze the methylation status at specific CpG sites.
5-aza-29-deoxycytidine (5-aza-dC) treatment
To demethylate methylated CpG sites, H4-sw cells were treated with 10mM 5-aza-29-deoxycytidine (Sigma-Aldrich) for 3 days. The media was replaced daily.
Amyloid-b (Ab1–42) preparation and treatment
Synthetic Ab1–42 (American Peptide) was dissolved in
hexa-fluoro-2-propanol (HFIP, Sigma-Aldrich) for 72 h in the dark and aliquoted into microcentrifuge tubes. HFIP was removed by evaporation in a vacuum concentrator (Hanil). The tubes were stored at 280uC until use. To prepare a soluble form of Ab1–42,
dried Ab1–42was dissolved in dimethylsulfoxide (DMSO,
Sigma-Aldrich) to make a 1 mM stock solution. The Ab1–42stock solution
was immediately diluted in serum-free media to make final 10 nM to 5mM working solutions. H4 cells were treated with soluble Ab1– 42at different concentrations for various time points. To prepare
the oligomeric form of Ab1–42, the soluble stock solution was first
diluted in phosphate-buffered saline (PBS) to a concentration of 10mM, mixed vigorously, and incubated at 4uC for 24 h. Ab1–42
peptides oligomerize to exhibit increased soluble oligomeric bands with higher molecular weight accompanied with decreased monomeric bands (Figure S1). The oligomeric form of Ab1–42
was further diluted in supplements-free media to a final concentration of 500 nM. Rat hippocampal neuronal cells were treated with oligomeric Ab1–42at 500 nM for 24 h.
Statistical analysis
All data are expressed as mean 6 standard deviation of at least three independent experiments. Statistical analyses were carried out using GraphPad Prism5 software and the details of the statistical analysis for each data set were included in the figure legends. P values less than 0.05 were considered statistically significant.
Results
Altered IGFBP3 expression in APP-Swedish mutant cells and APP swe/PSEN1 transgenic mice
The APP-Swedish mutant-harboring H4 (H4-sw) cells secrete 1.2–1.7 ng/mL of Ab1–40 and 147–243 pg/mL of Ab1–42 while
4.4–6.7 pg/mL of Ab1–40and 1.54–13.35 pg/mL of Ab1–42were
detected in H4 cells (Figure S2). Previously, we found that the
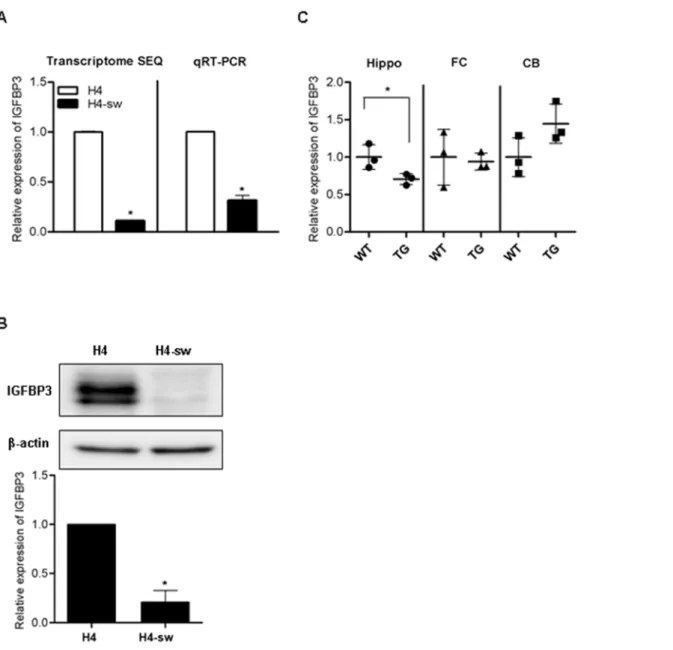
expression of over 600 genes was altered in H4-sw cells compared to wild type H4 cells using transcriptome sequencing analyses [6]. Among these genes, IGFBP3 expression was down-regulated approximately 10-fold in H4-sw cells (Figure 1A). In agreement with our transcriptome sequencing data, IGFBP3 mRNA levels (Figure 1A) as well as protein levels (Figure 1B) were approxi-mately 3.5-fold and 5-fold decreased in H4-sw cells, respectively, compared to wild type H4 cells. IGFBP3 mRNA expression levels were measured in the brains of APPswe/PSEN1 double mutant transgenic mice. Significantly decreased mRNA levels of IGFBP3 were observed in hippocampus of the transgenic mice. However, IGFBP3 mRNA levels remained unchanged in the frontal cortex and increased in cerebellum of the transgenic mice, but the increase was not statistically significant (Figure 1C).
IGFBP3 protects cells from Ab1–42-induced apoptosis
It is widely known that IGFBP3 plays a pivotal role in both cell growth and apoptosis. Recent studies have shown that IGFBP3 either inhibits or promotes apoptotic cell death depending on the cell type and inducing agent [10,16]. To investigate the role of IGFBP3 in the development of AD, we induced apoptosis in H4 and H4-sw cells using Ab1–42 in the presence or absence of
exogenous recombinant human IGFBP3. After 24 hours of Ab1–42
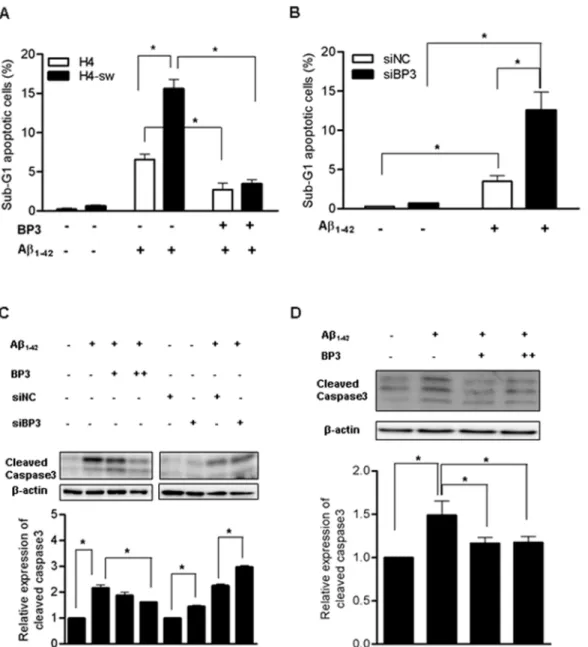
treatment in the presence or absence of IGFBP3 in serum-free media, we measured cell viability. Our FACS results showed that the viability of H4-sw cells with down-regulated IGFBP3 expression decreased approximately 2.5-fold compared to H4 cells. Additionally, treatment with exogenous IGFBP3 (2mg/ml) can inhibit Ab1–42-induced cell death in both H4 and H4-sw cells
(Figure 2A). Further experiments revealed that knocking down IGFBP3 in H4 cells using siRNA rendered the cells more susceptible to Ab1–42- induced toxicity (Figure 2B). Consistent
with our FACS results, caspase 3 cleavage in response to Ab1–42
-induced cell death was inhibited by adding IGFBP3 protein to wild type H4 cells, whereas caspase 3 activation was promoted in IGFBP3-knockdown H4 cells (Figure 2C). These findings indicate that IGFBP3 has a protective effect against Ab1–42-induced
apoptosis.
We also examined the effects of IGFBP3 on primary neuronal cells. We induced apoptosis in rat hippocampal neuronal cells by treating cells with 500 nM oligomeric Ab1–42 for 24 h under
supplements-free conditions. Addition of exogenous IGFBP3 (1 and 2mg/ml) significantly protected neurons from Ab1–42-induced
apoptosis with a concomitant decrease in caspase 3 activation (Figure 2D). Endogenous Igfbp3 mRNA and protein expressions have not been altered by oligomeric Ab1–42 treatment for 24h
(Figure S3).
IGFBP3 expression is regulated by DNA methylation A number of studies have reported that epigenetic modifications such as DNA methylation and histone acetylation play important roles in IGFBP3 gene silencing in several human cancers [10,22]. Therefore, we examined the IGFBP3 methylation status of CpG sites within its promoter region in H4 and H4-sw cells to investigate whether epigenetic modifications are major mecha-nisms that control IGFBP3 expression.
The IGFBP3 promoter region (+60 to 2290) was PCR amplified using bisulfide-modified genomic DNA as a template to obtain 350 bp bisulfite PCR products in H4 and H4-sw cells (Figure 3A). DNA methylation patterns of PCR amplicons were analyzed using the 454 GS-FLX system. Our results show that promoter CpGs (25 out of 32) within the CpG island were hypermethylated in H4-sw cells compared to H4 cells (Figure 3A). Further analyses of DNA methylation patterns using bisulfite pyrosequences also
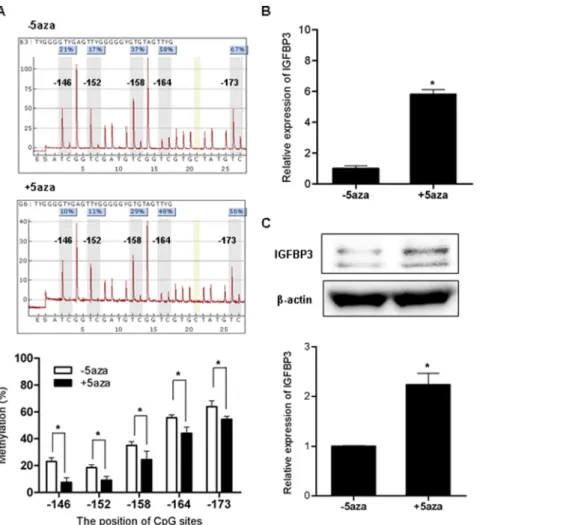
revealed higher DNA methylation at the five CpG sites tested (located in 2146, 2152, 2158, 2164, and 2173 from the transcriptional start site) in H4-sw cells than in wild type H4 cells (Figure 3B). To determine whether transcriptional silencing of IGFBP3 is regulated by DNA methylation of the promoter CpG island, we treated H4-sw cells with the DNA methyltransferase inhibitor 5-aza-29-deoxycytidine. After treatment with 10mM 5-aza-29-deoxycytidine, decreased methylation activity of the H4-sw promoter was confirmed using pyrosequencing analyses (Figure 4A) and concomitantly, expression of IGFBP3 mRNA and protein were dramatically upregulated in H4-sw cells (Figure 4B and 4C).
Epigenetic modifications caused by Ab1–42alters IGFBP3 expression
After treatment with various concentrations of Ab1–42 (0, 10,
100, and 1000 nM) for 5 days, the DNA methylation status was determined using bisulfite sequencing analyses. DNA methylation of the IGFBP3 promoter CpG sites, located 2164 and 2173 from the transcriptional start site, was increased at the 100 nM concentration of Ab1–42 compared to untreated controls in H4
cells. The maximum increase was detected at 1000 nM Ab1–42
(Figure 5A). IGFBP3 mRNA and protein expression were significantly decreased when H4 cells were treated with greater than 100 nM Ab1–42(Figure 5B and 5C). These results indicate
that Ab1–42 treatment can induce aberrant hypermethylation in
the IGFBP3 promoter region and subsequently, suppress IGFBP3 expression.
Figure 1. IGFBP3 expression is down-regulated in an APP-mutant cell line and transgenic miceIGFBP3mRNA expression in normal and APP-Swedish mutant H4 cells (A), and the brain of wild type and PSEN1-APP transgenic mice (B6C3-Tg(APP695)85Dbo Tg(PSEN1)85Dbo) (C) was measured by transcriptome sequencing analyses and qPCR. Expression of IGFBP3 protein in normal and APP-Swedish mutant H4 cells was detected using western blot analyses (B). IGFBP3 protein in APP-APP-Swedish mutant H4 cells is expressed relative to IGFBP3 protein levels in normal H4 cells. Data are represented as the mean 6 standard deviation (SD) of triplicate experiments. Statistical analyses were performed using t-tests (* indicates p,0.05). H4-sw, APP-Swedish mutant H4 cells; Hippo, hippocampus; FC, frontal cortex; CB, cerebellum. doi:10.1371/journal.pone.0099047.g001
Discussion
H4-sw cells were used in this study and are an AD model cell line that exhibits high levels of secreted toxic forms of Ab, such as Ab1–40and Ab1–42. Moreover, changes in the expression of genes
associated with AD pathogenesis, including presenilin 2, AQP1, glycogen synthase kinase 3, and cyclin-dependent kinase 5, occur in these cells [6]. Previously, our transcriptome sequence analyses revealed that in addition to these AD-associated genes, expression of over 600 genes was altered in H4-sw cells compared to H4 cells
[6]. IGFBP3 was one of the genes whose expression was significantly altered in H4-sw cells. As shown in Figure 1, IGFBP3 mRNA and protein expression were dramatically reduced in H4-sw cells (Figure 1A, 1B). Similarly, decreased IGFBP3 expression was also detected in the brain, particularly the hippocampus, of APP swe/PSEN1 transgenic mice (Figure 1C). Numerous amyloid deposits in the hippocampus and the cortex have been previously described in these mice at 12 months of age [23]. Interestingly, a large scale clinical study has demonstrated a significant association between low IGFBP3 serum levels and cognitive impairment,
Figure 2. IGFBP3 protects cells from Ab1–42induced apoptosis H4 and H4-sw cells were treated for 24 h in serum-free media (SF)
with 5 mM soluble Ab1–42in the presence or absence of exogenous recombinant human IGFBP3 (BP3) protein. IGFBP3 knockdown H4
cells generated by siRNA transfection or non-targeted siRNA-transfected H4 cells were treated with or without 5 mM soluble Ab1–42in SF media for 24
h. Apoptosis was evaluated after propidium iodide staining using FACS analyses. Compiled FACS results from three independent experiments are graphically illustrated in (A) and (B). Caspase 3 activation was examined in H4 cells by detecting cleaved forms of caspase 3 using western blot analyses. Representative results are illustrated and graphical values from densitometric analyses after normalization to b-actin are reported as relative values to that of untreated control (C). Rat hippocampal neuronal primary cells in supplements-free media were treated for 24 h with 500 nM oligomeric Ab1–42in the presence or absence of exogenous recombinant human IGFBP3 (BP3) protein. Caspase 3 activation was determined by
detecting cleaved forms of caspase 3 using western blot analyses (D). Data are the mean 6 SD of three independent experiments. Statistical analyses were performed using two-way analysis of variance (ANOVA) and Bonferroni post-tests. * indicates p,0.05. H4-sw, APP-Swedish mutant H4 cells; BP3, IGFBP3; siNC, non-targeting siRNA; siBP3, IGFBP3 siRNA.
independent of low IGF-I serum levels, in elderly male AD patients compared to patients with mild cognitive impairment (MCI) and normal controls [24]. In contrast to our results, Rensink et al. reported increased IGFBP3 expression in Dutch mutant Ab1–40-treated human brain pericytes as well as in a subset
of AD brain regions, particularly in senile plaques and cerebral amyloid angiopathy of the cortex but not of the hippocampus [25]. This discrepancy may be explained by the multi-functional properties of IGFBP3 that result in different biological actions depending on the cell type, experimental conditions, and inducing agents [9].
IGFBP3 was originally identified as a protein that binds with IGFs to inhibit their growth-stimulating and survival actions by sequestering them from the IGF receptor [9,10]. Despite the well-established growth inhibitory and pro-apoptotic activities of IGFBP3, accumulating evidence indicates that IGFBP3 is also involved in cell growth and survival in many cell types via IGF-dependent or -inIGF-dependent mechanisms [11–14]. Furthermore,
several studies have demonstrated the pleiotropic role of IGFBP3 in promoting and/or preventing cell survival to response to different insults in the same cellular system [15,16]. The neuroprotective effects of IGF-1 have been reported in relation to AD. IGF-1 protects neuronal cells against Ab-induced toxicity in an in vitro system [26] and decreases cognitive impairment and Ab deposition in AD transgenic mice [27]. These protective roles of IGF-1 may be interrupted by forming complex with IGFBP3, leading to decreased IGF-1 bioavailability and transport into central nervous system [25,28]. Because serum IGF-1 can transport into the brain via the blood-brain barrier, alteration in the serum levels of IGF-1 and/or IGFBPs may change IGF-1 input to the brain. Some clinical studies have shown lowered circulating IGF-1 levels in AD patients carrying the Swedish mutation [29] and late-onset AD group [30]. However, there are also discrepant results that observed higher total circulating IGF-1 levels and higher molar ratios of IGF-1/IGFBP3 (an indicator of bioavailable IGF-1) in the AD group compared to the
age-Figure 3. Hypermethylation of CpG islands within theIGFBP3promoter in APP-Swedish mutant cells Schematic diagram of the genomic region (+60 to 2290) of IGFBP3 that was analyzed for methylation status. The CpG island is represented as a box (2240 to +10). Thin horizontal lines indicate each CpG site. The bent arrow indicates the transcription start site (+1) and the thick vertical solid line indicates the target CpG sites for pyrosequencing analyses (A). Methylation status analyses were conducted using bisulfite sequencing analyses, the 454 GS-FLX system, and bisulfite pyrosequencing. Individual bars represent the percentage of methylation at the corresponding CpG site within the IGFBP3 promoter (A). Representative pyrograms are shown for each sample with the percentage methylation at each of the five CpG sites tested (B). Average percent methylation of triplicate pyrosequencing analyses at each of the five CpG sites are presented graphically (B). Data are shown as the mean 6 SD of triplicate experiments. Statistical analyses were performed using t-tests (* indicates p,0.05). H4-sw, APP-Swedish mutant H4 cells. doi:10.1371/journal.pone.0099047.g003
matched healthy group [31,32]. Recently, Duron et al. reported that low IGF-1 and IGFBP3 serum levels were significantly associated with cognitive status in men but not in women. There were no differences observed in bioactive IGF-1 levels between AD and MCI patients and controls in a large-size population [24]. The complicated consequences related to the IGF-1/IGFBP3 system and AD progression still remains to be elucidated.
Importantly, IGFBP3 can also be involved in neuronal survival and protection via IGF-1-independent mechanisms. IGFBP3 has been identified as a binding partner of humanin, a known survival peptide that protects neuronal cells against Ab cytotoxicity and cell death. Humanin-IGFBP3 binding markedly potentiated the survival ability of humanin from Ab1–43 toxicity in primary
murine cortical neurons through an IGF-1-independent pathway [33]. In the present study, our results also indicate a protective role for Igfbp3 in primary rat hippocampal neurons (Figure 2D). Apoptosis induced by the oligomeric form of Ab1–42 was
significantly attenuated when cells were supplemented with recombinant IGFBP3. In contrast to a previous study showing a pleiotrophic nature depending on cell type [33], our results indicate an anti-apoptotic role for IGFBP3 in AD progression in primary rat neurons as well as neuroglioma cells. APP-Swedish
mutant neuroglioma cells, which have IGFBP3 expression down-regulated compared to wild type H4 cells, were sensitive to Ab1–42
-induced cytotoxicity more than wild type H4 cells. The addition of exogenous human recombinant IGFBP3 significantly attenuated cell death and caspase 3 activity. Knockdown of endogenous IGFBP3 using RNA interference promoted cell death and enhanced caspase 3 activity in H4 cells, indicating a protective effect of IGFBP3 in Ab1–42-induced apoptosis (Figure 2).
Transcriptional regulation of IGFBP3 is mediated by alterations in the activity of transcription factors, such as p53, or by epigenetic modifications, such as DNA methylation and histone modification [10]. Silencing of IGFBP3 expression through hypermethylation of CpG islands within the promoter region has been described in several cancers, including gastric, breast, colorectal [19] ovarian [34], and hepatocellular carcinomas [35]. However, epigenetic regulation of IGFBP3 has not been reported in AD. Recent evidence supports an association between aberrant DNA methyl-ation and AD development. Increased levels of S-adenosylhomo-cysteine, a methyltransferase inhibitor, have been detected in AD brains compared to age-matched controls, and are closely related to the cognitive impairment of patients [36]. Hypomethylation-dependent overexpression of several genes involved in the
Figure 4.IGFBP3expression changes following demethylation in APP-Swedish mutant cells H4-sw cells were treated for 3 days with 10 mM 5-aza-29-deoxycytidine. DNA methylation status at specific CpG sites were analyzed using bisulfite pyrosequence analyses. The average percent methylation of triplicate pyrosequencing analyses from each of the five CpG sites are presented graphically (A). After treatment with 5-aza-dC, IGFBP3 mRNA expression was measured using qPCR (B). IGFBP3 protein expression was detected using western blot analyses. Representative results are illustrated and values from densitometric analyses after normalization to b-actin are reported relative to that of untreated controls (C). Data are shown as the mean 6 SD (n = 3). Statistical analyses were performed using t-tests (* indicates p,0.05). 5aza, 5-aza-29-deoxycytidine. doi:10.1371/journal.pone.0099047.g004
biogenesis and accumulation of amyloid plaques, such as APP, PSEN1, and b-secretase (BACE), has also been reported in AD brains [37,38]. Therefore, we investigated whether epigenetic regulation of IGFBP3 would be one mechanism causing aberrant expression during AD progression. Our results clearly show hypermethylation of CpG islands within the IGFBP3 promoter region (+60 to 2290) in H4-sw cells compared to wild type H4 cells (Figure 3). Treatment with the DNA methyltransferase inhibitor 5-aza-29-deoxycytidine restored suppressed IGFBP3 expression, strongly supporting DNA methylation-dependent transcriptional regulation of IGFBP3 (Figure 4).
In cancer studies, it has been shown that IGFBP3 functions as a tumor suppressor, and hypermethylation-mediated IGFBP3 gene silencing promotes cancer progression. IGFBP3 hypermethylation is significantly associated with poor prognosis in stage I non-small-cell lung cancer [39]. Patients with low IGFBP3 expression and high IGFBP3 promoter methylation have strong correlations with low survival rates in ovarian endometrioid carcinoma, an ovarian cancer subtype [40]. This study also revealed an association between p53 and IGFBP3 promoter methylation by identifying four critical hypermethylated p53 binding sequences in the
Figure 5. CpG island methylation is altered in theIGFBP3promoter region in H4 cells treated with Ab1–42H4 cells were treated for 5
days with different concentrations of Ab1–42. DNA methylation at the -164 and -173 CpG sites was analyzed using bisulfite sequencing analyses
(A). Each circle represents CpG dinucleotides. The methylation status of each CpG site is illustrated by black (methylated) and white (unmethylated) circles. The total percentage of methylation at specific CpG sites is indicated as a pie graph. The black segment of the pie graph indicates methylated CpG percentage whereas the white segment represents the unmethylated CpG percentage (A). IGFBP3 expression after treatment with Ab1–42was
determined using qPCR (B) and western blot analyses (C). Graphs depict compiled data from three independent experiments and values are relative to those of untreated controls. Data are shown as the mean 6 SD (n = 3). Statistical analyses were performed using one-way ANOVA and Bonferroni post-tests (* indicates p,0.05).
promoter (2210, 2206, 2183, and 2179) that are essential for p53-dependent IGFBP3 transcriptional activity [40].
A previous study demonstrated that Ab can induce aberrant epigenetic alterations, such as global hypomethylation and hypermethylation of certain genes. For example, neprilysin (NEP), an enzyme responsible for clearance of Ab accumulation, is aberrantly altered in cerebral endothelial cell cultures [41]. It has been suggested that Ab-induced aberrant epigenetic modifi-cations may contribute to further Ab accumulation and cell damage via overexpression of AD-associated genes such as APP, PSEN1, PSEN2, and BACE, as well as suppressed expression of Ab degrading enzyme genes, thereby resulting in a vicious cycle [41]. Our results have also proven abnormal epigenetic alterations mediated by toxic Ab. As shown in Figure 5, promoter CpG methylation was significantly increased, particularly at the CpGs located 2164 and 2173 from the transcriptional start site in H4 cells treated long term with low Ab1–42concentrations. However,
treatment with high concentrations (greater than 1mM) for 1 or 2 days did not affect IGFBP3 promoter DNA methylation (data not shown). The altered DNA methylation status at the two CpG sites upon Ab1–42treatment correlated with suppressed IGFBP3 mRNA
and protein expression (Figure 5). This result suggests that even low concentrations of Ab may induce abnormal epigenetic regulation of specific genes, such as IGFBP3, due to its chronic effects. We can also speculate that cells with suppressed IGFBP3 expression due to Ab-induced epigenetic modifications could be vulnerable to Ab toxicity, and chronic exposure to Ab protein could lead to damage or death in AD-related brain regions.
In this study, we demonstrate for the first time in AD an anti-apoptotic role of IGFBP3 that protects brain cells from toxic Ab1– 42as well as IGFBP3 modification by DNA methylation-dependent
regulation. These findings suggest that Ab-induced epigenetic alteration of IGFBP3 is a plausible mechanism contributing to the pathogenesis of AD.
Supporting Information
Figure S1 Native PAGE analysis of the aggregation states of Ab1–42 peptides freshly dissolved (A) or
incubated at 46C for 24 h (B). (TIF)
Figure S2 The expression of beta-amyloid (Ab) in H4 and H4-sw cells. The secreted Ab1–40and Ab1–42peptides were
determined by ELISA. Data are the means 6 standard deviation of triplicate experiments.
(TIF)
Figure S3 Endogenous Igfbp3 expression has not been altered by treatment of oligomeric Ab1–42 for 24h. Rat
hippocampal neuronal primary cells in supplements-free media were treated for 24 h with or without 500 nM oligomeric Ab1–42.
After treatment with or without Ab1–42, Igfbp3 mRNA expression
was measured using qPCR (A). Igfbp3 protein expression was detected using western blot analyses. Representative results are illustrated and values from densitometric analyses after normali-zation to b-actin are reported relative to that of untreated controls (B). Data are shown as the mean 6 SD (n = 3).
(TIF)
Supporting Information S1 Supplementary Materials and Methods.
(DOCX)
References S1 (DOCX)
Author Contributions
Conceived and designed the experiments: JHA. Performed the experi-ments: HYS ENC DL. Analyzed the data: JHA HYS. Contributed reagents/materials/analysis tools: JA HYS IMJ. Wrote the paper: JHA HYS.
References
1. Scheuner D, Eckman C, Jensen M, Song X, Citron M, et al. (1996) Secreted amyloid beta-protein similar to that in the senile plaques of Alzheimer’s disease is increased in vivo by the presenilin 1 and 2 and APP mutations linked to familial Alzheimer’s disease. Nat Med 2: 864–870.
2. Kimberly WT, Zheng JB, Guenette SY, Selkoe DJ (2001) The intracellular domain of the beta-amyloid precursor protein is stabilized by Fe65 and translocates to the nucleus in a notch-like manner. J Biol Chem 276: 40288– 40292.
3. Cao X, Sudhof TC (2001) A transcriptionally [correction of transcriptively] active complex of APP with Fe65 and histone acetyltransferase Tip60. Science 293: 115–120.
4. Cai XD, Golde TE, Younkin SG (1993) Release of excess amyloid beta protein from a mutant amyloid beta protein precursor. Science 259: 514–516. 5. Citron M, Oltersdorf T, Haass C, McConlogue L, Hung AY, et al. (1992)
Mutation of the beta-amyloid precursor protein in familial Alzheimer’s disease increases beta-protein production. Nature 360: 672–674.
6. Shin J, Yu SB, Yu UY, Jo SA, Ahn JH (2010) Swedish mutation within amyloid precursor protein modulates global gene expression towards the pathogenesis of Alzheimer’s disease. BMB Rep 43: 704–709.
7. Baxter RC, Dai J (1994) Purification and characterization of the acid-labile subunit of rat serum insulin-like growth factor binding protein complex. Endocrinology 134: 848–852.
8. Firth SM, McDougall F, McLachlan AJ, Baxter RC (2002) Impaired blockade of insulin-like growth factor I (IGF-I)-induced hypoglycemia by IGF binding protein-3 analog with reduced ternary complex-forming ability. Endocrinology 143: 1669–1676.
9. Yamada PM, Lee KW (2009) Perspectives in mammalian IGFBP-3 biology: local vs. systemic action. Am J Physiol Cell Physiol 296: C954–976. 10. Jogie-Brahim S, Feldman D, Oh Y (2009) Unraveling insulin-like growth factor
binding protein-3 actions in human disease. Endocr Rev 30: 417–437. 11. Martin JL, Weenink SM, Baxter RC (2003) Insulin-like growth factor-binding
protein-3 potentiates epidermal growth factor action in MCF-10A mammary epithelial cells. Involvement of p44/42 and p38 mitogen-activated protein kinases. J Biol Chem 278: 2969–2976.
12. Martin JL, Lin MZ, McGowan EM, Baxter RC (2009) Potentiation of growth factor signaling by insulin-like growth factor-binding protein-3 in breast epithelial cells requires sphingosine kinase activity. J Biol Chem 284: 25542– 25552.
13. Granata R, Trovato L, Lupia E, Sala G, Settanni F, et al. (2007) Insulin-like growth factor binding protein-3 induces angiogenesis through IGF-I- and SphK1-dependent mechanisms. J Thromb Haemost 5: 835–845.
14. Butt AJ, Martin JL, Dickson KA, McDougall F, Firth SM, et al. (2004) Insulin-like growth factor binding protein-3 expression is associated with growth stimulation of T47D human breast cancer cells: the role of altered epidermal growth factor signaling. J Clin Endocrinol Metab 89: 1950–1956.
15. Leibowitz BJ, Cohick WS (2009) Endogenous IGFBP-3 is required for both growth factor-stimulated cell proliferation and cytokine-induced apoptosis in mammary epithelial cells. J Cell Physiol 220: 182–188.
16. Granata R, Trovato L, Garbarino G, Taliano M, Ponti R, et al. (2004) Dual effects of IGFBP-3 on endothelial cell apoptosis and survival: involvement of the sphingolipid signaling pathways. FASEB J 18: 1456–1458.
17. Yamashita S, Tsujino Y, Moriguchi K, Tatematsu M, Ushijima T (2006) Chemical genomic screening for methylation-silenced genes in gastric cancer cell lines using 5-aza-2’-deoxycytidine treatment and oligonucleotide microarray. Cancer Sci 97: 64–71.
18. Dar AA, Majid S, Nosrati M, de Semir D, Federman S, et al. (2010) Functional modulation of IGF-binding protein-3 expression in melanoma. J Invest Dermatol 130: 2071–2079.
19. Tomii K, Tsukuda K, Toyooka S, Dote H, Hanafusa T, et al. (2007) Aberrant promoter methylation of insulin-like growth factor binding protein-3 gene in human cancers. Int J Cancer 120: 566–573.
20. Chae SS, Yoo CB, Jo C, Yun SM, Jo SA, et al. (2010) Caspases-2 and-8 are involved in the presenilin1/c-secretase-dependent cleavage of amyloid precursor protein after the induction of apoptosis. Journal of neuroscience research 88: 1926–1933.
21. Yun S-M, Cho S-J, Song JC, Song SY, Jo SA, et al. (2013) SUMO1 modulates Ab generation via BACE1 accumulation. Neurobiology of aging 34: 650–662.
22. Takahashi T, Shigematsu H, Shivapurkar N, Reddy J, Zheng Y, et al. (2006) Aberrant promoter methylation of multiple genes during multistep pathogenesis of colorectal cancers. Int J Cancer 118: 924–931.
23. Borchelt DR, Wong PC, Sisodia SS, Price DL (1998) Transgenic mouse models of Alzheimer’s disease and amyotrophic lateral sclerosis. Brain Pathol 8: 735– 757.
24. Duron E, Funalot B, Brunel N, Coste J, Quinquis L, et al. (2012) Insulin-like growth factor-I and insulin-like growth factor binding protein-3 in Alzheimer’s disease. J Clin Endocrinol Metab 97: 4673–4681.
25. Rensink AA, Gellekink H, Otte-Holler I, ten Donkelaar HJ, de Waal RM, et al. (2002) Expression of the cytokine leukemia inhibitory factor and pro-apoptotic insulin-like growth factor binding protein-3 in Alzheimer’s disease. Acta Neuropathol 104: 525–533.
26. Niikura T, Hashimoto Y, Okamoto T, Abe Y, Yasukawa T, et al. (2001) Insulin-like growth factor I (IGF-I) protects cells from apoptosis by Alzheimer’s V642I mutant amyloid precursor protein through IGF-I receptor in an IGF-binding protein-sensitive manner. J Neurosci 21: 1902–1910.
27. Carro E, Trejo JL, Gerber A, Loetscher H, Torrado J, et al. (2006) Therapeutic actions of insulin-like growth factor I on APP/PS2 mice with severe brain amyloidosis. Neurobiol Aging 27: 1250–1257.
28. Nishijima T, Piriz J, Duflot S, Fernandez AM, Gaitan G, et al. (2010) Neuronal activity drives localized blood-brain-barrier transport of serum insulin-like growth factor-I into the CNS. Neuron 67: 834–846.
29. Mustafa A, Lannfelt L, Lilius L, Islam A, Winblad B, et al. (1999) Decreased plasma insulin-like growth factor-I level in familial Alzheimer’s disease patients carrying the Swedish APP 670/671 mutation. Dement Geriatr Cogn Disord 10: 446–451.
30. Watanabe T, Miyazaki A, Katagiri T, Yamamoto H, Idei T, et al. (2005) Relationship Between Serum Insulin-Like Growth Factor-1 Levels and Alzheimer’s Disease and Vascular Dementia. J Am Geriatr Soc 53: 1748–1753. 31. Tham A, Nordberg A, Grissom FE, Carlsson-Skwirut C, Viitanen M, et al. (1993) Insulin-like growth factors and insulin-like growth factor binding proteins in cerebrospinal fluid and serum of patients with dementia of the Alzheimer type. J Neural Transm Park Dis Dement Sect 5: 165–176.
32. Vardy ER, Rice PJ, Bowie PC, Holmes JD, Grant PJ, et al. (2007) Increased circulating insulin-like growth factor-1 in late-onset Alzheimer’s disease. J Alzheimers Dis 12: 285–290.
33. Ikonen M, Liu B, Hashimoto Y, Ma L, Lee K-W, et al. (2003) Interaction between the Alzheimer’s survival peptide humanin and insulin-like growth factor-binding protein 3 regulates cell survival and apoptosis. Proceedings of the National Academy of Sciences 100: 13042–13047.
34. Wiley A, Katsaros D, Fracchioli S, Yu H (2006) Methylation of the insulin-like growth factor binding protein-3 gene and prognosis of epithelial ovarian cancer. Int J Gynecol Cancer 16: 210–218.
35. Hanafusa T, Yumoto Y, Nouso K, Nakatsukasa H, Onishi T, et al. (2002) Reduced expression of insulin-like growth factor binding protein-3 and its promoter hypermethylation in human hepatocellular carcinoma. Cancer Lett 176: 149–158.
36. Kennedy BP, Bottiglieri T, Arning E, Ziegler MG, Hansen LA, et al. (2004) Elevated S-adenosylhomocysteine in Alzheimer brain: influence on methyl-transferases and cognitive function. J Neural Transm 111: 547–567. 37. West RL, Lee JM, Maroun LE (1995) Hypomethylation of the amyloid
precursor protein gene in the brain of an Alzheimer’s disease patient. J Mol Neurosci 6: 141–146.
38. Fuso A, Seminara L, Cavallaro RA, D’Anselmi F, Scarpa S (2005) S-adenosylmethionine/homocysteine cycle alterations modify DNA methylation status with consequent deregulation of PS1 and BACE and beta-amyloid production. Mol Cell Neurosci 28: 195–204.
39. Chang YS, Wang L, Liu D, Mao L, Hong WK, et al. (2002) Correlation between insulin-like growth factor-binding protein-3 promoter methylation and prognosis of patients with stage I non-small cell lung cancer. Clinical cancer research 8: 3669–3675.
40. Torng P-L, Lin C-W, Chan M, Yang H-W, Huang S-C, et al. (2009) Promoter methylation of IGFBP-3 and p53 expression in ovarian endometrioid carcinoma. Mol Cancer 8: 120–127.
41. Chen KL, Wang SS, Yang YY, Yuan RY, Chen RM, et al. (2009) The epigenetic effects of amyloid-beta(1–40) on global DNA and neprilysin genes in murine cerebral endothelial cells. Biochem Biophys Res Commun 378: 57–61.