http://dx.doi.org/10.5012/bkcs.2014.35.12.3475
Systematic Analysis for the Effects of Atmospheric Pollutants in Cathode Feed
on the Performance of Proton Exchange Membrane Fuel Cells
Young-Gon Yoon,†,‡,a Insoo Choi,†,a Chang-Ha Lee,‡ Jonghee Han,†,§ Hyoung-Juhn Kim,† EunAe Cho,† Sung Jong Yoo,† Suk Woo Nam,†,§ Tae-Hoon Lim,† Jong Jin Yoon,# Sehkyu Park,¶,* and Jong Hyun Jang†,§,* †Fuel Cell Research Center, Korea Institute of Science and Technology (KIST), Seoul 136-791, Korea. *E-mail: [email protected]‡Department of Chemical and Biomolecular Engineering, Yonsei University, Seoul 120-749, Korea §Green School, Korea University, Seoul 136-713, Korea
#Research & Development Division, Hyundai Motor Company, Gyeonggi-do 446-912, Korea
¶Department of Chemical Engineering, Kwangwoon University, Seoul 139-701, Korea. *E-mail: [email protected] Received June 11, 2014, Accepted August 8, 2014
This paper describes how primary contaminants in ambient air affect the performance of the cathode in fuel cell electric vehicle applications. The effect of four atmospheric pollutants (SO2, NH3, NO2, and CO) on cathode performance was investigated by air impurity injection and recovery test under load. Electrochemical analysis via polarization and electrochemical impedance spectroscopy was performed for various concentrations of contaminants during the impurity test in order to determine the origins of performance decay. The variation in cell voltage derived empirically in this study and data reported in the literature were normalized and juxtaposed to elucidate the relationship between impurity concentration and performance. Mechanisms of cathode degradation by air impurities were discussed in light of the findings.
Key Words : Air impurity, Performance loss, Voltage recovery, Cathode, Proton exchange membrane fuel cell
Introduction
Proton exchange membrane fuel cells (PEMFCs) are considered a promising technology to address the depletion of fossil fuels and global problems associated with the emission of greenhouse gases. Compared with conventional power sources, PEMFCs have several advantages such as rapid start-up, high power-density, long-term durability, zero emission of pollutants, high fuel-to-energy efficiency, and flexibility of reactant fuel.1-4 For these reasons, PEMFCs have
been extensively developed for fuel cell electric vehicles (FCEVs) to replace conventional internal-combustion-engine (ICE) vehicles, as well as for portable and residential appli-cations.4,5
As already pointed out by many fuel cell scientists and engineers, there remain two main barriers to commercially viable FCEVs: cost-effectiveness and durability.4-6 Recently,
many studies of PEMFCs have focused on the develop-ment of inexpensive and durable materials/components in PEMFCs.7-12 In addition, the effect of impurities in hydrogen
feed has been researched mainly for the utilization of refor-mate gases.13 However, the effect of atmospheric pollutants
in cathode feeds, such as sulfur dioxide (SO2), ammonia
(NH3), nitrogen dioxide (NO2), and carbon monoxide (CO),
has received less attention, even though it is considered a practical issue for the performance and durability of FCEVs. Cathode degradation/failure due to air impurities shorten the lifetime of the PEMFC stack, resulting in additional ex-penses for its maintenance and recovery.
The cathode degradation by air impurity is studied for automotive and stationary applications.13,14 For stationary
application, the impurity effect was investigated by measur-ing a decay rate upon natural exposure, for more than thousands hours, to the atmospheric contaminant of which concentration was sub ppb.14 For automotive application,
however, the impurity level is subject to be hundreds ppm.13
Moreover, the operation time for fuel cell vehicle is within few hours, and the duration of exposure is limited. Therefore, the impurity effects seen from both cases should be distin-guished and analyzed by entirely different perspectives. This study is solely focused on the automotive application.
According to national ambient air quality standards (NAAQS), the concentration of atmospheric pollutants, with 1 h-averaging time, should be less than 0.075 ppm for SO2,
0.1 ppm for NO2, and 0.075 ppm for CO.15 Moreover, impurity
concentrations for typical FCEV operating conditions on highways are expected to be much higher than the standard values in NAAQS, due to emissions from conventional ICEs. It has been reported that the emissions from ICEs contain 4 ppm of SO216 and 6 ppm of NH3.17 In addition, the measured
concentrations of NO2 (28 ppm)18 and CO (155 ppm)19 for
highway locations were much higher than NAAQS standards. Hence, it would be worthwhile to analyze the effect on fuel cell performance of various atmospheric pollutants across a wide range of concentrations. The results are expected to inform the effective design of FCEVs with an adequate air filtration system.
The influence of individual impurities on cathode perfor-mance has been investigated using various oxidants contain-ing impurities such as SO2,20-24 NH3,23,25 NO2,20-23,26 and
CO.20 For example, Moore et al.20 analyzed the impurity
effect of SO2, NO2, and CO at fixed concentrations of 500
ppb, 400 ppb, and 20 ppm, respectively. Van Zee’s group21
reported more severe degradation with higher concentration of SO2 (5 ppm) and NO2 (5 ppm) in air. However, most
previous studies only tested selected impurities at fixed concentrations, and so their conclusions stopped short of generalizing the effects of impurities on FC performance. In addition, as the test procedures and conditions differed, it is very difficult to develop a general discussion via analysis of the experimental results from the various reports. Therefore, comprehensive performance measurement for major con-taminants under standardized conditions is imperative for the development of practical FCEVs.
In this study, durability tests of four different impurities (SO2, NH3, NO2, and CO) were conducted at concentrations
from 1–100 ppm (10–1000 ppm for CO) to offer more practical data for FCEV applications in a typical road condi-tion, through a comprehensive and comparative study. An analysis protocol was developed to evaluate the effect of contaminants on constant-current operation at 1 A/cm2,
re-zpresented by polarization curves and electrochemical impedance spectroscopy (EIS). This facilitates effective analysis of apparent performance variation and polarization sources, caused by the individual contaminants at various concentrations. This systematic analysis of the effect of atmospheric pollutants is expected to provide fuel cell researchers and manufacturers with practical information on the control of on-site air feed to the cathode compartments in PEMFC stacks (e.g., selective air filtering), and to further develop impurity-tolerant catalysts at the cathode.
Experimental
For single cell tests, a commercially available membrane electrode assembly (MEA) (Series 5710, GoreTM,
carbon-supported Pt catalyst, 0.4 mgPt/cm2 at cathode and anode, 25
cm2) was inserted into a single-cell fixture with serpentine
flow channels. After its installation at a fuel cell test station, a single cell was activated under constant voltage (0.45 V) for 20 h at 65 °C. Humidified hydrogen and air were fed to the anode and cathode at a flow rate of 417 cm3/min and
1300 cm3/min, corresponding to stoichiometric ratios at 1.6
A/cm2 of 1.5 and 2.0 respectively.
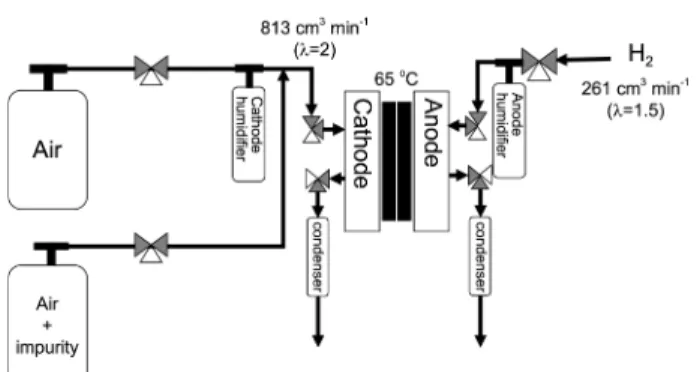
Electrochemical characterization of the effect of air impurities comprised three steps: reference step, poisoning step, and recovery step. To the cathode, uncontaminated air was supplied during reference and recovery steps, and air/ impurity mixture gas in the poisoning step, whereas humidi-fied hydrogen was supplied to the anode during all three steps. The flow rates for the anode (hydrogen) and cathode (air or air/impurity mixture) were controlled at 261 cm3/min
and 813 cm3/min, corresponding to stoichiometric ratios at
1.0 A/cm2 of 1.5 and 2.0 respectively. This study examined
the effects of four air impurities: sulfur dioxide (SO2),
ammonia (NH3), nitrogen dioxide (NO2), and carbon
mon-oxide (CO). Air/impurity gas mixture with a fixed
air-to-impurity ratio of 9:1 was diluted by humidified air stream to give impurity concentrations of 1 ppm, 10 ppm, 100 ppm, and 1000 ppm (Figure 1). The air/impurity mixture was injected after the cathode humidifier to avoid the dissolution of impurity in the water of the humidifier, because impurity has certain degree of solubility in water: 90 g/L for SO2, 480
g/L for NH3 at 25 °C. The flow rate of air/impurity gas and
humidified air was controlled to maintain constant total flow rate with pre-determined impurity level.
The air impurity injection and recovery test comprising three steps is depicted in Figure 2. The cell was operated at 65 °C under atmospheric conditions, because the operating temperature of fuel cell for automotive application resides between 60 and 80 °C.13,27 First, during the reference step,
the cell was operated at constant current of 1 A/cm2 for 2 h
with uncontaminated air in the cathode. Then, after the contaminated cathode feed was introduced (poisoning step), an open-circuit voltage (OCV) operation (1 h) and constant-current operation (2 h) were carried out to monitor perfor-mance decay. In the recovery step, the cathode feed reverted to clean air and voltage variation was measured at 1 A/cm2
(2 h). For each step, 15 min-polarizations were conducted before and after constant current operation (2 h). On that note, the duration of reference, poisoning, and recovery step was 2.5 h, 3.5 h, and 2.5 h, respectively, where the poisoning Figure 1. Schematic diagram for air impurity injection and recovery test.
Figure 2. The sequence for measuring voltage and impedance during air impurity injection and recovery test.
step contains additional OCV operation (1 h). Therefore, the total time to evaluate the effect of specific air impurity was 8.5 h, as seen in Figure 2. The voltage decay during constant current operations was evaluated by measuring the initial and final voltages in reference (E1 and E2), impurity (E3 and
E4), and recovery (E5 and E6) steps. In addition, EIS analysis
was carried out at the end of reference step (ZA), impurity
step (ZB), and recovery step (ZC), where the electrode
potential was 0.85 V. Electrochemical measurements were performed with a potentiostat (Bio-Logic SAS) that was automatically controlled by EC-Lab software.
Results and Discussion
Effect of SO2 Impurity in Air. Figure 3(a) presents the initial and final cell voltages of constant current operations in reference (E1 and E2), impurity (E3 and E4), and recovery
(E5 and E6) steps. The SO2 concentrations were 1 ppm, 10
ppm, and 100 ppm. The difference in cell voltage between E1 and E2 during the reference step was approximately 5.6
mV, demonstrating that the MEA performance was fairly consistent when supplied with uncontaminated air. However, when 1 ppm and 10 ppm SO2 were injected, the initial
voltage in constant current operation (E3) significantly
declined by 113 mV and 122 mV, respectively. In the case of 100 ppm SO2, the degradation was so severe that the cell
could last for only 15 min. The results indicated that the cathode showed drastic loss of active sites with increasing SO2 concentration under load.
The voltage variation by impurity injection during OCV should be also considered for automotive application, because the fuel cell-powered vehicles experience dynamic load during the real-life operation. Please be noted that the E3, the
initial voltage of constant current operation, represents the accumulated performance decay during OCV and polari-zation (current increase) operations. In addition, some may argue that the voltage decay could be partially responsible for carbon corrosion during PEMFC operation, especially at OCV. The carbon corrosion is another factor which degrades cathode of PEMFC, however, it takes place when the voltage exceeds 1.2 V or beyond, which is out of range in this study. Therefore, the effect of the carbon corrosion on the degrada-tion should not be considered.
Meanwhile, the cell voltages with the recovery phase (E5
and E6) were lower than those measured before the
poison-ing for 1 ppm and 10 ppm SO2. In other words, the voltages
never reached the values recorded during the reference step. From the results, it was noted that, following cathode con-tamination by even low concentrations of SO2, the cell
perfor-mance barely recovered despite the subsequent reintroduc-tion of uncontaminated air to the cathode.
From the final cell voltage at each step (E2, E4, and E6), the
maximum performance decay (ΔEmax) and unrecoverable
performance decay (ΔEunr) were calculated via Eqs. (1) and
(2) and plotted as a function of impurity concentration in Figure 3(b).
∆Emax = [(E2-E4)/E2] × 100 (%) (1)
∆Eunr = [(E2-E6)/E2] × 100 (%) (2)
For comparison, Figure 3(b) shows values of ∆Emax from
experimental data in the literature together with ∆Emax from
the present study. For the results reported by Moore et al.,20
the maximum cell performance decay with 0.5 ppm SO2
(0.05 A/cm2 and 0.5 h duration) was found to be on the trend
line for this study (indicated by ). In contrast, the values for maximum cell performance decay ratio reported by Mohtadi et al.21 ( and ), Jing et al.22 ( ), and Nagahara et al.23
( ) were relatively high, probably due to longer exposure time to SO2 (> 23 h).
The voltage decay associated with SO2 contamination can
be explained by the poisoning of Pt active sites in the presence of SO2. The adsorption of sulfur species on Pt
catalysts in MEA was experimentally supported by the CV analysis with single cell in the presence of SO2: the
decreas-ed hydrogen stripping charge22 and oxidation peaks for
ad-sorbed sulfur species.21,28 In addition, the strong adsorption
of SO2 on polycrystalline Pt was confirmed by Fourier
trans-form infrared spectroscopy (FTIR).29 Accordingly, the
volt-age increase during recovery step (E4–E6) contributed to the
partial recovery of Pt active surface with SO2 desorption. It
□
△ ▽ ◇
△
Figure 3. (a) Variation in cell voltage interrupted by SO2; (b)
was suggested that in a highly humidified atmosphere with O2 supply, adsorbed SO2 can be readily converted into H2SO4
and washed away via the reaction shown below:22
2Pt-SO2 + O2 → 2Pt-SO3 (3)
Pt-SO3 + H2O → H2SO4 + Pt (4)
When the cathodic overpotential became very large, it was proposed that SO2 can be electrochemically reduced to S on
Pt surface, based on the cathodic peak at 0.21 V in linear sweep test (vs. RHE).30 It was reported that the
electro-chemical oxidation of Sad to sulfate in aqueous phase
requir-ed potential cycling up to 1.5 V,24 suggesting that the
reactivation of Pt surface by electrochemical desorption of Sad was very difficult in typical PEMFC operating
condi-tions. Therefore, in this study it seemed that the Pt surface blocked by Sad with significant voltage decay at high SO2
concentration was not fully recovered, because the cell volt-age was maintained below 1.0 V, which probably resulted in incomplete recovery of cell voltage as shown in Figure 3(b) (indicated by ).
Effect of NH3 Impurity in Air. The effect of NH3 on the
PEMFC cathode was previously reported only for a fixed concentration of 5 ppm23 and 48 ppm,25 while the effect on
the anode has been reported for wide range of concentration (13-1000 ppm) by several research groups.31-33 In this study,
three simulated air mixtures with various NH3 contents (1
ppm, 10 ppm, and 100 ppm) were employed to examine the effect of NH3 contamination across a wide range of
con-centration on the electrochemical behavior of the PEMFC cathode. Figure 4(a) depicts the variation in cell voltage during reference, poisoning, and recovery steps with NH3
contamination. At low NH3 concentration (1 ppm), no
vari-ation in cell voltage was observed, whereas the same amount of SO2 induced significant performance decay. However, as
NH3 concentration increased to 10 ppm and 100 ppm, the
impurity effect became very clear and the cell voltages at 1 A/cm2 significantly decreased. In Figure 4(b), the decay in
cathode performance is presented as a function of NH3
impurity. Compared to this study, the degradation reported by Nagahara et al.23 and Garzon et al.25 was smaller
probab-ly due to the shorter exposure time (0.5 h and 1 h, respec-tively).
The effect of NH3 impurity has been reported to be closely
related to the decrease in the conductivity of proton ex-change membrane (PEM)25,31,32 and ionomers in catalyst
layer.31,32 For example, Uribe et al.31 confirmed the increase
in ohmic resistance by impedance technique after injecting 30 ppm of NH3 to anode for 3 h. They proposed that NH4+
ions, which are produced by the protonation of NH3, can
replace protons in the membrane electrolyte and/or ionomers in catalyst layers, resulting in the increase of ohmic re-sistance and the decrease in cell voltage. The conductivity decrease with NH4+ has been experimentally reported for
Nafion membranes.34,35 When the uncontaminated air was
supplied to NH3-exposed single cells, the cell voltage was
partially recovered, probably through the disproportionation
of NH4+ into protons and NH3 as reported by Nagahara
et al.25
Effect of NO2 Impurity in Air. It is well known that NO2,
a main contributor to air pollution that causes smog and acid rain, is primarily produced from ICEs where oxygen and nitrogen in the air react at high temperature. Therefore, during operation, exposure of the cathode in FCEVs to NO2
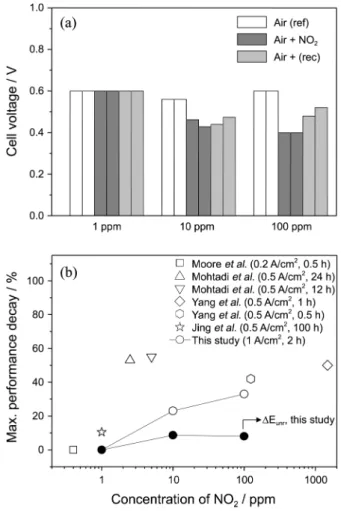
is unavoidable in the presence of conventional ICE vehicles. Figure 5(a) presents the dependence of cell voltage on NO2
concentration through NO2 impurity injection and recovery
test. No decay in performance is detected at low impurity level of 1 ppm, but the decay gradually increased with higher NO2 concentration. However, unlike SO2 and NH3 in the air,
no complete potential decay is observed at 100 ppm. Rather, the cathode showed relatively robust recovery against NO2
poisoning.
In Figure 5(b), it appeared the maximum performance decay ratio in this study was in line with the data reported by Yang et al.26 who exposed the cathode to NO
2 for a relatively
short duration. Meanwhile, relatively long impurity inflow to the cathode (Mohtadi21 and Jing22) resulted in a drastic
decay of cathode performance. Regarding the performance decay with NO2 impurity in cathode feeds, Mohtadi et al.
reported that, based on the CV analysis, there was no Pt poisoning by adsorption of NO2 species, and therefore
●
Figure 4. (a) Variation in cell voltage interrupted by NH3; (b)
supposed that the increase of ohmic resistance was the main degradation mechanism, where NO2 was electrochemically
reduced into NH4+.21
Effect of CO Impurity in Air. It is generally accepted that CO preferentially and strongly adsorbs onto Pt surface. Therefore, when CO is contained in fuel feeds to anodes, the electrochemical surface area in Pt nanoparticles drastical-ly reduces, as demonstrated experimentaldrastical-ly by various authors.27,36,37 However, when CO was introduced in the air
feed to cathodes, the voltage decrease by CO poisoning was found to be very small (Figure 6(a)), which is in agreement with results at 20 ppm CO reported previously.20
According-ly, the performance decay ratio was very low, demonstrating that the effect of CO in air feed is practically negligible (Figure 6(b)).
It is believed that CO adsorbed onto Pt catalysts in the cathode is quickly oxidized to gaseous CO2, resulting in no
significant deleterious effect on catalytic active sites even at 1000 ppm CO. As the electrode potential of the cathode is about 0.6 V, in this study at 1 A/cm2, electrochemical
oxida-tion of the adsorbed CO molecules is expected to be very rapid to maintain a free Pt active surface area, while the electrochemical oxidation of CO molecules is known to start at ~0.3 V vs. RHE in aqueous electrolyte.38 Thus, as the
operating voltage range was above 0.5 V in this study, CO
in the cathode seems to have little influence on PEMFC performance.
Polarization Curves and EIS Analysis. Figure 7 shows the polarization curves during poisoning step with 10 ppm of various impurities. As seen, the characteristics of the SO2
polarization curve differed with NH3 and NO2 polarization
curve, which tells the origin of degradation was different. Of note, the voltages at 1.0 A/cm2 in the polarization curves
corresponded to the E3 values in Figures 3(a), 4(a), 5(a), and
6(a). As the overpotential at low current density was greater for SO2, it can be concluded that the Pt poisoning effect was
more significant compared to that for NH3 and NO2, which
was in agreement with the discussion in previous sections. The cell degradation by NO2 was similar to the NH3, and the
effect of CO impurity was found to be negligible.
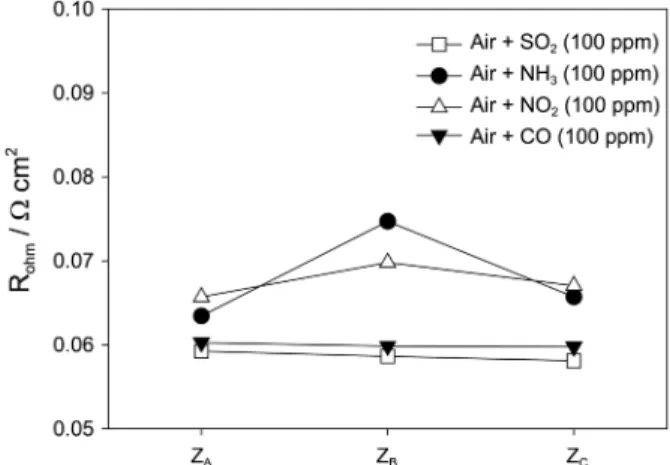
To confirm the major mechanism of each air impurity, EIS analysis was carried out throughout the reference, impurity, and recovery steps. Please be noted that, due to the current limitation of the used potentiostat, the EIS measurement was performed at a dc potential of 0.85 V and utilized only to evaluate the variation of ohmic resistance (Rohm), whereas
the cell voltages at 1 A/cm2 was around 0.4 V. As the
formation of NH4+ via protonation of NH3 is expected to be
enhanced by higher current (large amount of proton supply), the Rohm variation analyzed at 0.85 V can be assumed to be
Figure 5. (a) Variation in cell voltage interrupted by NO2; (b) Comparison of performance decay ratio.
Figure 6. (a) Variation in cell voltage interrupted by CO; (b) Comparison of performance decay ratio.
much smaller than the actual variation during constant current operation (1 A/cm2).
In Figure 8, the Rohm values, which were determined from
the high-frequency intercepts in experimental Nyquist plots, was provided for four air pollutants at a concentration of 100 ppm. It can be noticed that Rohm at 0.85 V was significantly
increased by NH3 and NO2 impurities, suggesting that the
decrease in proton conductivity by NH4+ formation. In the
case of SO2 impurity, the change in Rohm was insignificant,
indicating that the performance decay was mainly due to the catalyst poisoning.
Conclusion
In this study, effect of four major pollutants in ambient air (i.e., SO2, NH3, NO2, and CO) on PEMFC performance was
examined through air impurity injection to cathodes follow-ed by recovery test. At higher concentration, the impurity effect on voltage degradation gradually increased for SO2,
NH3 and NO2, whereas CO induced practically no effect. At
a concentration of 10 ppm, the degradation was most severe for SO2 impurity (ca. 50%) compared with NH3 and NO2. At
100 ppm, both SO2 and NH3 severely degraded the PEMFC
single cell, which was ascribed to Pt poisoning and PEM degradation with NH4+ formation, respectively, based on the
literature and experimental data obtained in this study. When uncontaminated air was supplied again, the voltage recovery was found to be incomplete, due to the combined effect of irreversible degradation and insufficient recovery time. The systematic analysis in this study is expected to provide practical information for the design and control of PEMFC stacks, while further detailed investigation is also required, focusing on selected impurity condition.
Acknowledgments. This work was supported by the New & Renewable Energy Core Technology Program of the Korea Institute of Energy Technology Evaluation and Planning (KETEP) funded by the Korean Ministry of Trade, Industry & Energy (No. 20133030011320), the National Research Foundation of Korea Grant funded by the Korean Government (MSIP) (2014, University-Institute cooperation program), and the NRF grant funded by MSIP, Korea (2014R1A2A2A04003865). This work was also financially supported by KIST through Institutional Program and K-GRL program; and by the research grant of Kwangwoon University in 2014.
References
1. O’hayer, R. P.; Cha, S.-W.; Colella, W.; Prinz, F. B. Fuel Cell Fundamentals; John Wiley& Sons Ltd.; New York, 2006. 2. Larminie, J.; Dicks, A. Fuel Cell System Explained; John Wiley &
Sons Ltd.; West Sussex; England, 2000. 3. Prater, K. B. J. Power Sources 1994, 51, 129.
4. Wang, Y.; Chen, K. S.; Misher, J.; Cho, S. C.; Adroher, X. C. Appl. Energy 2011, 88, 981.
5. Barbir, F. PEM Fuel Cells: Theory and Practice, 1st ed.; Elesevier Academic Press: New York, 2005.
6. Helmot, R.; Eberle, U. J. Power Sources 2007, 165, 833. 7. Bashyam, R.; Zelenay, P. Nature 2006, 443, 63.
8. Lefevre, M.; Proietti, E.; Jaouen, F.; Dodelet, J.-P. Science 2009, 324, 71.
9. Jaouen, F.; Proietti, E.; Lefevre, M.; Chenitz, R.; Dodelet, J.-P.; Wu, G.; Chung, H. T.; Johnston, C. M.; Zelenay, P. Energ. & Environ. Sci. 2011, 4, 114.
10. Huang, S.-Y.; Ganesan, P.; Park, S.; Popov, B. N. J. Am. Chem. Soc. 2009, 131, 13898.
11. Antolini, E. ACS Catal. 2014, 4, 1426.
12. Pascone, P.-A.; Berk, D.; Meunier, J.-L. Catal. Today 2013, 211, 162.
13. Borup, R.; Meyers, J.; Pipovar, B.; Kim, Y. S.; Mukundan, R.; Garland, N.; Myers, D.; Wilson, M.; Garzon, F.; Wood, D.; Zeleny, P.; More, K.; Stroh, K.; Zawodzinski, T.; Boncella, J.; McGrath, J. E.; Inaba, M.; Miyatake, K.; Hori, M.; Ota, K.; Ogumi, Z.; Miyata, S.; Nishikata, A.; Siroma, Z.; Uchimoto, Y.; Yasuda, K.; Kimijima, K.; Iwashita, N. Chem. Rev. 2007, 107, 3904.
14. Verhage, A. J. L.; Coolegem, J. F.; Mulder, M. J. J.; Yildirim, M. H.; De Bruijn, F. A. Int. J. Hydrogen Energ. 2013, 38, 4714. 15. National Ambient Air Quality Standards. U.S. Environmental
Protection Agency. 2007, http://www.epa.gov/air/criteria.html. Accessed July 2013.
16. Lee, C.; Richer, A.; Lee, H.; Kim, Y. J.; Burrows, J. P.; Lee, Y. G.; Choi, B. C. Atmos. Environ. 2008, 42, 1461.
17. Harkins, J. H.; Nicksic, S. W. Environ. Sci. Technol. 1967, 1(9), 751.
Figure 7. Polarization curves for PEMFCs with air impurities (10 ppm) of SO2, NH3, NO2 and CO.
Figure 8. Ohmic resistance variations with cathode impurities (100 ppm) at a dc potential of 0.85 V.
18. Torp, C.; Larssen, S. Sci. Total. Environ. 1996, 189/190, 35. 19. Murena, F.; Garofalo, N.; Favale, G. Atmos. Environ. 2008, 42,
8204.
20. Moore, J. M.; Adcock, P. L.; Lakeman, J. B.; Mepsted, G. O. J. Power Sources 2000, 85, 254.
21. Mohtadi, R.; Lee, W.-K.; Van Zee, J. W. J. Power Sources 2004, 138, 216.
22. Jing, F.; Hou, M.; Shi, W.; Fu, J.; Yu, H.; Ming, P.; Yi, B. J. Power Sources 2007, 166, 172.
23. Nagahara, N.; Sugawara, S.; Shinohara, K. J. Power Sources 2008, 182, 422.
24. Fu, F.; Hou, M.; Du, C.; Shao, Z.; Yi, B. J. Power Sources 2009, 187, 32.
25. Garzon, F. H.; Lopes, T.; Rockward, T.; Sansinena, J.-M.; Kienitz, B.; Mukundan, R.; Springer, T. ECS Trans. 2009, 25(1), 1575. 26. Yang, D.; Ma, J.; Xu, L.; Wu, M.; Wang, H. Electrochim. Acta
2006, 51, 4039.
27. Balasubramanian, B.; Barbir, F.; Neutzler, J. 1999, http:// web.anl.gov/PCS/acsfuel/preprint%20archive/Files/
44_4_NEW%20ORLEANS_00-99_0977.pdf. Accessed 27 Nov 2013
28. Cheng, X.; Shi, Z.; Glass, N.; Zhang, L.; Zhang, J.; Song, D.; Liu, Z.-S.; Wang, H.; Shen, J. J. Power Sources 2007, 165, 739.
29. Quijada, C.; Rodes, A.; Vazquez, J. L.; Perez, J. M.; Aldaz, A. J. Electroanal. Chem. 1995, 394, 217.
30. Contractor, A. Q.; Lal, H. J. Electroanal. Chem. 1978, 93, 99. 31. Uribe, F. A.; Gottesfeld, S.; Zawodzinski, T. A. J. Electrochem.
Soc. 2002, 149(3), A293.
32. Soto, H. J.; Lee, W.-K.; Van Zee, J. W.; Murthy, M. Electrochem. Solid St. 2003, 6(7), A133.
33. Halseid, R.; Vie, P. J. S.; Tunold, R. J. Power Sources 2006, 154, 343.
34. Halseid, R.; Vie, P. J. S.; Tunold, R. J. Electrochem. Soc. 2004, 151(3), A381.
35. Hongsirikarn, K.; Goodwin, J. G.; Greenway, S.; Creager, S. J. Power Sources 2010, 195, 30.
36. Springer, T. E.; Rockward, T.; Zawodzinski, T. A.; Gottesfeld, S. J. Electrochem. Soc. 2001, 148(1), A11.
37. Bauman, J. W.; Zawodzinski, T. A., Jr.; Gottesfeld, S. In Proton Conducting Membrane Fuel Cells II, The Electrochemical Society Proceedings Series; Gottesfeld, S., Fuller, T., Eds.; Pennington, NJ, 1999; 98-27, p 136.
38. Arenz, M.; Mayhofer, K. J. J.; Stamenkovic, V.; Blizanac, B. B.; Tomoyuki, T.; Ross, P. N.; Markovic, N. M. J. Am. Chem. Soc. 2005, 127, 6819.