IOP Conference Series: Materials Science and Engineering
PAPER • OPEN ACCESS
Development human thermoregulation model for Korean young and
older men
To cite this article: HeeWon Choi et al 2019 IOP Conf. Ser.: Mater. Sci. Eng. 609 042106
View the article online for updates and enhancements.
IAQVEC
IOP Conf. Series: Materials Science and Engineering 609 (2019) 042106
IOP Publishing doi:10.1088/1757-899X/609/4/042106
Development human thermoregulation model for Korean
young and older men
HeeWon Choi1, YoungMin An1, SungWon Cho1, Junseok Park1,*, SeoYeon Yun1, JiYoung
Kwak1, ChungYoon Chun1
1 Department of Architectural Engineering, Hanyang University, Seoul 04763 Republic of Korea
Abstract. The Purpose of this research is to develop the Korean of human physiology model and thermal comfort
assessment. As a first step, we developed models for young men and older men, which calculate the skin temperature of each body segments and predict the thermal sensation of indoor environment. The typical body for 20-30 (younger) and 40-50 (older) years old of Korean men modelled using the data that gathered from ‘National Anthropometric Survey of Korea 2010 (Size Korea)’. In order to calculate the surface area and mass of the models, these data used to calculate the surface area of each segment using the formula of Dubois and Dubois’s and the mass of each segment using a study of Stolwijk. Using the developed models, the local skin temperature was predicted and compared. In the neutral environment, the body parts in the 4-50s were smaller in surface area and mass than those in the 2-30s, resulting in smaller predicted skin temperatures. In case of the mass of the segment was increased, the change of skin temperature was different according to the part.
1. Introduction
The indoor of the building is non-uniform of various environmental factors such as air temperature, humidity and wind speed, and so the occupants feel the different thermal sensation depending on body segments. People’s reaction in asymmetrical environments depend not simply on the body’s overall thermal sensibility, but on the thermal sensibility of local body parts [1, 2]. In order to predict the thermal sensation of the whole body, it is necessary to derive the overall thermal sensation taking into consideration the local segment sensation of the body. In addition, individual characteristics on human sensation may be different depending on such factors as sex, body structure, age and race [3]. Zhou [4] found that differences between Eastern and Western people comes from body size and composition, and the difference in skin temperature between two races was up to 2℃.
Thermal comfort model included physiological and psychological model. Physiological model is the purpose of predicting the local skin temperature from environmental factors. The 2-node model developed by Gagge [5], which separated the human body into core and skin layer and comprised thermal control equation of human body. Stolwijk [6] developed a 25-node model that divided the human body into 6 segment (Head, Trunk, Arms, Hands, Legs, Feet) and one central blood and each one segment with four layers (Core, Muscle, Fat, Skin). The one central blood component was heat exchanged through the blood flow with 24-nodes. And in the skin layer of each segment which was in contact with the external environment, heat exchange between the skin and the surrounding environment was induced. Since then, many researchers based on the Stolwijk model have made several model, Zhang [3] separated the human body into 16 segments and considered factors such as blood flow model, clothing, heat transfer and radiation heat flux. Tanabe [7] developed the 65-node model, assuming that local body segments consisted of four layers and a weighting factor was introduced for each layer. And Fiala [8] developed physiological model that takes into account both passive and active systems (shivering, sweating) of the body.
IAQVEC
IOP Conf. Series: Materials Science and Engineering 609 (2019) 042106
IOP Publishing doi:10.1088/1757-899X/609/4/042106
2
In Korea, the thermoregulation models based on Western is used, which is not accurately predicted because the physical characteristics of Koreans are not considered. Therefore, it is necessary to make a thermoregulation model considering the characteristics of Korean.
2. Establishment of Korean men physiology model
As a first step, a model was developed for young and older men. In the establishment of a Korean men physiology model, direct results (2-30s data n=1,734, 4-50s data n=736) and 3D shape measurement
data (2-30s data n=438, 4-50s data n=414) were used among the results of the 6th (2010 year) of the
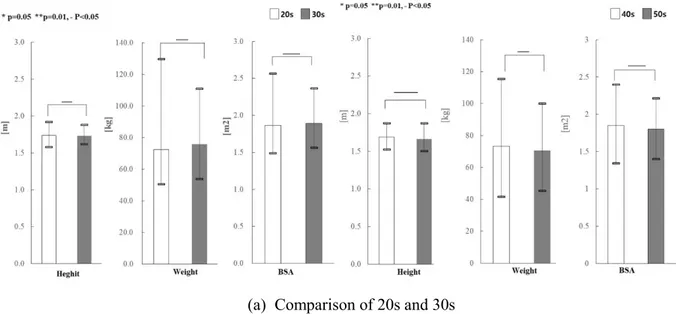
National Anthropometric Survey of Korea (Size Korea) [9]. And additional data was used by Lee [10] directly measured in 34 data from 2-30s and 6 data from 4-50s were used. The body types from the 20s to the 30s and the 40s to the 50s were compared by t-test verification method and both groups were not statistically significant (P<0.05). Therefore, it was divided into two groups of 2-30s and 4-50s. Both height and weight were larger in the 2-30 group than 4-50 group, and the whole body surface area (BSA) was obtained from the Dubois formula [11]. The whole body surface area of two groups was compared and the 2-30s group was about 0.059m2 larger than the 4-50s group.
(a) Comparison of 20s and 30s (b) Comparison of 40s and 50s
Figure 1. Comparison of young and older men by T-test (2-30s, 4-50s) Table 1. Comparison of Korean men’s body type
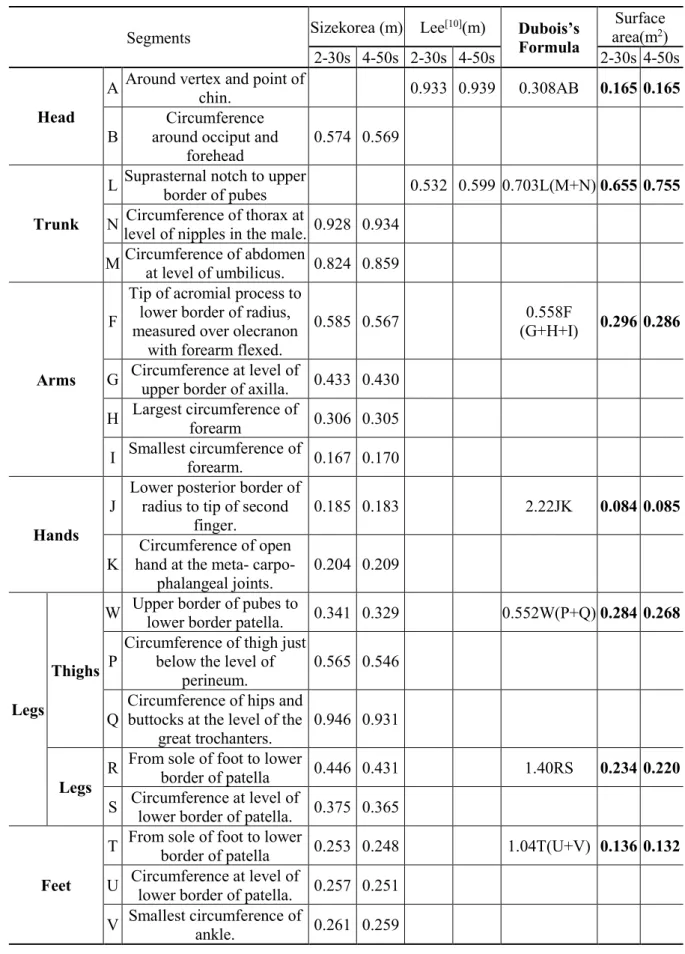
To obtain the surface area of 16 segments (Head, Chest, Back, Pelvis, Left/Right shoulder, Left/Right arm, Left/Right hand, Left/Right thigh, Left/Right leg, Left/Right foot), as a first step, 6 segments (Head, Trunk, Arms, Hands, Legs, Feet) were calculated using Dubois’s formula [11]. When compared the value of Lee [10] according to age, there was a difference the Trunk part of chest, back, pelvis and this is estimated as a difference in the segmented range when calculating the surface area by dividing the body part of the used data.
Model Height (cm) Weight (kg) Surface Area (m2)
Korean Men 2-30s 172.9 72.2 1.856
IAQVEC
IOP Conf. Series: Materials Science and Engineering 609 (2019) 042106
IOP Publishing doi:10.1088/1757-899X/609/4/042106
Table 2. The 6segment surface area calculated by the Dubois formula
Segments Sizekorea (m) Lee[10](m) Dubois’s Formula area(mSurface 2)
2-30s 4-50s 2-30s 4-50s 2-30s 4-50s
Head
A Around vertex and point of chin. 0.933 0.939 0.308AB 0.165 0.165
B around occiput and Circumference
forehead 0.574 0.569
Trunk
L Suprasternal notch to upper border of pubes 0.532 0.599 0.703L(M+N) 0.655 0.755
N Circumference of thorax at level of nipples in the male. 0.928 0.934 M Circumference of abdomen at level of umbilicus. 0.824 0.859
Arms
F
Tip of acromial process to lower border of radius, measured over olecranon
with forearm flexed.
0.585 0.567 (G+H+I) 0.296 0.286 0.558F
G Circumference at level of upper border of axilla. 0.433 0.430 H Largest circumference of forearm 0.306 0.305 I Smallest circumference of forearm. 0.167 0.170
Hands
J Lower posterior border of radius to tip of second
finger. 0.185 0.183 2.22JK 0.084 0.085
K hand at the meta- carpo-Circumference of open
phalangeal joints. 0.204 0.209
Legs
Thighs
W Upper border of pubes to lower border patella. 0.341 0.329 0.552W(P+Q) 0.284 0.268 P Circumference of thigh just below the level of
perineum. 0.565 0.546
Q Circumference of hips and buttocks at the level of the
great trochanters. 0.946 0.931
Legs R From sole of foot to lower border of patella 0.446 0.431 1.40RS 0.234 0.220
S Circumference at level of lower border of patella. 0.375 0.365
Feet
T From sole of foot to lower border of patella 0.253 0.248 1.04T(U+V) 0.136 0.132
U Circumference at level of lower border of patella. 0.257 0.251 V Smallest circumference of ankle. 0.261 0.259
IAQVEC
IOP Conf. Series: Materials Science and Engineering 609 (2019) 042106
IOP Publishing doi:10.1088/1757-899X/609/4/042106
4
Table 3. Comparison of Korean men’s 6segment surface area
Segment Korean men 2-30s (m2) Korean men 4-50s(m2) Stolwijk[6] (m2) Tanabe [7] (m2) US EPA[12] (m2) Development
Model Lee[10] Development Model Lee[10]
Head 0.165 0.165 0.165 0.165 0.133 0.140 0.124 Trunk 0.655 0.655 0.755 0.755 0.680 0.557 0.674 Arms 0.296 0.274 0.286 0.265 0.254 0.318 0.272 Hands 0.084 0.088 0.085 0.093 0.095 0.100 0.094 Legs 0.518 0.533 0.488 0.463 0.597 0.642 0.594 Feet 0.136 0.125 0.132 0.123 0.130 0.112 0.124 Total 1.856 1.840 1.911 1.865 1.888 1.870 1.880
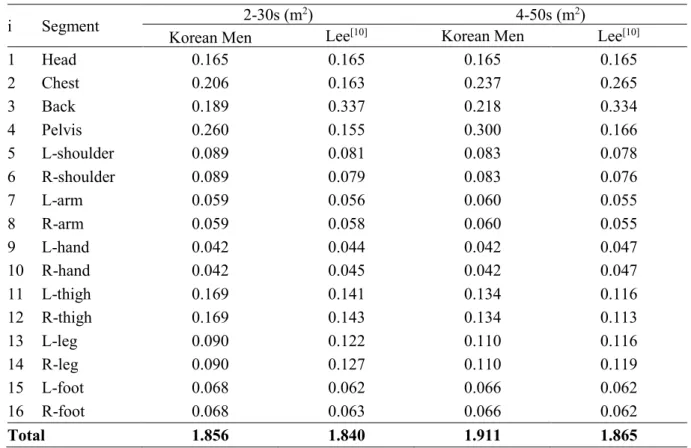
The result of previous studies confirm that the exact extent of the segment is different for each researcher. Based on the data of Size Korea, 6 segments were divided into 16 segments. The mass was calculated based on the surface area of each part, Stolwijk [6] used the assumption of the human body density and volume to calculate the mass of 16 segments based on the surface area. The blood component was calculated by using the total mass ratio of the model in proportion to the mass. The heat capacity of 4-layer (core, muscle, fat, skin) is based through the calculation of the mass. Specific heat is as follows. The skeleton is 0.5gcal/g℃ and the fat is 0.6gcal/g℃. The other tissues are 0.9gcal/g℃.
Table 4. Surface area of Korean men’s by age (2-30s, 4-50s)
i Segment 2-30s (m2) 4-50s (m2)
Korean Men Lee[10] Korean Men Lee[10]
1 Head 0.165 0.165 0.165 0.165 2 Chest 0.206 0.163 0.237 0.265 3 Back 0.189 0.337 0.218 0.334 4 Pelvis 0.260 0.155 0.300 0.166 5 L-shoulder 0.089 0.081 0.083 0.078 6 R-shoulder 0.089 0.079 0.083 0.076 7 L-arm 0.059 0.056 0.060 0.055 8 R-arm 0.059 0.058 0.060 0.055 9 L-hand 0.042 0.044 0.042 0.047 10 R-hand 0.042 0.045 0.042 0.047 11 L-thigh 0.169 0.141 0.134 0.116 12 R-thigh 0.169 0.143 0.134 0.113 13 L-leg 0.090 0.122 0.110 0.116 14 R-leg 0.090 0.127 0.110 0.119 15 L-foot 0.068 0.062 0.066 0.062 16 R-foot 0.068 0.063 0.066 0.062 Total 1.856 1.840 1.911 1.865
IAQVEC
IOP Conf. Series: Materials Science and Engineering 609 (2019) 042106
IOP Publishing doi:10.1088/1757-899X/609/4/042106
3. Prediction of Skin temperature
3.1. Prediction Skin Temperature of 16 segments for young and older men.
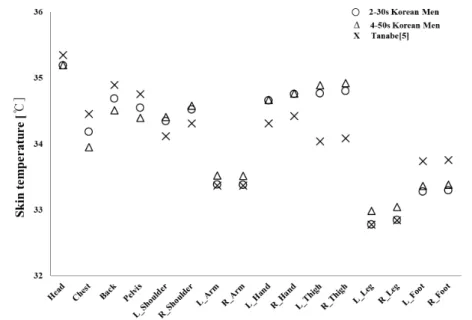
The environmental conditions were set to the neutral condition and the values of the clo and met (Air temperature: 25℃, RH: 50%, Air velocity: 0.1m/s). Radiation and convective heat transfer coefficients between the human body and the environment used in the thermal equations for the prediction of skin temperature were used as published data from UC Berkeley wind tunnel test results. This is a result of the convection heat transfer coefficient according to the radiant heat transfer coefficient and the wind speed for each part of human body through the wind tunnel test using the manikin [13]. The predicted skin temperature results of the constructed models were compared according to age. Predicting and comparing the skin temperature of the 65-node model of Tanabe [8] with the developed models, the skin temperature was lower in the trunk (Chest, Back, Pelvis) and feet segments of the developed models but higher in other segments. In the trunk, the skin temperature in the 4-50s was lower than that in the 2-30s, and the rest in the 4-50s was about 0.2-0.5℃ higher. The reason is that the skin temperature is lower because the trunk segment has a 4-50s lower surface area and mass.
Figure 2. Prediction skin temperature by young and older men (2-30s, 4-50s) 3.2. Effects of Changes in Body Shapes on Skin Temperature
The sense of warmth felt by changing body shape is different. Therefore, to confirm this, we checked the trend of changing skin temperature according to changes in body fat percentage. The body fat ratio was calculated and implemented in fat layer with 10%, 20% and 30%, and the environmental conditions were 20℃, 28℃ and 32℃ (RH 50%) to check the changes in skin temperature over time under three conditions. In environments with low temperatures of 20℃, the difference appeared to be around 1.4℃ in response to changes in body fat percentage, and the difference was reduced over time. The difference between the neutral (28℃) and high temperature (32℃) was small. In low temperature environments, people with higher body fat percent were found to have higher body temperature, but since this is a typical result of chest segment, different results are expected in different segment.
IAQVEC
IOP Conf. Series: Materials Science and Engineering 609 (2019) 042106
IOP Publishing doi:10.1088/1757-899X/609/4/042106
6
Figure 3. Prediction skin temperature by changing the layer composition ratio of segment (Chest) 4. Results and discussion
To establish the human physiology model according to the Korean body shape, 16 segments are calculated using information from the Dubois formula and Stolwijk model, and 4layers of mass and thermal capacity are calculated. Comparison of mass and surface area of 16 segments with previous research. The skin temperature of the 16 segments of the constructed models was calculated using the human body thermal equations and the material data of each segment. The predicted skin temperature results of the constructed models were compared according to age. In the trunk, the skin temperature in the 4-50s was lower than that in the 2-30s, and the rest in the 4-50s was about 0.2-0.5℃ higher. And it was confirmed that skin temperature changes according to change of body fat percentage.
References
[1] Arens E, Zhang H, Huizenga C. 2006 Journal of Thermal Biology 31 60-6
[2] Melikov A, Pitchurov G, Naydenov K, Langkilde G. 2005 Indoor Air 15 205-14
[3] Zhang H, Huizenga C, Arens E, Yu T. 2001 Journal of Thermal Biology 26 401-408
[4] Zhou X, Lian Z, Lan L. 2013 Building and Environment 70 257-265
[5] Gagge AP, Stolwijk JAJ, Saltin B. 1967 Environmental Research 1 1-20
[6] Stolwijk J.A.J., 1971 NASA CR-1855
[7] Tanabe SI, Kobayashi K, Nakano J, Ozeki Y, & Konishi M, 2002 Energy and Buildings 34(6)
637-646
[8] Fiala D, Kevin JL, Stohrer M, 1999 Journal of applied physiology 87 1957-72
[9] National Anthropometric Survey of Korea 2010 Industry and Energy [10] Lee JY, 2005, Seoul National University
[11] Du bois D, Du bois EF, 1989 Nutrition 5 300-311
[12] US EPA, 1997, Office of Research and development., 600 95
[13] deDear, R.J., Arens, E., Hui, Z., & Oguro, M. 1997 International Journal of Biometeorology 40