R E S E A R C H A R T I C L E
Open Access
Association between change in lifestyle
and cognitive functions among elderly
Koreans: findings from the Korean
longitudinal study of aging (2006
–2016)
Hyeon Ji Lee
1,2, Jieun Jang
2,3, Dong-Woo Choi
1,2, Wonjeong Chae
1,2, Eun-Cheol Park
2,4and Sung-In Jang
2,4*Abstract
Background: South Korea is an aged society that continues to age rapidly. Therefore, the purpose of this study was to investigate the association between changes in lifestyle and cognitive functions in the South Korean elderly using a nationally representative survey.
Methods: We analyzed data from the Korean Longitudinal Study of Aging (KLoSA) 2006–2016, a biannual panel survey. Multiple linear regression analysis was performed with repeated measurements data to examine the association between lifestyle change and cognitive functions over 2 years. Lifestyle combined the scores of four factors (smoking status, alcohol drinking status, body weight, and exercise), and then categorized them into four groups (Good→Good, Bad→Good, Good→Bad, and Bad→Bad) according to the two-year change. Cognitive functions were set according to the scores measured through the Korean Mini-Mental State Examination (K-MMSE). Results: Among females, the K-MMSE score was the highest in the Bad→Good group compared to the reference group, Bad→Bad (β = 0.914; SD = 3.744; p < .0001). The next highest scores were in the Good→Good group (β = 0.813; SD = 4.654; p = 0.0005) and the Good→Bad group (β = 0.475; SD = 4.542; p = 0.0481). Among males, only the K-MMSE of the Good→Good group was statistically significant (β = 0.509; SD = 3.245; p = 0.0077). The results of subgroup analysis showed that the K-MMSE scores of females who did not participate in any social activities were more affected by their lifestyle (Good-Good:β = 1.614; SD = 4.270; p = 0.0017, Bad-Good: β = 1.817; SD = 3.945; p < .0001). Subgroup analysis showed that females who started drinking more than a moderate amount of alcohol had lower K-MMSE scores (Good-Bad:β = − 2.636; SD = 2.915; p = 0.0011). Additionally, in both sexes, exercising, among the four lifestyle options, had a strong and significant association with higher K-MMSE scores.
Conclusions: Following a healthy lifestyle or improving an unhealthy lifestyle can help people prevent or slow down cognitive decline. Regularly engaging in an adequate amount of exercise can help the cognitive function of the elderly. Females, specifically, can experience positive effects on their cognitive function if they participate in social activities while maintaining healthy lifestyles, in particular not drinking too much alcohol.
Keywords: Aging, Cognitive function, Elderly people, Health behavior, Lifestyle
© The Author(s). 2020 Open Access This article is licensed under a Creative Commons Attribution 4.0 International License, which permits use, sharing, adaptation, distribution and reproduction in any medium or format, as long as you give appropriate credit to the original author(s) and the source, provide a link to the Creative Commons licence, and indicate if changes were made. The images or other third party material in this article are included in the article's Creative Commons licence, unless indicated otherwise in a credit line to the material. If material is not included in the article's Creative Commons licence and your intended use is not permitted by statutory regulation or exceeds the permitted use, you will need to obtain permission directly from the copyright holder. To view a copy of this licence, visithttp://creativecommons.org/licenses/by/4.0/. The Creative Commons Public Domain Dedication waiver (http://creativecommons.org/publicdomain/zero/1.0/) applies to the data made available in this article, unless otherwise stated in a credit line to the data.
* Correspondence:[email protected] 2
Institute of Health Services Research, Yonsei University, 50 Yonsei-ro, Seodaemun-gu, Seoul 03722, Republic of Korea
4Department of Preventive Medicine, Yonsei University College of Medicine,
Seoul, Republic of Korea
Introduction
South Korea entered an “aged society” in 2018, when nearly 14.3% of its total population were over 65 years old [1]. It took 17 years to reach this status, having been designated an“aging society” in 2000. Although popula-tion aging is a problem that most countries are now fa-cing, as life expectancy increases [2], South Korea is currently showing the fastest aging trend of any country. In light of population aging, the concept of “healthy aging” has become increasingly important in South Korea. The World Health Organization (WHO) estab-lished “healthy aging” as the ideal aging direction for 2015–2030, and defined it as the maintenance of func-tional abilities in elderly adults to ensure their well-being through consideration of mental capacity, physical capacity, and environment [3].
Mental health is essential for healthy aging. One to the greatest threats to mental health in elderly adults is de-mentia or a decrease in cognitive function. In January 2018, about 50 million people had dementia worldwide [4], and this population is estimated to swell to around 152 million by 2050 [5]. In South Korea, around 702,436 elderly people had dementia in 2017 (9.94% of the total elderly population), with an annual disease burden of about 20.74 million won (1 US dollar = 1123 Korean won) [6]. This population is expected to increase expo-nentially, reaching 1 million by 2024 and over 2 million by 2041. By 2040, the disease burden of dementia is esti-mated to be close to 78 trillion won [6].
Since cognitive decline is mainly irreversible, it is im-portant to prevent its onset, or at least slow its pace [7,8]. The major causes of cognitive decline leading to dementia include heredity, family history of dementia, brain trauma, disability, and lifestyle. Among these, lifestyle is relatively easy to modify, and fundamental at the same time [9]. Therefore, many researchers have explored the relation-ship between lifestyle changes and cognitive function. For instance, lifestyle factors such as sleep, smoking, alcohol drinking, body weight, nutrition status, and exercise all in-fluence cognitive function or dementia [10–16]. Smoking, alcohol drinking, unhealthy body weight, and physical in-activity are also predictive factors of healthy aging among the elderly [10–12], and are highly likely to co-occur within an individual [13]. One study even combined these factors to express a“lifestyle risk score,” and examined its relationship with activities of daily living (ADLs) and in-strumental ADL (IADLs) [17]. They found that lifestyle changes do influence physical disability, which is known to be related to cognitive function in the elderly [18]. One systematic review article reported the association between sedentary behavior and cognitive function [19], and sug-gested proper sedentary time and regular exercise to im-prove cognitive function. However, the study did not include South Korean data.
Therefore, our study aimed to examine the association between lifestyle changes and cognitive functions using data representing the South Korean elderly. In this study, we interpreted the changes in lifestyle risk scores [17] as changes in lifestyle. We also focused on identify-ing which lifestyle factors have the strongest association with cognitive function among elderly adults.
Methods
Data collection and participants
We obtained data for this longitudinal study from the first (2006) to sixth (2016) waves of the Korean Longitu-dinal Study of Aging (KLoSA). The KLoSA is a nation-ally representative panel survey conducted biennination-ally through computer-assisted personal interviewing (CAPI). The survey targets community-dwelling adults aged 45 years or older living in 15 large administrative areas in South Korea. The survey target was randomly selected using a multistage and stratified sampling method by sorting survey districts stratified by region and residen-tial type in order of administrative code. The KLoSA survey includes topics that are considered to affect eco-nomic and social activities of middle-old/aged people. The topic consists of seven categories: demographics, family, health, employment, income, assets, and subject-ive expectations and satisfaction. The first wave of the KLoSA (2006) included 10,254 participants, and the sec-ond wave of the survey (in 2008) included 8688 of par-ticipants from the first wave (84.7% of the primary panel). The third wave of the survey (in 2010) included 7920 (77.2%) participants, and the fourth wave of the survey (in 2012) included only 7486 of participants from the first wave (73.0%). Hence, 920 people were added to the fifth survey in 2014. A total of 7949 people (among them 7029 people were original panel) were surveyed in the fifth wave, and 7490 (6618 people were original panel) in the sixth wave (2016). In this study, we used the first to sixth wave of the original panel data for ana-lysis. Detailed information about the survey is available on the panel survey organization website (https://survey. keis.or.kr/eng/klosa/klosa01.jsp).
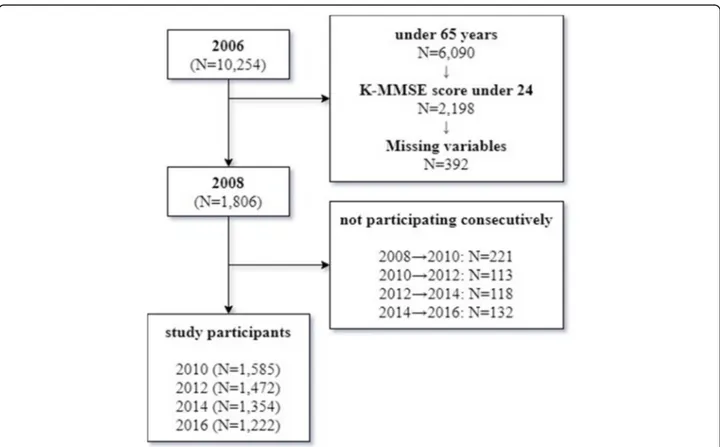
We excluded 6090 participants under 65 years in age from the first wave to ensure that we analyzed only indi-viduals 65 years or older (n = 4164). Additionally, we ex-cluded participants with cognitive impairment (Korean Mini-Mental State Examination [K-MMSE] score under 24) at the first wave (n = 2198). We also excluded partic-ipants who did not complete the questions on the inde-pendent variables of interest (e.g., socioeconomic status, social activity participation, and health-related variables) or the dependent variable (K-MMSE). To analyze changes in variables over time, we excluded participants who did not participate in more than two follow-up sur-veys. Ultimately, 1806 people were analyzed in 2008,
1585 in 2010, 1472 in 2012, 1354 in 2014, and 1222 in 2016 (Fig.1).
Cognitive function
The dependent variable was cognitive function as assessed via the K-MMSE [20]. The K-MMSE assesses time orien-tation, spatial orienorien-tation, memory registration, attention and calculation, memory recall, language, and space-time functions by trained interviewers. It has a total score of 30, with higher scores indicating better cognitive function. Scores of less than 18, 18–24, and more than 24 are de-fined as dementia, mild cognitive impairment, and normal, respectively [21,22].
Changes in lifestyle risk score
The main independent variable was changes in lifestyle risk score [17]. Lifestyle risk score was calculated from participants’ smoking status, alcohol drink status, body weight, and exercise participation. We first calculated participants into risk and risk-free groups for each fac-tor: if they had smoked more than 100 cigarettes in their lifetime or were currently smoking [23], drank more
than three drinks a day or seven drinks or more per week for any type of alcohol [24], (e.g., soju, beer, wine, raw rice wine, whiskey), had a body mass index (BMI) of < 18.6 (underweight) or≥ 30 (overweight) [25], or en-gaged in less than 150 min of exercise per week [26], they were placed in the risk group. Otherwise, they were considered risk-free. A score of 1 was assigned to the risk group, and a score of 0 was assigned to the risk-free group. These scores were then summed to create the lifestyle risk score (range: 0–4). Since the mean lifestyle risk score was 1.2, we categorized the participants ac-cording to whether they had 1 point or not (0 point: good,≥1: bad). Finally, to examine cognitive function ac-cording to lifestyle changes, we classified the participants according to their pattern of changes in lifestyle factors over two years, as follows: Good→Good, Good→Bad, Bad→Good, or Bad→Bad.
Covariates
Socioeconomic status and health-related variables known to be associated with lower cognitive function were set as covariates. Socioeconomic status variables included age,
Fig. 1 Flow chart of study participants. We excluded 6090 participants under 65 years in age from the first wave to ensure that we analyzed only individuals 65 years or older (n = 4164). Additionally, we excluded participants with cognitive impairment (Korean Mini-Mental State Examination [K-MMSE] score under 24) at the first wave (n = 2198). We also excluded participants who did not complete the questions on the independent variables of interest (e.g., socioeconomic status, social activity participation, and health-related variables) or the dependent variable (K-MMSE). To analyze changes in variables over time, we excluded participants who did not participate in more than two follow-up surveys. Ultimately, 1806 people were analyzed in 2008, 1585 in 2010, 1472 in 2012, 1354 in 2014, and 1222 in 2016
economic activity participation, region, marital status, liv-ing arrangement, educational level, household income, and participation in social activities. Household income was grouped into quartiles for each survey year. Participation in social activities was categorized according to the number of social activities of the subjects. If the participants engaged in social activities related to religion, friendship, leisure, sport, service, or politics, they were categorized as“1” or “2+” ac-cording to the number of activities they participated in; otherwise, they were categorized as“0.” Health-related vari-ables included the presence of chronic disease, depression, and disability status. Depression was classified as“yes” if par-ticipants scored 4 or higher on the 10-item Center for the Epidemiological Studies of Depression Short Form (CES-D10) and“no” otherwise. The disability status was measured by ADL and IADL. ADL includes 7 items that are required to live an independent life, and IADL includes 10 items re-lated to social functions. If there is any difficulty rere-lated to an item 1 point is given for each item. Disability status was di-vided into nondisabled (both ADLs and IADLs had a score of 0), mild (ADL has a score of 0 and IADL had a score of 1 or more), and severe (both ADLs and IADLs had scores of 1 or more) [17]. To take into account the dependent variable (K-MMSE scores) from the previous survey, the lagged dependent variable was included as a covariate.
Statistical analysis
Using the t-test and analysis of variance (ANOVA), we ex-amined the differences in average K-MMSE scores accord-ing to the independent variables at the first time point. Multiple linear regression analysis using the generalized estimating equation (GEE) model was performed with re-peated measurements data to examine the association be-tween lifestyle change and cognitive function over two years [27]. Each person was measured up to five times in total (2006→ 2008, 2008 → 2010, 2010 → 2012, 2012 → 2014, 2014→ 2016). We used the SAS procedure PRCO GENMOD to analyze repeated measurements. This ana-lysis yielded beta coefficient and their standard errors (SE), along with the P-value. P-value < 0.05 was consid-ered significant. We also tested for multicollinearity in the statistic model. The variance inflation factor (VIFs) were all less than 10, indicating no excessive correlations be-tween the independent variables in the statistical model. In addition, post-hoc analysis was performed using the Bonferroni correction method to identify multiple com-parisons bias. All statistical analyses were performed using SAS statistical software package version 9.4 (SAS Institute Inc., Cary, NC, USA).
Results
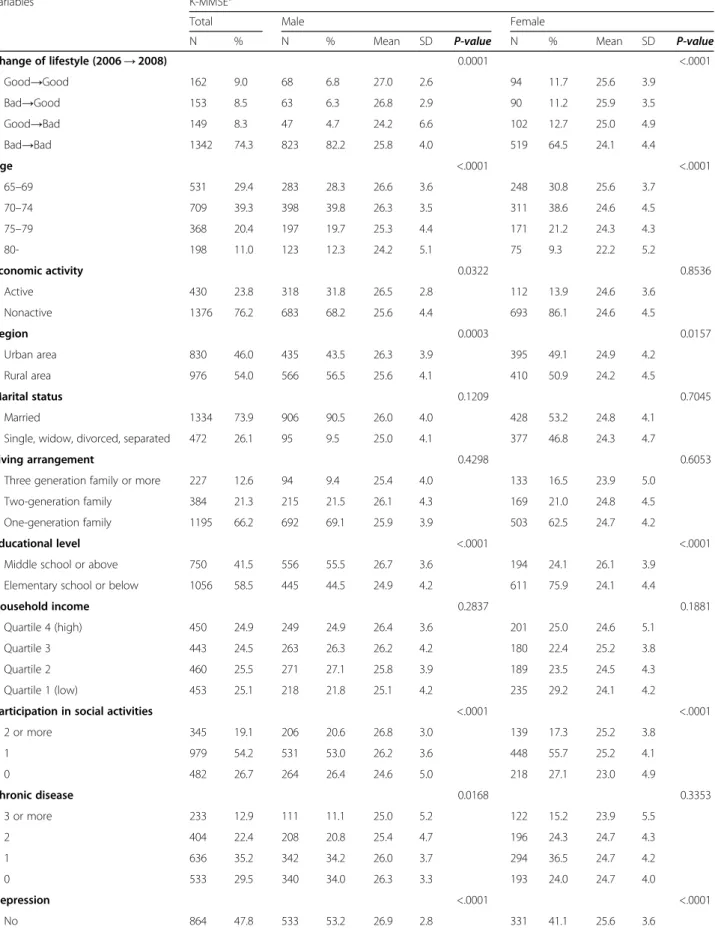
Table 1 shows the general characteristics of the study population at the first time point (2006→ 2008). In addition, the interesting and independent variables were
expressed as mean values through the dependent vari-ables K-MMSE score. Among males, the K-MMSE score was highest for the Good→Good group (n = 68), at 27.0 (SD = 2.6); especially, the lowest was found for the Good→Bad group (n = 47), at 24.2 (SD = 6.6). Among fe-males, the Bad→Good group (n = 90) had the highest K-MMSE score, at 25.9 (SD = 3.5), while the Bad→Bad group (which was also the largest group, n = 519) had the lowest score, at 24.1 (SD = 4.4). Additionally, both males and females did not differ in their cognitive func-tion scores according to their living areas in urban areas and rural areas (Male: Mean = 26.3; SD = 3.9. Mean = 25.6; SD = 4.1, Female: Mean = 24.9; SD = 4.2, Mean = 24.2; SD = 4.5, respectively) (Table1).
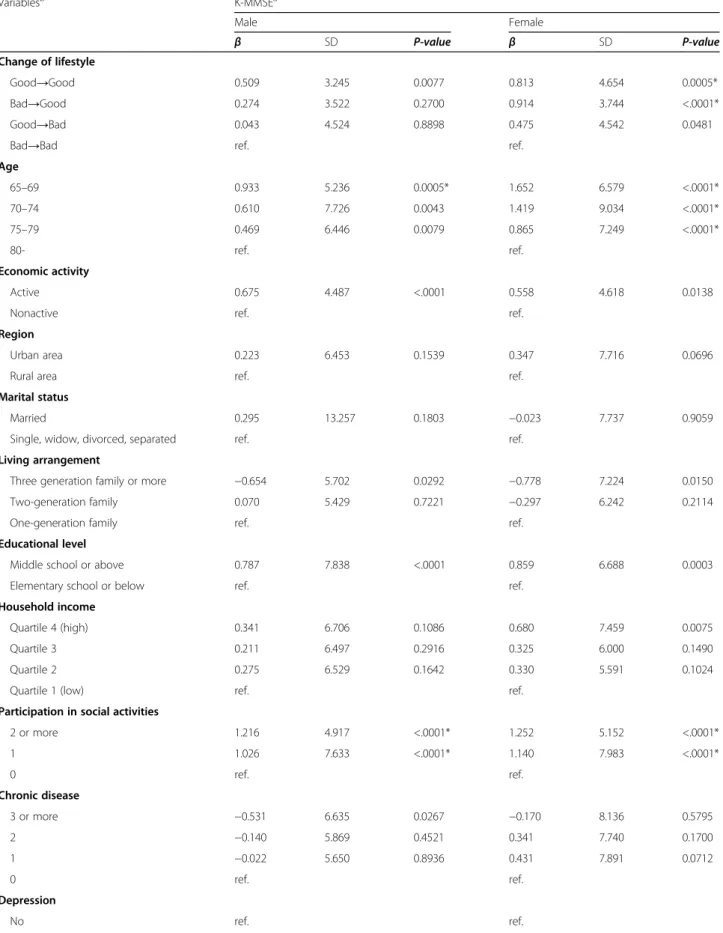
Table 2 shows the relationship between lifestyle changes and cognitive functions that were repeatedly measured in two-year units from 2006 to 2016 as beta coefficients. All analyses were performed while adjusting for covariates. The reference group was the Bad→Bad group. Both males and females showed higher beta coeffi-cients for the other groups than for the reference group. Among males, the Bad→Good and Good→Bad groups had higher beta coefficients compared to the reference group, albeit not significantly (β = 0.274, SD = 3.522, p = 0.2700; β = 0.043, SD = 4.524, p = 0.8898, respectively). The Good→Good group, however, had a significantly higher beta coefficient than the reference group (β = 0.509; SD = 3.245; p = 0.0077). Among females, all of the groups had significantly higher beta coefficients than the reference: Good→Good (β = 0.813, SD = 4.654, p = 0.0005), Bad→-Good (β = 0.914; SD = 3.744; p < .0001), and Bad→-Good→Bad (β = 0.475, SD = 4.542, p = 0.0481). The Bad→Good group had the highest beta coefficient. Post-hoc analysis showed that, the Good→Good group of males and the Good→Bad group of females were not significant (Table2).
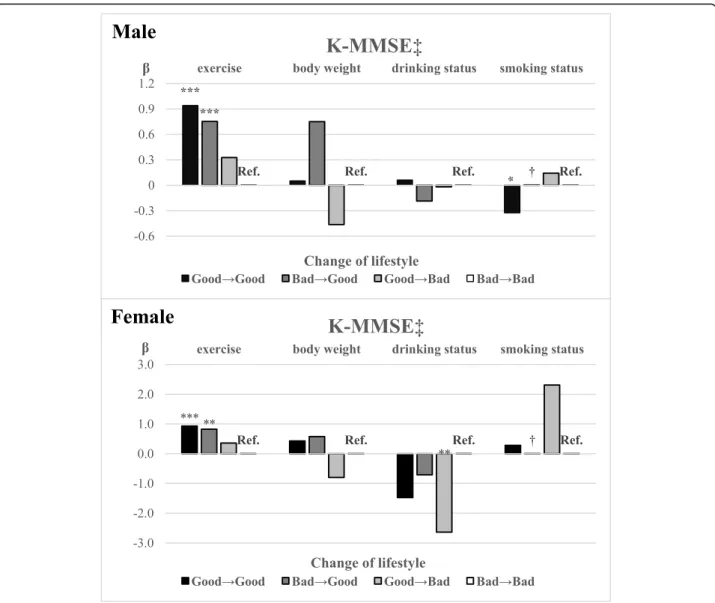
Figure2 shows the results of the subgroup analysis of the four lifestyle factors (i.e., exercise, body weight, alco-hol drinking status, and smoking status). In both males and females, exercise was significantly associated with cognitive function: the Good→Good group had the highest beta coefficient compared to the reference group (Bad→Bad) (β = 0.941; SD = 4.786; p < .0001, β = 0.930; SD = 4.638; p < .0001, respectively), followed by the Bad→Good group (β = 0.753; SD = 4.190; p < .0001, β = 0.824; SD = 3.931; p = 0.0001, respectively) and Good→-Bad group (β = 0.328; SD = 4.910; p = 0.1145, β = 0.360; SD = 4.663;p = 0.1282, respectively). No significant result was found for body weight. In females, for alcohol drink-ing status, the Good→Bad group had a significantly lower beta coefficient than did the reference group (β = − 2.636; SD = 2.915; p = 0.0011). For smoking status, there were no significant results for females. However, for males, the Good→ Good group had a significantly lower beta coefficient than did the reference group (β =
Table 1 General characteristics of the study population
Variables K-MMSEa
Total Male Female
N % N % Mean SD P-value N % Mean SD P-value
Change of lifestyle (2006→ 2008) 0.0001 <.0001 Good→Good 162 9.0 68 6.8 27.0 2.6 94 11.7 25.6 3.9 Bad→Good 153 8.5 63 6.3 26.8 2.9 90 11.2 25.9 3.5 Good→Bad 149 8.3 47 4.7 24.2 6.6 102 12.7 25.0 4.9 Bad→Bad 1342 74.3 823 82.2 25.8 4.0 519 64.5 24.1 4.4 Age <.0001 <.0001 65–69 531 29.4 283 28.3 26.6 3.6 248 30.8 25.6 3.7 70–74 709 39.3 398 39.8 26.3 3.5 311 38.6 24.6 4.5 75–79 368 20.4 197 19.7 25.3 4.4 171 21.2 24.3 4.3 80- 198 11.0 123 12.3 24.2 5.1 75 9.3 22.2 5.2 Economic activity 0.0322 0.8536 Active 430 23.8 318 31.8 26.5 2.8 112 13.9 24.6 3.6 Nonactive 1376 76.2 683 68.2 25.6 4.4 693 86.1 24.6 4.5 Region 0.0003 0.0157 Urban area 830 46.0 435 43.5 26.3 3.9 395 49.1 24.9 4.2 Rural area 976 54.0 566 56.5 25.6 4.1 410 50.9 24.2 4.5 Marital status 0.1209 0.7045 Married 1334 73.9 906 90.5 26.0 4.0 428 53.2 24.8 4.1
Single, widow, divorced, separated 472 26.1 95 9.5 25.0 4.1 377 46.8 24.3 4.7
Living arrangement 0.4298 0.6053
Three generation family or more 227 12.6 94 9.4 25.4 4.0 133 16.5 23.9 5.0
Two-generation family 384 21.3 215 21.5 26.1 4.3 169 21.0 24.8 4.5
One-generation family 1195 66.2 692 69.1 25.9 3.9 503 62.5 24.7 4.2
Educational level <.0001 <.0001
Middle school or above 750 41.5 556 55.5 26.7 3.6 194 24.1 26.1 3.9
Elementary school or below 1056 58.5 445 44.5 24.9 4.2 611 75.9 24.1 4.4
Household income 0.2837 0.1881
Quartile 4 (high) 450 24.9 249 24.9 26.4 3.6 201 25.0 24.6 5.1
Quartile 3 443 24.5 263 26.3 26.2 4.2 180 22.4 25.2 3.8
Quartile 2 460 25.5 271 27.1 25.8 3.9 189 23.5 24.5 4.3
Quartile 1 (low) 453 25.1 218 21.8 25.1 4.2 235 29.2 24.1 4.2
Participation in social activities <.0001 <.0001
2 or more 345 19.1 206 20.6 26.8 3.0 139 17.3 25.2 3.8 1 979 54.2 531 53.0 26.2 3.6 448 55.7 25.2 4.1 0 482 26.7 264 26.4 24.6 5.0 218 27.1 23.0 4.9 Chronic disease 0.0168 0.3353 3 or more 233 12.9 111 11.1 25.0 5.2 122 15.2 23.9 5.5 2 404 22.4 208 20.8 25.4 4.7 196 24.3 24.7 4.3 1 636 35.2 342 34.2 26.0 3.7 294 36.5 24.7 4.2 0 533 29.5 340 34.0 26.3 3.3 193 24.0 24.7 4.0 Depression <.0001 <.0001 No 864 47.8 533 53.2 26.9 2.8 331 41.1 25.6 3.6
− 0.325; SD = 6.292; p = 0.0385). We could not obtain the results for the Bad→Good group in either sex, as no participant in this group had changes in smoking status (Fig. 2). The post-hoc analysis showed that all results were of the same significance, except for the significance of smoking status changes in males. According to changes in smoking status, the Good→Good group of males was not statistically significant according to the Bonferroni correction (Supplementary Table1).
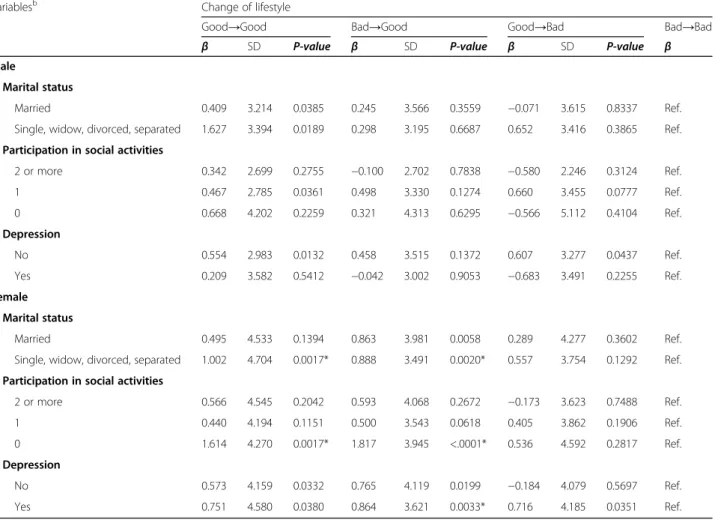
Table 3 shows the results of subgroups analysis for marital status, participation in social activities, and de-pression. The subgroup analysis by marital status showed that in both males and females, there was a tendency for a higher beta coefficient among single, widow, divorced, or separated participants compared to married participants. A subgroup analysis of participation in social activities for females showed that they had the highest beta coefficients from Bad→Good groups in all classes of this variable. In particular, females who did not participate in any social activities tended to have higher beta coefficients compared to females who participated (Good→Good: β = 1.614; SD = 4.270; p = 0.0017, Bad→Good: β = 1.817; SD = 3.945; p < .0001, Good→Bad: β = 0.536; SD = 4.592; p = 0.2817). Finally, regarding the subgroup analysis of depression, males without depression tended to have a higher beta co-efficient compared to males who had depression. On the other hand, females who had depression tended to have a higher beta coefficient compared to females without de-pression (Table3).
Discussion
We examined the association between lifestyle changes and cognitive functions in South Korean elderly adults. When looking at cognitive function according to the changes in lifestyle over two years, as described in litera-ture, we also found that participants who maintained a healthy lifestyle had significantly higher cognitive func-tion compared to those with continually unhealthy life-style. Females showed a stronger association between
lifestyle changes and cognitive functions compared to males. Especially, the females whose lifestyle improved (Bad→Good) for two years had the highest cognitive func-tion compared to those with a continually unhealthy life-style over the same period, and the worsened (Good→Bad) group tended to have higher cognitive function compared to those with continually unhealthy lifestyle.
Although cognitive deterioration and dementia are not the same terms, deterioration of cognitive function is an essential factor in the diagnosis of dementia [28], and one of the most common measurement tools for assessing cognitive function is the MMSE [20,21]. The dependency variables of our study were the K-MMSE scores, and they were calculated as a beta coefficient through analysis. Therefore, if the beta was positive, the MMSE score was high; and if it was negative, it could be interpreted as low. In other words, if the beta was negative, the cognitive function could be relatively low, and this may also be con-sidered relatively more likely to cause dementia.
Previous studies have also found a relationship between multiple health-behavior factors and cognitive functions [14–16]. One cross-sectional study examined smoking, body weight, and exercise among US individuals aged 60 years or older, and found that cognitive function was the highest among those with all of the following factors: non-smoking, normal body weight, and sufficient exercise [14]. In particular, cognitive function was statistically signifi-cantly higher in those who engaged in sufficient amount of exercise. Other studies, including a nested case-control study of Japanese-American men [15] and a retrospective cohort study of European aged 60 years or over [16], in-vestigated the association of lifestyle and genetic risk fac-tors (ε4 allele of the apolipoprotein E gene) with the incidence of dementia. The former included smoking, diet, BMI and exercise as lifestyle factors, and the latter in-cluded smoking, exercise, diet, and drinking as lifestyle factors. These studies found that healthy lifestyle can re-duce the risk of dementia. Our study differentiates itself from these studies in that it confirmed the association
Table 1 General characteristics of the study population (Continued)
Variables K-MMSEa
Total Male Female
N % N % Mean SD P-value N % Mean SD P-value
Yes 942 52.2 468 46.8 24.8 4.8 474 58.9 23.9 4.8
Disability status <.0001 0.0001
Disabled 251 13.9 180 18.0 24.1 6.0 71 8.8 22.2 6.2
Nondisabled 1555 86.1 821 82.0 26.3 3.3 734 91.2 24.8 4.1
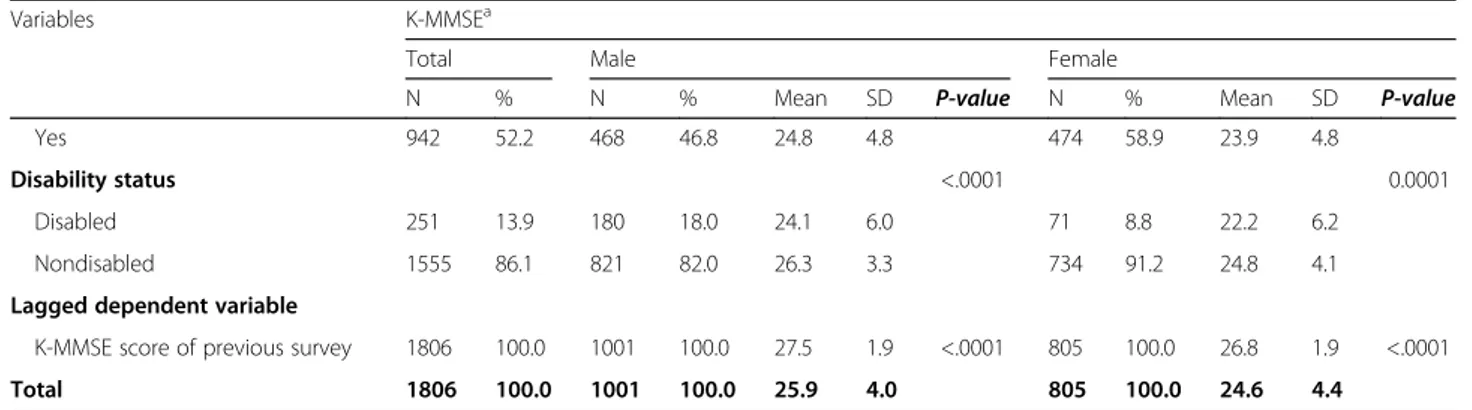
Lagged dependent variable
K-MMSE score of previous survey 1806 100.0 1001 100.0 27.5 1.9 <.0001 805 100.0 26.8 1.9 <.0001
Total 1806 100.0 1001 100.0 25.9 4.0 805 100.0 24.6 4.4
a
Cognitive function was measured using the K-MMSE
Table 2 Generalized linear model using GEE with cognitive function in 2006–2016 Variablesb K-MMSEa Male Female β SD P-value β SD P-value Change of lifestyle Good→Good 0.509 3.245 0.0077 0.813 4.654 0.0005* Bad→Good 0.274 3.522 0.2700 0.914 3.744 <.0001* Good→Bad 0.043 4.524 0.8898 0.475 4.542 0.0481
Bad→Bad ref. ref.
Age 65–69 0.933 5.236 0.0005* 1.652 6.579 <.0001* 70–74 0.610 7.726 0.0043 1.419 9.034 <.0001* 75–79 0.469 6.446 0.0079 0.865 7.249 <.0001* 80- ref. ref. Economic activity Active 0.675 4.487 <.0001 0.558 4.618 0.0138
Nonactive ref. ref.
Region
Urban area 0.223 6.453 0.1539 0.347 7.716 0.0696
Rural area ref. ref.
Marital status
Married 0.295 13.257 0.1803 −0.023 7.737 0.9059
Single, widow, divorced, separated ref. ref.
Living arrangement
Three generation family or more −0.654 5.702 0.0292 −0.778 7.224 0.0150
Two-generation family 0.070 5.429 0.7221 −0.297 6.242 0.2114
One-generation family ref. ref.
Educational level
Middle school or above 0.787 7.838 <.0001 0.859 6.688 0.0003
Elementary school or below ref. ref.
Household income
Quartile 4 (high) 0.341 6.706 0.1086 0.680 7.459 0.0075
Quartile 3 0.211 6.497 0.2916 0.325 6.000 0.1490
Quartile 2 0.275 6.529 0.1642 0.330 5.591 0.1024
Quartile 1 (low) ref. ref.
Participation in social activities
2 or more 1.216 4.917 <.0001* 1.252 5.152 <.0001* 1 1.026 7.633 <.0001* 1.140 7.983 <.0001* 0 ref. ref. Chronic disease 3 or more −0.531 6.635 0.0267 −0.170 8.136 0.5795 2 −0.140 5.869 0.4521 0.341 7.740 0.1700 1 −0.022 5.650 0.8936 0.431 7.891 0.0712 0 ref. ref. Depression No ref. ref.
between changes in each lifestyle factor and cognitive function.
Our subgroup analysis revealed that exercise had the strongest association with cognitive function. To improve health, the WHO recommends that people aged 65 years and older engage in physical activities for more than 150 min a week [26]. In this study, exercise was included as one of the lifestyle factors, and the criteria for healthy exercise were set at more than 150 min per week, according to the WHO recommendation. Our findings support this recommenda-tion and add evidence that proper amounts of regular exer-cise can help improve the cognitive functions of the elderly. In addition, our results support those of previous studies which showed that individuals engaging in little exercise or are inactive [29, 30] are particularly at risk of deteriorating cognitive function, and reaffirms the importance of steady exercise among elderly adults [19,31,32]. Findings from our study can be explained by mechanisms of the effect of exer-cise on the brain. During exerexer-cise, brain blood flow increases [33], and changes in neurotransmitters and neurotrophins occur [34]. In addition, new neurons in the hippocampus, a part of the brain that is related to learning and memory for-mation, are also increased [34].
Previous studies have shown that moderate amounts of alcohol can help cognitive function [35, 36]. Our study set one of the unhealthy lifestyles to drinking more than an appropriate amount of alcohol, and analysis re-sults showed that cognitive functions were only low in women, and not in men who started drinking more than the appropriate amount of alcohol. These results were in line with those of previous studies [37,38].
We also confirmed another modifiable, individual-level protective factor for cognitive function by sex: participa-tion in social activities. This associaparticipa-tion was stronger for females than for males. Past studies have explained the relationship between social activities and cognitive func-tion as follows. Social activity can increase the brain vol-ume and improve global cognition; and is associated with memory, executive functioning, processing speed, and visuospatial perception [39]. Some previous studies also have shown that participation in social activities can prevent the decline in cognitive functions [40, 41], as demonstrated in our study.
Improving health is important for helping elderly adults extend their healthy lives. Our study may be meaningful in terms of public health, as it situates the power to motivate healthy behavior and proposes a way to prevent deterioration of cognitive function in the elderly. If the findings of this study can be used to mediate the cognitive function of the Korean elderly and achieve positive results to relieve the bur-den of an aged society, it can serve as a good ex-ample for other countries around the world, many of which are also becoming an aging society. It is neces-sary to confirm the causal relationship and effect of the intervention on cognitive function through further studies. Another strength of this study is that it used a nationwide data representing the elderly population in South Korea (i.e., the KLoSA), and we analyzed the data by sex. Furthermore, the data were longitudinal, which allowed us to analyze the impact of time on the other variables.
Table 2 Generalized linear model using GEE with cognitive function in 2006–2016 (Continued)
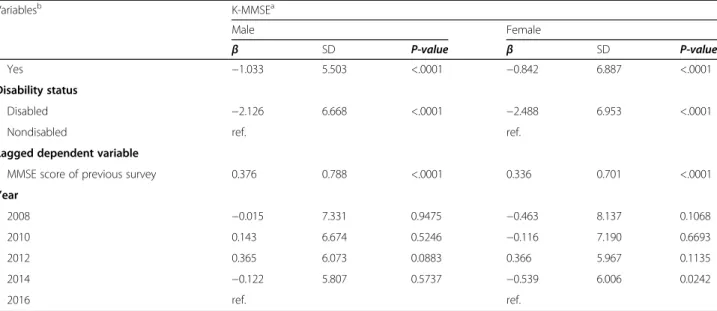
Variablesb K-MMSEa Male Female β SD P-value β SD P-value Yes −1.033 5.503 <.0001 −0.842 6.887 <.0001 Disability status Disabled −2.126 6.668 <.0001 −2.488 6.953 <.0001
Nondisabled ref. ref.
Lagged dependent variable
MMSE score of previous survey 0.376 0.788 <.0001 0.336 0.701 <.0001
Year 2008 −0.015 7.331 0.9475 −0.463 8.137 0.1068 2010 0.143 6.674 0.5246 −0.116 7.190 0.6693 2012 0.365 6.073 0.0883 0.366 5.967 0.1135 2014 −0.122 5.807 0.5737 −0.539 6.006 0.0242 2016 ref. ref.
*SignificantP-value after Bonferroni correction a
Cognitive function was measured using the K-MMSE b
Age, economic status, region, marital status, living arrangement, educational level, household income, participation in social activities, chronic disease, depressive symptoms, disability status, and survey year were adjusted
This study also had some limitations. First, although various efforts were made by the Korea Employment In-formation Service, a panel survey organization, to minimize bias (e.g., by educating survey investigators), they could not rule out response bias or recall bias, which might have influenced our results. In addition, the K-MMSE surveyed in this data is limited in that it does not reflect the educational level and age of the survey participants [20,21]. Therefore, we tried to take this into consideration by adjusting the educational level and age of study subjects as covariates. Second, while we con-firmed the association between the variables, we did not
confirm whether the relationship was causal. Since this study was an observational study, its results cannot be interpreted as a causal relationship. Nevertheless, we do offer more accurate associations compared to cross-sectional studies, due to our use of panel data. Third, we likely omitted other relevant lifestyle factors for cognitive function. Still, we believe that our attempt to explore which lifestyle factor had the strongest association of-fered meaningful data. Finally, the subgroup analysis of smoking status should be carefully interpreted. Among males, while the results in the main analysis of the Good→Good group were significant and low, post-hoc
Fig. 2 Results of subgroup analysis of the four lifestyle factors by sex. The results show the association between lifestyle change and cognitive function over two years. Statistically significant, *p < .05 ** < .01 *** < .0001.†The frequency is zero and cannot be calculated. ‡Cognitive function was measured using the K-MMSE. K-MMSE = Korean Mini-Mental State Examination (score of 0–30). The following variables were included as covariates in every lifestyle analysis: age, economic activity status, region, marital status, living arrangement, educational level, household income, participation in social activities, chronic disease, depression, disability status, survey year; and the four lifestyles were added as covariates to each other’s analysis (exercise: body weight, drinking status, and smoking status was added as covariates; body weight: exercise, drinking status, and smoking status was added as covariates; drinking status: exercise, body weight, smoking status; smoking status: exercise, body weight, drinking status was added as covariates)
analysis results were not statistically significant. Add-itionally, in both males and females, there were no par-ticipants who were classified as Bad→Good; therefore, our results for that group could not be calculated. More-over, since South Korean women are more likely to show a response bias in their answers to smoking status questions [42], it is necessary to be careful in interpret-ing the results.
Conclusions
We can conclude that continuing to follow a healthy lifestyle or improving one’s unhealthy lifestyle could help prevent or slow down cognitive decline. Regularly en-gaging in a proper amount of exercise can help the cog-nitive function of the elderly. In particular, females can experience positive effects on their cognitive function if they participate in social activities while maintaining healthy lifestyles, such as not drinking too much alcohol.
Supplementary information
Supplementary information accompanies this paper athttps://doi.org/10. 1186/s12877-020-01693-7.
Additional file 1 Table S1. Generalized linear model through GEE analysis with cognitive function by lifestyle factors in 2008–2016.
Abbreviations
KLoSA:Korean Longitudinal Study of Aging; WHO: World Health Organization; ADLs: Activities of daily living; IADLs: Instrumental ADL; CAPI: Computer-assisted personal interviewing; K-MMSE: Korean Mini-Mental State Examination; BMI: Body mass index; CES-D10: 10-item Center for the Epidemiological Studies of Depression Short Form; ANOVA: Analysis of variance; GEE: Generalized estimating equation; SE: Standard errors; VIFs: Variance inflation factor
Acknowledgments
We would like to acknowledgment the Korea Employment Information Service (KEIS) for conducting the Korean Longitudinal Study of Aging (KLoSA), which was the primary source of our study.
Table 3 Subgroup analysis using GEE of cognitive functionawith lifestyle change in 2006–2016
Variablesb Change of lifestyle
Good→Good Bad→Good Good→Bad Bad→Bad
β SD P-value β SD P-value β SD P-value β
Male
Marital status
Married 0.409 3.214 0.0385 0.245 3.566 0.3559 −0.071 3.615 0.8337 Ref.
Single, widow, divorced, separated 1.627 3.394 0.0189 0.298 3.195 0.6687 0.652 3.416 0.3865 Ref.
Participation in social activities
2 or more 0.342 2.699 0.2755 −0.100 2.702 0.7838 −0.580 2.246 0.3124 Ref. 1 0.467 2.785 0.0361 0.498 3.330 0.1274 0.660 3.455 0.0777 Ref. 0 0.668 4.202 0.2259 0.321 4.313 0.6295 −0.566 5.112 0.4104 Ref. Depression No 0.554 2.983 0.0132 0.458 3.515 0.1372 0.607 3.277 0.0437 Ref. Yes 0.209 3.582 0.5412 −0.042 3.002 0.9053 −0.683 3.491 0.2255 Ref. Female Marital status Married 0.495 4.533 0.1394 0.863 3.981 0.0058 0.289 4.277 0.3602 Ref.
Single, widow, divorced, separated 1.002 4.704 0.0017* 0.888 3.491 0.0020* 0.557 3.754 0.1292 Ref. Participation in social activities
2 or more 0.566 4.545 0.2042 0.593 4.068 0.2672 −0.173 3.623 0.7488 Ref. 1 0.440 4.194 0.1151 0.500 3.543 0.0618 0.405 3.862 0.1906 Ref. 0 1.614 4.270 0.0017* 1.817 3.945 <.0001* 0.536 4.592 0.2817 Ref. Depression No 0.573 4.159 0.0332 0.765 4.119 0.0199 −0.184 4.079 0.5697 Ref. Yes 0.751 4.580 0.0380 0.864 3.621 0.0033* 0.716 4.185 0.0351 Ref.
*SignificantP-value after Bonferroni correction a
Cognitive function was measured using the K-MMSE b
Age, economic status, region, marital status, living arrangement, educational level, household income, participation in social activities, chronic disease, depressive symptoms, disability status, and survey year were adjusted
Authors’ contributions
HJL and WC were involved in designing the study. HJL, DWC, and JJ contributed to the analysis and manuscript. ECP and SIJ reviewed the study overall and performed significant editing of the manuscript. The authors have read and approved the final manuscript.
Funding
This study was supported by a faculty research grant of Yonsei University College of Medicine (6–2018-0174 and 6–2017-0157). The funders had no role in study design, data collection and analysis, decision to publish, or preparation of the manuscript.
Availability of data and materials
Data used in this study are available at:https://survey.keis.or.kr/eng/klosa/ databoard/List.jsp
Ethics approval and consent to participate
The KLoSA study was approved by the National Statistical Office (Approval number: 33602) and was conducted after acquiring verbal consent of participants in the study. Since the KLoSA database has been released to the public for scientific use, ethical approval was not required for the study. Consent for publication
There are no details of individual participants in the manuscript. Competing interests
The authors have no competing interests to declare. Author details
1Department of Public Health, Graduate School, Yonsei University, Seoul,
Republic of Korea.2Institute of Health Services Research, Yonsei University, 50
Yonsei-ro, Seodaemun-gu, Seoul 03722, Republic of Korea.3Department of
Preventive Medicine and Public Health, Ajou University College of Medicine, Suwon, Republic of Korea.4Department of Preventive Medicine, Yonsei
University College of Medicine, Seoul, Republic of Korea. Received: 7 October 2019 Accepted: 10 August 2020
References
1. 2017 Population and Household Census [http://kosis.kr/statisticsList/ statisticsListIndex.do?menuId=M_01_01&vwcd=MT_ZTITLE&parmTabId=M_ 01_01#SelectStatsBoxDiv]. Accessed 5 Oct 2019.
2. Pigott CA. World Population Ageing, 1950-2050. No. 207. United Nations Publications; 2002.
3. What is Healthy Ageing? [http://www.who.int/ageing/healthy-ageing/en/]. Accessed 5 Oct 2019.
4. World Health Organization. Towards a dementia plan: a WHO guide; 2018. 5. Dementia: number of people affected to triple in next 30 years. [http://
www.who.int/news-room/detail/07-12-2017-dementia-number-of-people-affected-to-triple-in-next-30-years]. Accessed 5 Oct 2019.
6. National Institute of Dementia. National Institute of dementia annual report 2017. Seongnam: National Institute of Dementia; 2018. p. 01.
7. Tom SE, Hubbard RA, Crane PK, Haneuse SJ, Bowen J, McCormick WC, et al. Characterization of dementia and Alzheimer’s disease in an older population: updated incidence and life expectancy with and without dementia. Am J Public Health. 2015;105(2):408–13.
8. Livingston G, Sommerlad A, Orgeta V, Costafreda SG, Huntley J, Ames D, et al. Dementia prevention, intervention, and care. Lancet. 2017;390(10113): 2673–734.
9. Srisuwan P. Primary prevention of dementia: focus on modifiable risk factors. J Med Assoc Thailand= Chotmaihet thangphaet. 2013;96(2):251–8. 10. Hubert HB, Bloch DA, Oehlert JW, Fries JF. Lifestyle habits and compression
of morbidity. J Gerontol Ser A Biol Med Sci. 2002;57(6):M347–51.
11. Fine LJ, Philogene GS, Gramling R, Coups EJ, Sinha S. Prevalence of multiple chronic disease risk factors: 2001 National Health Interview Survey. Am J Prev Med. 2004;27(2):18–24.
12. Peel NM, McClure RJ, Bartlett HP. Behavioral determinants of healthy aging. Am J Prev Med. 2005;28(3):298–304.
13. Pronk NP, Anderson LH, Crain AL, Martinson BC, O'connor PJ, Sherwood NE, et al. Meeting recommendations for multiple healthy lifestyle factors:
prevalence, clustering, and predictors among adolescent, adult, and senior health plan members. Am J Prev Med. 2004;27(2):25–33.
14. Edwards PD, Edwards MK, Joyner C, Crush E. Multiple health characteristics on cognitive function in older adults. J Behav Health. 2018;7(3):47–53. 15. Gelber RP, Petrovitch H, Masaki KH, Abbott RD, Ross GW, Launer LJ, et al.
Lifestyle and the risk of dementia in Japanese-American men. J Am Geriatr Soc. 2012;60(1):118–23.
16. Lourida I, Hannon E, Littlejohns TJ, Langa KM, Hyppönen E, Kuźma E, et al. Association of lifestyle and genetic risk with incidence of dementia. Jama. 2019;322(5):430–7.
17. Lee Y, Kim J, Back JH, Kim S, Ryu M. Changes in combined lifestyle risks and disability transition in older adults: Korean longitudinal study of aging, 2006–2008. Prev Med. 2013;56(2):124–9.
18. Barberger GP, Fabrigoule C. Disability and cognitive impairment in the elderly. Disabil Rehabil. 1997;19(5):175–93.
19. Falck RS, Davis JC, Liu-Ambrose T. What is the association between sedentary behaviour and cognitive function? A systematic review. Br J Sports Med. 2017;51(10):800–11.
20. Kang Y, Na DL, Hahn S. A validity study on the Korean mini-mental state examination (K-MMSE) in dementia patients. J Korean Neurol Assoc. 1997;15(2):300. 21. Oh E, Kang Y, Shin J, Yeon B. A validity study of K-MMSE as a screening test
for dementia: comparison against a comprehensive neuropsychological evaluation. Dement Neurocognitive Disord. 2010;9(1):8–12.
22. Folstein MF, Folstein SE, PR MH.“Mini-mental state”: a practical method for grading the cognitive state of patients for the clinician. J Psychiatr Res. 1975;12(3):189–98.
23. US Department of Health Human Services. The health consequences of smoking: a report of the surgeon general. Washington, D.C.: US Department of Health and Human Services, Centers for Disease Control and Prevention, National Center for Chronic Disease Prevention and Health Promotion, Office on Smoking and Health; 2004.
24. National Institute on Alcohol Abuse and Alcoholism. Rethinking drinking: alcohol and your hHealth. Bethesda: National Institutes of Health; 2010. 25. WHO Expert Consultation. Appropriate body-mass index for Asian
populations and its implications for policy and intervention strategies. Lancet (London, England). 2004;363(9403):157.
26. World Health Organization. Global recommendations on physical activity for health; 2010.
27. Liang KY, Zeger SL. Longitudinal data analysis using generalized linear models. Biometrika. 1986;73(1):13–22.
28. Association AP. Diagnostic and statistical manual of mental disorders (DSM-5®): American Psychiatric Pub; 2013.
29. Netz Y, Argov E, Inbar O. Fitness’s moderation of the facilitative effect of acute exercise on cognitive flexibility in older women. J Aging Phys Act. 2009;17(2):154–66.
30. Ojofeitimi E, Ijadunola K, Jegede V, Freeman Y, Owolabi O, Freeman A, et al. Nutritional status and physical activity in relation to cognitive function in a group of elderly in Nigeria. J Nutr Elder. 2002;22(1):49–62.
31. Yaffe K, Barnes D, Nevitt M, Lui LY, Covinsky K. A prospective study of physical activity and cognitive decline in elderly women: women who walk. Arch Intern Med. 2001;161(14):1703–8.
32. Tanigawa T, Takechi H, Arai H, Yamada M, Nishiguchi S, Aoyama T. Effect of physical activity on memory function in older adults with mild a lzheimer's disease and mild cognitive impairment. Geriatr Gerontol Int. 2014;14(4):758–62. 33. Barnes JN. Exercise, cognitive function, and aging. Adv Physiol Educ. 2015;
39(2):55–62.
34. van Praag H. Exercise and the brain: something to chew on. Trends Neurosci. 2009;32(5):283–90.
35. Stampfer MJ, Kang JH, Chen J, Cherry R, Grodstein F. Effects of moderate alcohol consumption on cognitive function in women. N Engl J Med. 2005; 352(3):245–53.
36. Anstey KJ, Mack HA, Cherbuin N. Alcohol consumption as a risk factor for dementia and cognitive decline: meta-analysis of prospective studies. Am J Geriatr Psychiatry. 2009;17(7):542–55.
37. Sullivan EV, Fama R, Rosenbloom MJ, Pfefferbaum A. A profile of neuropsychological deficits in alcoholic women. Neuropsychology. 2002; 16(1):74.
38. Nolen-Hoeksema S. Gender differences in risk factors and consequences for alcohol use and problems. Clin Psychol Rev. 2004;24(8):981–1010. 39. Kelly ME, Duff H, Kelly S, Power JEM, Brennan S, Lawlor BA, et al. The impact
the cognitive functioning of healthy older adults: a systematic review. Syst Rev. 2017;6(1):259.
40. Choi Y, Park S, Cho KH, Chun SY, Park EC. A change in social activity affect cognitive function in middle-aged and older Koreans: analysis of a Korean longitudinal study on aging (2006–2012). Int J Geriatr Psychiatry. 2016;31(8):912–9. 41. Bosma H, Boxtel MPJ, Ponds R, Jelicic M, Houx P, Metsemakers J, et al. Engaged
lifestyle and cognitive function in middle and old-aged, non-demented persons: a reciprocal association? Z Gerontol Geriatr. 2002;35(6):575–81. 42. Kang HG, Kwon KH, Lee IW, Jung B, Park EC, Jang SI. Biochemically-verified
smoking rate trends and factors associated with inaccurate self-reporting of smoking habits in Korean women. Asian Pac J Cancer Prev. 2013;14(11):6807–12.
Publisher’s Note
Springer Nature remains neutral with regard to jurisdictional claims in published maps and institutional affiliations.