ABSTRACT
Background: Evaluation of mortality and prevalence trends is important for health planning and priority decision-making in health policy. This study was performed to examine disease-specific mortality and prevalence trends for diseases in Korea from 2002 to 2015.
Methods: In this study, 206 mutually exclusive diseases and injuries were classified into 21 cause clusters, which were divided into three cause groups: 1) communicable, maternal, neonatal, and nutritional conditions; 2) non-communicable diseases (NCDs); and 3) injuries. Cause specific trends for age-standardized mortality and prevalence rates were analyzed by the joinpoint regression method.
Results: Between 2002 and 2015, the age-standardized mortality declined to about 177 per 100,000 population, while the age-standardized prevalence rate increased to approximately 68,065 per 100,000 population. Among the 21 cause clusters, most of the disease
mortality rates showed decreasing trends. However, neurological disorders, self-harm, and interpersonal violence included periods during which the mortality rates increased in 2002–2015. In addition, the trends for prevalence rates of human immunodeficiency virus infection and acquired immune deficiency syndrome, tuberculosis, transport injuries, and self-harm, and interpersonal violence differed from the overall prevalence rates. The annual percent change in prevalence rates for transport injuries increased during 2004–2007, and then decreased. The self-harm and interpersonal violence prevalence rates decreased from 2004 to 2014.
Conclusion: Between 2002 and 2015, overall decreasing trends in the mortality rate and increasing trends in the prevalence rate were observed for all causes in Korea. Especially, NCDs represented an important part of the increasing trends in Korea. For clusters of diseases with unusual trends, proper management must be considered.
Keywords: Mortality; Prevalence; Trend; Joinpoint Analysis; Republic of Korea
INTRODUCTION
Mortality and prevalence are important measures of the health status of the human population.1 They are influenced by social, economic, and cultural factors as well as by
the social groups to which an individual belongs.2,3 Identifying a country's mortality
Original Article
Received: Jul 4, 2019
Accepted: Dec 11, 2019
Address for Correspondence:
Hyesook Park, MD, PhD
Department of Preventive Medicine, College of Medicine, Ewha Womans University, 25 Magokdong-ro 2-gil, Gangseo-gu, Seoul 07804, Korea.
E-mail: [email protected]
© 2020 The Korean Academy of Medical Sciences.
This is an Open Access article distributed under the terms of the Creative Commons Attribution Non-Commercial License (https:// creativecommons.org/licenses/by-nc/4.0/) which permits unrestricted non-commercial use, distribution, and reproduction in any medium, provided the original work is properly cited. ORCID iDs Yoonhee Shin https://orcid.org/0000-0002-9950-9362 Bomi Park https://orcid.org/0000-0001-5834-9975 Hye Ah Lee https://orcid.org/0000-0002-4051-0350 Bohyun Park https://orcid.org/0000-0002-8538-9662 Hyejin Han https://orcid.org/0000-0002-1669-3177 Eun Jeong Choi
https://orcid.org/0000-0002-7698-3424 Nam-eun Kim
https://orcid.org/0000-0002-8826-7644 Hyesook Park
https://orcid.org/0000-0002-9359-6522
Yoonhee Shin ,1 Bomi Park ,1,2 Hye Ah Lee ,3 Bohyun Park ,1 Hyejin Han ,1 Eun Jeong Choi ,1 Nam-eun Kim ,1 and Hyesook Park 1
1Department of Preventive Medicine, College of Medicine, Ewha Womans University, Seoul, Korea 2National Cancer Control Institute, National Cancer Center, Goyang, Korea
3Clinical Trial Center, Mokdong Hospital, Ewha Womans University, Seoul, Korea
Disease-Specific Mortality and
Prevalence Trends in Korea, 2002–2015
Funding
This research was supported by a grant from the Korean Health Technology R&D Project, Ministry of Health & Welfare, Republic of Korea (study No. HI13C0729 & HI18C0446).
Disclosure
The authors have no potential conflicts of interest to disclose.
Author Contributions
Conceptualization: Shin Y, Park B,1 Park H.
Data curation: Park B,1 Han H, Choi EJ, Kim NE,
Shin Y. Formal analysis: Han H, Choi EJ, Kim NE, Shin Y, Park B.1 Methodology: Shin Y, Park
B,1 Lee HA, Park H. Validation: Park B,2 Lee HA.
Park H. Writing - original draft: Shin Y. Writing - review & editing: Shin Y, Park B,2 Park H. Park
B,1 Park Bomi; Park B,2 Park Bohyun.
and prevalence trends can help to understand the health level of its population, disease characteristics of the country, and predict future situations.
This is especially important for Korea as it is a country that has shown a rapid change in demographic characteristics, with an increasing proportion of people with chronic diseases resulting in increases in the burden of disease and in life expectancy. These rapid changes may have been influenced by social and economic changes in Korea. Therefore, it is necessary to evaluate the long-term mortality and prevalence trends in Korea to build a long-term health plan, make priority decisions in health policies, and find adjustable factors that may contribute to the trends.
Previous studies regarding mortality and prevalence have dealt with mortality and prevalence rates for specific diseases in a particular year or analyzed mortality and prevalence rates separately. Therefore, it was difficult to know the overall disease-related trends in Korea based on these previous studies.4-6
METHODS
Data sources
To estimate the national representative prevalence rates of selected diseases, we used the Korea Central Cancer Registry (KCCR) for cancer, Korea National Hospital Discharge Injury Surveillance data for injuries, and National Health Insurance Service (NHIS) claims data for other diseases. To estimate the mortality rates for selected diseases, we used the Cause of Death Statistics from Statistics Korea. Because the National Hospital Discharge Injury Surveillance data are available from 2004, the injury prevalence rate was estimated for the period 2004–2014, and the mortality rate was estimated for the period 2002–2015. The mid-year population reported by the National Statistical Office for each mid-year was used to calculate the prevalence and mortality rates. To compare the prevalence and mortality rates, we calculated the age-adjusted estimates based on data from the 2000 Census from the Korean National Statistical Office.
Case definition
In this study, 206 mutually exclusive diseases and injuries in Korea were classified into 21 cause clusters based on the 2015 Korean Burden of Disease study (KBD).6 These 21 cause
clusters were further divided into three broad cause groups: 1) communicable, maternal, neonatal, and nutritional conditions (CMNNs); 2) non-communicable diseases (NCDs); and 3) injuries. Detailed information on the definitions of cause of death and Korean standard classification of diseases were described in the 2015 KBD.6
The health insurance claim data are widely used as a source of estimates of disease prevalence, but the number of patients calculated from NHIS claims is affected by the disease-specific disease range and the prevalence criteria.7 Using the same criteria as the KBD and Injuries study
2015, we defined individuals with each disease as those who were hospitalized at least once or who had appointments in outpatient clinics 1–5 times, depending on the disease.6 Cancers were
defined according to ICD-10 codes derived from the KBD 2012 study's cause categories.8
The cause group for CMNNs was divided into seven cause clusters: 1) human
immunodeficiency virus infection and acquired immune deficiency syndrome (HIV/AIDS)
2/12
and tuberculosis; 2) diarrhea, lower respiratory infections, meningitis, and other common infectious diseases; 3) neglected tropical diseases and malaria; 4) maternal disorders; 5) neonatal disorders; 6) nutritional deficiencies; and 7) other communicable, maternal, neonatal, and nutritional disorders.
The NCD-cause group was divided into 10 cause clusters: 8) neoplasms; 9) cardiovascular and circulatory diseases; 10) chronic respiratory diseases; 11) cirrhosis of the liver; 12) digestive diseases except cirrhosis; 13) neurological disorders; 14) mental and behavioral disorders; 15) diabetes, urogenital, blood, and endocrine diseases; 16) musculoskeletal disorders; and 17) other NCDs.
The injury-cause group was divided into four cause clusters: 18) transport injuries; 19) unintentional injuries other than transport injuries; 20) self-harm and interpersonal violence; and 21) forces of nature, war, and legal interventions.
Statistical analysis
The mortality and prevalence rates were calculated based on the number of deaths, prevalence, and mid-year population in each year.
To estimate the mortality rates, the number of deaths was determined using the garbage code redistribution method9 for listed causes that could not have been the actual cause of death.
Using the modified algorithm for garbage code redistribution, when calculating the number and mortality of diseases has improved the accuracy of defining the cause of death and the validity of the causal attribution.10 To compare annual mortality rates from 2002 to 2015,
age-adjusted mortality rates were calculated using the 2000 Census from the Korean National Statistical Office (standard population). After calculating the crude mortality rates by age, the direct age-adjusted mortality rate was produced based on the standardized population. The crude prevalence rate was calculated by mid-year population in each year from 2002 to 2015, standardized against the 2000 Census from the Korean National Statistical Office. The detailed method for obtaining the cancer and injury prevalence rates used for the survey has been previous described.11,12
All-cause specific trends for age-standardized mortality and prevalence rates were analyzed by the joinpoint regression method13 using the Joinpoint Regression Program (version
4.5.0.1; Statistical Research and Applications Branch, National Cancer Institute, Bethesda, MD, USA). In joinpoint regression analysis, as the study period was relatively short for estimation, the maximum number of join points was set to 1. The degree of change during the period is presented as the annual percentage change (APC) rate over a specific period.
Ethics statement
This study was approved by the Korea University Institutional Review Board (KU-IRB-18-EX-51-A-1), and the requirement for informed consent was waived.
RESULTS
Overall, between 2002 and 2015, the age-standardized mortality rates for all causes decreased from 477.27 to 299.80, and the average annual change (AAPC) was −3.5% (95% confidence
interval [CI], −3.8 to −3.3) for the entire period. Joinpoint analysis showed that the APC during the period 2007–2015 (APC, −3.2%; 95% CI, −3.5 to −2.9) was significantly different (P < 0.05) from the APC during the period 2002–2007 (APC, −4.0%; 95% CI, −4.6 to −3.4). The age-standardized prevalence rates for all causes increased from 77,421.48 to 145,487.30 (AAPC, 5.9%; 95% CI, 4.1 to 7.8). Joinpoint analysis indicated that the APC increased significantly during the period 2002–2009 (APC, 10.2; 95% CI, 7.5 to 13.0), and the increase has slowed somewhat since 2009 (Table 1).
The causes of diseases were divided into three categories, i.e., CMNNs, NCDs, and injuries. The decreases in mortality rates were unaffected by changes in all three categories from 2002 to 2015. The differences in mortality decline were not significant in the three categories from 2002 to 2015, while increases in prevalence rates (AAPC, 5.9%) were affected by increases in the prevalence of NCDs (AAPC, 8.9%; 95% CI, 6.9 to 10.9) compared to CMNNs (AAPC, 3.0%; 95% CI, −2.5 to −0.4) and injuries (AAPC, 2.2%; 95% CI, 1.2 to 3.3) (Table 1).
Fig. 1 shows the proportion of deaths from diseases and the distribution of patient numbers
by three broad causal categories: NCDs, CMNNs, and injuries. NCDs continuously showed the highest number of deaths among the three categories from 2002 to 2015 (Fig. 1), even
4/12
https://jkms.org https://doi.org/10.3346/jkms.2020.35.e27
Table 1. Trends in age-standardized mortality and prevalence rates for all causes in Korea according to joinpoint analyses, 2002–2015 (per 100,000 population)
Variables Joinpoint analyses: 2002–2015
2002 2015 Average APC
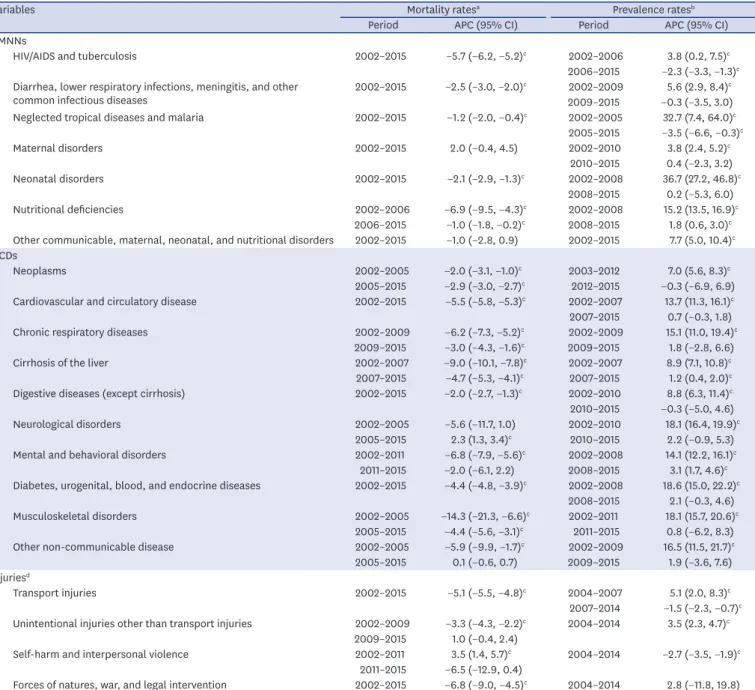
(95% CI) Period Trend 1APC (95% CI) Period Trend 2APC (95% CI) All causes Mortality ratesa 477.27 299.80 −3.5 (−3.8, −3.3)c 2002–2007 −4.0 (−4.6, −3.4)c 2007–2015 −3.2 (−3.5, −2.9)c Prevalence ratesb 77,421.48 145,487.30 5.9 (4.1, 7.8)c 2002–2009 10.2 (7.5, 13.0)c 2009–2015 1.1 (−2.0, 4.4) CMNNs Mortality rates 22.74 13.98 −3.4 (−3.8, −3.0)c 2002–2015 −3.4 (−3.8, −3.0)c - -Prevalence rates 46,585.48 61,623.99 3.0 (1.2, 4.9)c 2002–2009 5.8 (3.1, 8.6)c 2009–2015 −0.2 (−3.4, 3.1) NCDs Mortality rates 392.32 233.86 −3.9 (−4.1, −3.7)c 2002–2009 −4.5 (−4.8, −4.2)c 2009–2015 −3.3 (−3.6, −2.9)c Prevalence rates 30,836.00 83,863.31 8.9 (6.9, 10.9)c 2002–2009 14.7 (11.7, 17.8)c 2009–2015 2.4 (−1.0, 5.9) Injuries Mortality rates 62.21 51.96 −1.5 (−2.5, −0.4)c 2002–2011 −0.4 (−1.4, 0.5) 2011–2015 −3.8 (−7.0, −0.6)c Prevalence rates 1,373.02 (2004) 1,710.20 (2014) 2.2 (1.2, 3.3)c 2004–2006 8.2 (2.0, 14.7)c 2006–2014 0.8 (0.2, 1.5)c
APC = annual percent change, CI = confidence interval, CMNN = communicable, maternal, neonatal & nutritional disorders, NCD = non-communicable disease.
aAge-standardized mortality rates adjusted to the 2000 Census in Korea; bAge-standardized prevalence rates adjusted to the 2000 Census in Korea; cP < 0.05.
100 0 40 Year Per centag e of de aths, % 80 20 60 2002 2003 2004 2005 2006 2007 2008 2009 2010 2011 2012 2013 2014 2015 82.20 78.00 100 0 40 Year Per centag e of patients, % 80 20 60 2002 2003 2004 2005 2006 2007 2008 2009 2010 2011 2012 2013 2014 2015 39.83 57.64 60.17 42.36 NCDs CMNNs Injuries
Fig. 1. Proportion of deaths from diseases and distribution of the patient numbers by three broad causal categories: CMNNs, NCDs, injuries, 2002–2015. CMNN = communicable, maternal, neonatal & nutritional disorders, NCD = non-communicable disease.
as the patient numbers clearly changed in 2015 compared to 2002. In 2002, CMNNs showed the highest number of patient cases (60.17%), and NCDs showed the lowest, at 39.83%. However, in 2015, NCDs had the greatest number of patients (57.64%) (Fig. 1).
Mortality rates
The trends in mortality rates for CMNNs decreased (AAPC, −3.4%; 95% CI, −3.8 to −3.0) during the period 2002–2015 except for maternal disorders. The mortality rate of maternal disorders increased slightly in this period, but the APC of maternal disorders was not significant (Table 1 and Fig. 2).
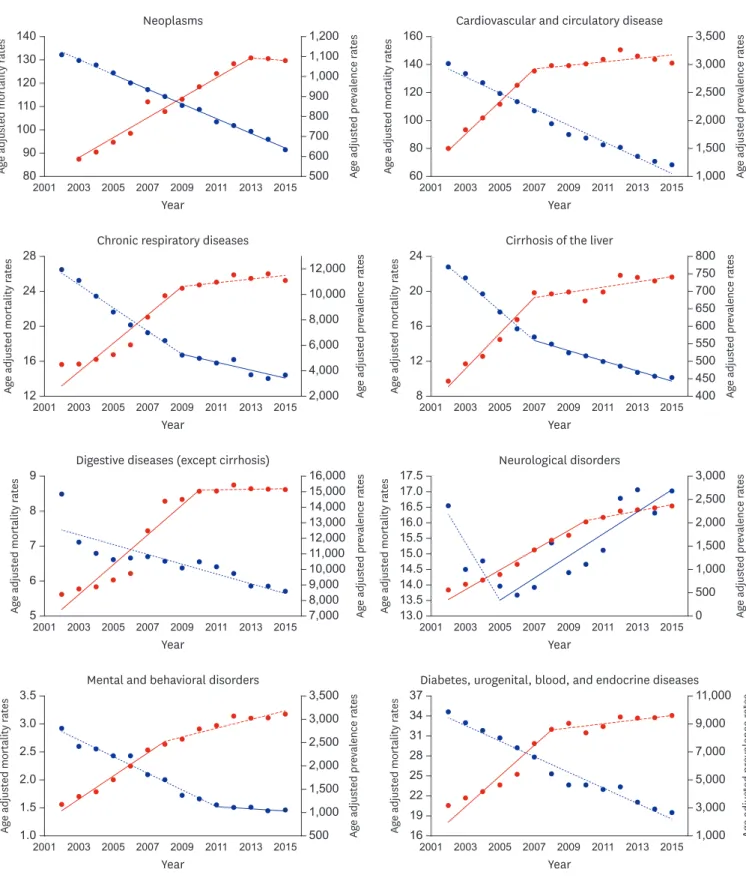
In addition, the NCD mortality rate decreased (AAPC, −3.9%; 95% CI, −4.1 to −3.7) continuously throughout the study period, and the APC shifted from −4.5% (95% CI, −4.8 to −4.2) during the period 2002–2009 to −3.3% (95% CI, −3.6 to −2.9) during the period 2009–2015 (Table 1). The mortality rate of neurological disorders decreased during the period 2002–2005 (APC, −5.6%; 95% CI, −11.7 to 1.0) and then increased during the period 2005–2015 (APC, 2.3%; 95% CI, 1.3 to 3.4) (Table 2 and Fig. 3).
The mortality rate for injuries decreased from 62.21 to 51.96 (AAPC, −1.5%; 95% CI, −2.5 to −0.4) (Table 1), and the APC was significant during the period 2011–2015 (APC, −3.8%; 95% CI, −7.0 to −0.6). Mortality rates for unintentional injuries other than transport injuries decreased during the period 2002–2009 (APC, −3.3%; 95% CI, −4.3 to −2.2), and increased during the period 2009–2015 (APC, 1.0%; 95% CI, −0.4 to 2.4). However, there was no meaningful change after this period. In addition, the rates of self-harm and interpersonal violence increased during the period 2002–2011 (APC, 3.5%; 95% CI, 1.4 to 5.7) and then decreased during the period 2011–2015 (APC, −6.5%; 95% CI, −12.9 to 0.4) (Table 2 and Fig. 4).
Prevalence rates
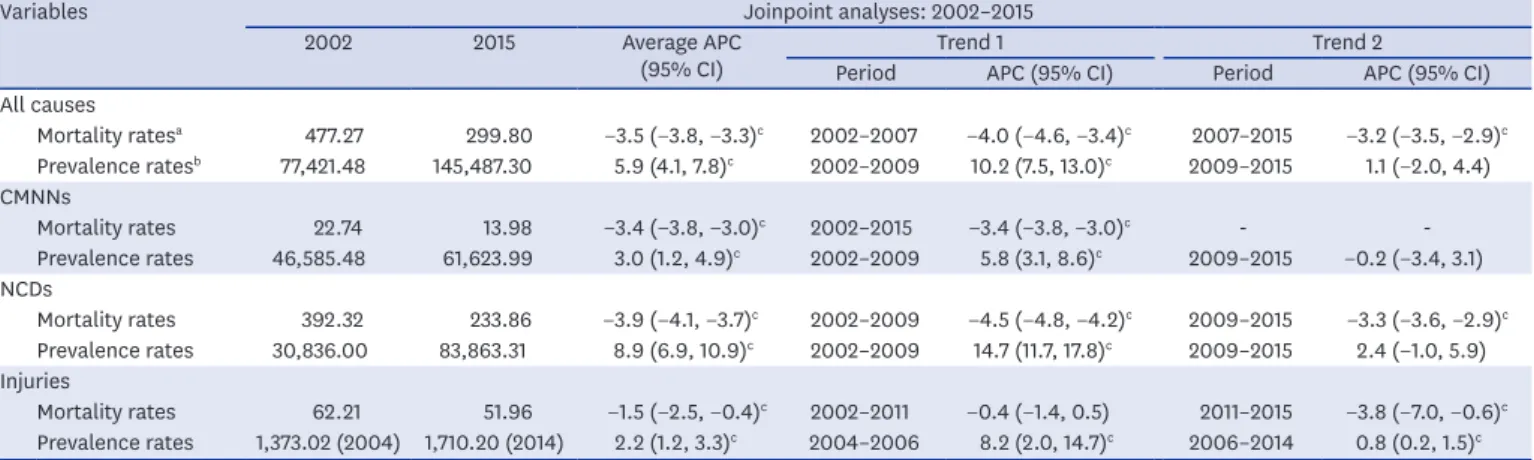
The prevalence rates for CMNNs increased during the period 2002–2009 (APC, 5.8%; 95% CI, 3.1 to 8.6) and then decreased during the period 2009 – 2015 (APC, −0.2%; 95% CI, −3.4 to 3.1) (Table 1). For HIV/AIDS and tuberculosis, the prevalence rate increased by 3.8% (95% CI, 0.2 to 7.5) during the initial period (2002–2006), but decreased continuously during the period 2006–2015 (APC, −2.3%; 95% CI, −3.3 to −1.3). The prevalence rates of neglected tropical diseases and malaria increased during the period 2002–2005 (APC, 32.7%; 95% CI, 7.4 to 64.0) and then decreased during the period 2005–2015 (APC, −3.5%; 95% CI, −6.6 to −0.3). However, this was unusual because of the large 95% CI (7.4 to 64.0), and further observations are therefore needed (Table 2 and Fig. 2).
All cause clusters in NCD prevalence rates increased during the study period (AAPC, 8.9%; 95% CI, 6.9 to 10.9). The APC during the period 2002–2009 (APC, 14.7%; 95% CI, 11.7 to 17.8) was significantly increased. In addition, the APC was slightly increased during the period 2009–2015 (APC, 2.4%; 95% CI, −1.0 to 5.9) (Table 1). The proportion of patients due to CMNNs continued to decrease, from 60.17% in 2002 to 42.36% in 2015, whereas the proportion of patients due to NCDs increased from 39.83% in 2002 to 57.64% in 2015 (Fig. 1). The prevalence rates for injuries increased during the period from 2004 to 2014 (AAPC, 2.2%; 95% CI, 1.2 to 3.3). The APC during the period 2004–2006 (APC, 8.2%; 95% CI, 2.0 to 14.7) was significantly different (P < 0.05) from the APC during the period 2006–2014 (APC, 0.8%; 95% CI, 0.2 to 1.5) (Table 1 and Fig. 1). The rates for transport injuries increased significantly during the period 2004–2007 (APC, 5.1%; 95% CI, 2.0 to 8.3), but decreased during the
6/12 https://jkms.org https://doi.org/10.3346/jkms.2020.35.e27 9 3 6 Year Ag e adjust ed mortality r at es Ag e adjust ed pr eval ence r at es 8 5 7 155 105 125 145 115 135 2001 2003 2005 2007 2009 2011 2013 2015
HIV AIDS and tuberculosis
4 10 5 7 Year Ag e adjust ed mortality r at es Ag e adjust ed pr eval ence r at es 9 6 8 70,000 30,000 40,000 60,000 50,000 2001 2003 2005 2007 2009 2011 2013 2015
Diarrhea, lower respiratory infections, meningitis, and other common infectious diseases
0.40 0.25 Year Ag e adjust ed mortality r at es Ag e adjust ed pr eval ence r at es 0.35 0.30 45 10 30 40 20 35 2001 2003 2005 2007 2009 2011 2013 2015
Neglected tropical diseases and malaria
25 15 0.30 0.10 0.15 Year Ag e adjust ed mortality r at es Ag e adjust ed pr eval ence r at es 0.25 0.20 1,700 1,000 1,300 1,500 1,200 1,400 2001 2003 2005 2007 2009 2011 2013 2015 Maternal disorders 1,100 1,600 3.4 2.0 2.6 Year Ag e adjust ed mortality r at es Ag e adjust ed pr eval ence r at es 3.2 2.4 2.8 500 0 100 400 200 2001 2003 2005 2007 2009 2011 2013 2015 Neonatal disorders 3.0 2.2 300 1.0 0.6 0.7 Year Ag e adjust ed mortality r at es Ag e adjust ed pr eval ence r at es 0.9 0.8 400 100 250 350 150 300 2001 2003 2005 2007 2009 2011 2013 2015 Nutritional deficiencies 200 1.2 0.6 0.9 Year Ag e adjust ed mortality r at es Ag e adjust ed pr eval ence r at es 1.1 0.8 1.0 3,000 500 1,000 2,000 1,500 2001 2003 2005 2007 2009 2011 2013 2015
Other communicable, maternal, neonatal, and nutritional disorders
0.7
2,500
Fig. 2. Age-standardized mortality and prevalence rate for communicable, maternal, neonatal & nutritional disorders in Korea, 2002–2015. HIV/AIDS = human immunodeficiency virus infection and acquired immune deficiency syndrome.
period 2007–2014 (APC, −1.5%; 95% CI, −2.3 to −0.7). The prevalence rates for self-harm and interpersonal violence decreased continuously throughout the period 2004–2014 (APC, −2.7%; 95% CI, −3.5 to −1.9) (Table 2 and Fig. 4).
Table 2. Joinpoint analysis of age-standardized mortality and prevalence trends in Korea, 2002–2015
Variables Mortality ratesa Prevalence ratesb
Period APC (95% CI) Period APC (95% CI)
CMNNs
HIV/AIDS and tuberculosis 2002–2015 −5.7 (−6.2, −5.2)c 2002–2006 3.8 (0.2, 7.5)c
2006–2015 −2.3 (−3.3, −1.3)c
Diarrhea, lower respiratory infections, meningitis, and other
common infectious diseases 2002–2015 −2.5 (−3.0, −2.0)
c 2002–2009 5.6 (2.9, 8.4)c
2009–2015 −0.3 (−3.5, 3.0) Neglected tropical diseases and malaria 2002–2015 −1.2 (−2.0, −0.4)c 2002–2005 32.7 (7.4, 64.0)c
2005–2015 −3.5 (−6.6, −0.3)c Maternal disorders 2002–2015 2.0 (−0.4, 4.5) 2002–2010 3.8 (2.4, 5.2)c 2010–2015 0.4 (−2.3, 3.2) Neonatal disorders 2002–2015 −2.1 (−2.9, −1.3)c 2002–2008 36.7 (27.2, 46.8)c 2008–2015 0.2 (−5.3, 6.0) Nutritional deficiencies 2002–2006 −6.9 (−9.5, −4.3)c 2002–2008 15.2 (13.5, 16.9)c 2006–2015 −1.0 (−1.8, −0.2)c 2008–2015 1.8 (0.6, 3.0)c
Other communicable, maternal, neonatal, and nutritional disorders 2002–2015 −1.0 (−2.8, 0.9) 2002–2015 7.7 (5.0, 10.4)c
NCDs
Neoplasms 2002–2005 −2.0 (−3.1, −1.0)c 2003–2012 7.0 (5.6, 8.3)c
2005–2015 −2.9 (−3.0, −2.7)c 2012–2015 −0.3 (−6.9, 6.9)
Cardiovascular and circulatory disease 2002–2015 −5.5 (−5.8, −5.3)c 2002–2007 13.7 (11.3, 16.1)c
2007–2015 0.7 (−0.3, 1.8) Chronic respiratory diseases 2002–2009 −6.2 (−7.3, −5.2)c 2002–2009 15.1 (11.0, 19.4)c
2009–2015 −3.0 (−4.3, −1.6)c 2009–2015 1.8 (−2.8, 6.6)
Cirrhosis of the liver 2002–2007 −9.0 (−10.1, −7.8)c 2002–2007 8.9 (7.1, 10.8)c
2007–2015 −4.7 (−5.3, −4.1)c 2007–2015 1.2 (0.4, 2.0)c
Digestive diseases (except cirrhosis) 2002–2015 −2.0 (−2.7, −1.3)c 2002–2010 8.8 (6.3, 11.4)c
2010–2015 −0.3 (−5.0, 4.6)
Neurological disorders 2002–2005 −5.6 (−11.7, 1.0) 2002–2010 18.1 (16.4, 19.9)c
2005–2015 2.3 (1.3, 3.4)c 2010–2015 2.2 (−0.9, 5.3)
Mental and behavioral disorders 2002–2011 −6.8 (−7.9, −5.6)c 2002–2008 14.1 (12.2, 16.1)c
2011–2015 −2.0 (−6.1, 2.2) 2008–2015 3.1 (1.7, 4.6)c
Diabetes, urogenital, blood, and endocrine diseases 2002–2015 −4.4 (−4.8, −3.9)c 2002–2008 18.6 (15.0, 22.2)c
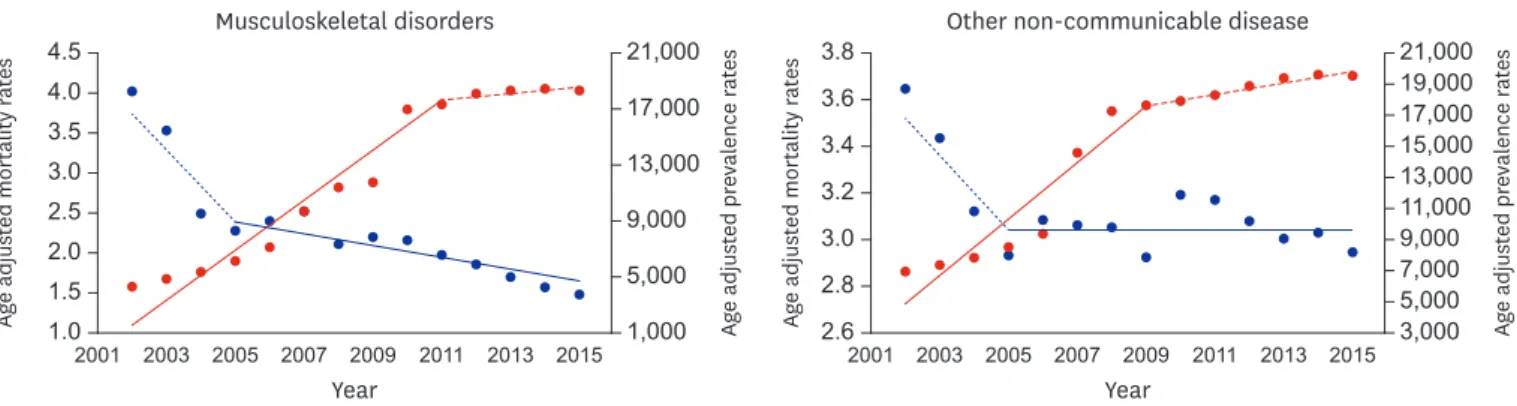
2008–2015 2.1 (−0.3, 4.6) Musculoskeletal disorders 2002–2005 −14.3 (−21.3, −6.6)c 2002–2011 18.1 (15.7, 20.6)c
2005–2015 −4.4 (−5.6, −3.1)c 2011–2015 0.8 (−6.2, 8.3)
Other non-communicable disease 2002–2005 −5.9 (−9.9, −1.7)c 2002–2009 16.5 (11.5, 21.7)c
2005–2015 0.1 (−0.6, 0.7) 2009–2015 1.9 (−3.6, 7.6) Injuriesd
Transport injuries 2002–2015 −5.1 (−5.5, −4.8)c 2004–2007 5.1 (2.0, 8.3)c
2007–2014 −1.5 (−2.3, −0.7)c
Unintentional injuries other than transport injuries 2002–2009 −3.3 (−4.3, −2.2)c 2004–2014 3.5 (2.3, 4.7)c
2009–2015 1.0 (−0.4, 2.4)
Self-harm and interpersonal violence 2002–2011 3.5 (1.4, 5.7)c 2004–2014 −2.7 (−3.5, −1.9)c
2011–2015 −6.5 (−12.9, 0.4)
Forces of natures, war, and legal intervention 2002–2015 −6.8 (−9.0, −4.5)c 2004–2014 2.8 (−11.8, 19.8)
APC = annual percent change, CI = confidence interval, CMNN = communicable, maternal, neonatal & nutritional disorders, HIV/AIDS = human immunodeficiency virus infection and acquired immune deficiency syndrome, NCD = non-communicable disease.
aAge-standardized mortality rates adjusted to the 2000 Census in Korea; bage-standardized prevalence rates adjusted to the 2000 Census in Korea; cP < 0.05; devaluated from 2004 to 2014.
8/12 https://jkms.org https://doi.org/10.3346/jkms.2020.35.e27 28 12 Year Ag e adjust ed mortality r at es Ag e adjust ed pr eval ence r at es 12,000 2,000 2001 2003 2005 2007 2009 2011 2013 2015
Chronic respiratory diseases 24 20 16 10,000 8,000 6,000 4,000 24 8 Year Ag e adjust ed mortality r at es Ag e adjust ed pr eval ence r at es 800 400 450 700 550 2001 2003 2005 2007 2009 2011 2013 2015
Cirrhosis of the liver 20 16 12 750 600 500 650 2015 2015 2003 2005 2007 2009 2011 2013 2003 2005 2007 2009 2011 2013 9 5 6 Year Ag e adjust ed mortality r at es Ag e adjust ed pr eval ence r at es 8 7 16,000 7,000 13,000 15,000 12,000 14,000 2001
Digestive diseases (except cirrhosis)
10,000 8,000 11,000 9,000 17.5 13.0 Year Ag e adjust ed mortality r at es Ag e adjust ed pr eval ence r at es 3,000 0 1,500 2,500 2,000 2001 Neurological disorders 17.0 16.5 16.0 15.5 15.0 14.5 14.0 13.5 1,000 500 140 80 110 Year Ag e adjust ed mortality r at es Ag e adjust ed pr eval ence r at es 130 100 120 1,200 500 900 1,100 700 1,000 2015 Neoplasms 90 800 600 160 60 100 Year Ag e adjust ed mortality r at es Ag e adjust ed pr eval ence r at es 140 80 120 3,500 1,000 2,000 3,000 2,500 2015
Cardiovascular and circulatory disease
1,500 2001 2003 2005 2007 2009 2011 2013 2001 2003 2005 2007 2009 2011 2013 2015 2015 2003 2005 2007 2009 2011 2013 2003 2005 2007 2009 2011 2013 3.5 1.0 2.5 Year Ag e adjust ed mortality r at es Ag e adjust ed pr eval ence r at es 1.5 3.0 3,500 500 2,000 3,000 1,500 2,500 2001
Mental and behavioral disorders
2.0 1,000 37 16 28 Year Ag e adjust ed mortality r at es Ag e adjust ed pr eval ence r at es 34 25 31 11,000 1,000 5,000 9,000 7,000 2001
Diabetes, urogenital, blood, and endocrine diseases
22 19 3,000 2015 2015 2003 2005 2007 2009 2011 2013 2003 2005 2007 2009 2011 2013 4.5 1.0 2.0 Year Ag e adjust ed mortality r at es Ag e adjust ed pr eval ence r at es 3.5 3.0 21,000 1,000 13,000 9,000 17,000 2001 Musculoskeletal disorders 4.0 1.5 2.5 5,000 3.8 2.6 3.2 Year Ag e adjust ed mortality r at es Ag e adjust ed pr eval ence r at es 3.6 3.0 3.4 21,000 3,000 9,000 17,000 13,000 2001
Other non-communicable disease
2.8 5,000
19,000
7,000 15,000 11,000
Fig. 3. Age-standardized mortality and prevalence rates for non-communicable disease causes in Korea, 2002–2015.
DISCUSSION
In this study, the trends of mortality and prevalence rates in Korea from 2002 to 2015 were analyzed in 21 cause clusters. This analysis of mortality and prevalence in Korea indicated an overall decreasing trend in the age-standardized mortality rates and increasing trend in the age-standardized prevalence rates between 2002 and 2015 for all causes combined. The decrease in age-standardized mortality rates was due to increasing life expectancy, creating a social atmosphere for health improvement, and the establishment of a national health care system. The number of patients due to NCDs continued to increase from 2002 to 2015. The increases in the age-standardized prevalence rates were due to increases in the prevalence of NCDs. In Korea, the number of people with NCDs continues to increase,14 thus increasing
Trends in Long-Term Mortality and Prevalence
2015 2015 2003 2005 2007 2009 2011 2013 2003 2005 2007 2009 2011 2013 2015 2015 2003 2005 2007 2009 2011 2013 2003 2005 2007 2009 2011 2013 23 7 11 Year Ag e adjust ed mortality r at es Ag e adjust ed pr eval ence r at es 19 15 700 580 640 680 620 660 2001 Transport injuries 9 21 17 13 600 20 14 Year Ag e adjust ed mortality r at es Ag e adjust ed pr eval ence r at es 19 1,100 600 800 1,000 900 2001
Unintentional injuries other than transport injuries
18 17 16 15 700 36 20 26 Year Ag e adjust ed mortality r at es Ag e adjust ed pr eval ence r at es 32 22 30 115 75 95 105 2001
Self-harm and interpersonal violence 34 24 28 85 1.4 0.2 0.6 Year Ag e adjust ed mortality r at es Ag e adjust ed pr eval ence r at es 1.2 0.4 0.8 5 0 2 4 3 2001
Forces of natures, war, and legal intervention
1.0
1
Fig. 4. Age-standardized mortality and prevalence rates for injury causes in Korea, 2002–2015. 28 12 Year Ag e adjust ed mortality r at es Ag e adjust ed pr eval ence r at es 12,000 2,000 2001 2003 2005 2007 2009 2011 2013 2015
Chronic respiratory diseases 24 20 16 10,000 8,000 6,000 4,000 24 8 Year Ag e adjust ed mortality r at es Ag e adjust ed pr eval ence r at es 800 400 450 700 550 2001 2003 2005 2007 2009 2011 2013 2015
Cirrhosis of the liver 20 16 12 750 600 500 650 2015 2015 2003 2005 2007 2009 2011 2013 2003 2005 2007 2009 2011 2013 9 5 6 Year Ag e adjust ed mortality r at es Ag e adjust ed pr eval ence r at es 8 7 16,000 7,000 13,000 15,000 12,000 14,000 2001
Digestive diseases (except cirrhosis)
10,000 8,000 11,000 9,000 17.5 13.0 Year Ag e adjust ed mortality r at es Ag e adjust ed pr eval ence r at es 3,000 0 1,500 2,500 2,000 2001 Neurological disorders 17.0 16.5 16.0 15.5 15.0 14.5 14.0 13.5 1,000 500 80 110 Year Ag e adjust ed mortality r Ag e adjust ed pr eval ence r 130 100 120 500 900 1,100 700 1,000 2015 90 800 600 60 100 Year Ag e adjust ed mortality r Ag e adjust ed pr eval ence r 140 80 120 1,000 2,000 3,000 2,500 2015 1,500 2001 2003 2005 2007 2009 2011 2013 2001 2003 2005 2007 2009 2011 2013 2015 2015 2003 2005 2007 2009 2011 2013 2003 2005 2007 2009 2011 2013 3.5 1.0 2.5 Year Ag e adjust ed mortality r at es Ag e adjust ed pr eval ence r at es 1.5 3.0 3,500 500 2,000 3,000 1,500 2,500 2001
Mental and behavioral disorders
2.0 1,000 37 16 28 Year Ag e adjust ed mortality r at es Ag e adjust ed pr eval ence r at es 34 25 31 11,000 1,000 5,000 9,000 7,000 2001
Diabetes, urogenital, blood, and endocrine diseases
22 19 3,000 2015 2015 2003 2005 2007 2009 2011 2013 2003 2005 2007 2009 2011 2013 4.5 1.0 2.0 Year Ag e adjust ed mortality r at es Ag e adjust ed pr eval ence r at es 3.5 3.0 21,000 1,000 13,000 9,000 17,000 2001 Musculoskeletal disorders 4.0 1.5 2.5 5,000 3.8 2.6 3.2 Year Ag e adjust ed mortality r at es Ag e adjust ed pr eval ence r at es 3.6 3.0 3.4 21,000 3,000 9,000 17,000 13,000 2001
Other non-communicable disease
2.8 5,000
19,000
7,000 15,000 11,000
the socioeconomic burden. In particular, the burden of NCDs is expected to continue to rise due to the increase in the elderly population. Thus, preventive management policies for NCDs are needed.
Among the CMNNs, the prevalence rate of HIV/AIDS and tuberculosis has been declining since 2006, which was seen as an effect of the continued decline in the prevalence of tuberculosis in Korea; the number of tuberculosis patients in Korea has decreased by an average of 6.6% per annum over the last 5 years.15 However, the number of new infections
of HIV/AIDS in Korea has continued to rise,16 and the prevalence of tuberculosis is still high
compared to other OECD member countries; therefore, it requires continued management.17
In NCD analysis, the mortality rates of cancer and cardiovascular and circulatory diseases, which are major causes of death in Korea, tended to decrease sharply over the study period. However, while the mortality rate for all diseases in the NCD group has decreased, the mortality rates for neurological disorders has increased since 2005, with stroke making a significant contribution. Globally, the number of deaths from neurological disorders increased by 36.7% between 1990 and 2015.18 This is due to the increased numbers of people
and the aging of society, which increases the burden of neurological disorders, although the age-standardized mortality rate has decreased significantly. As the number of elderly people continues to rise in Korea,19 the mortality rate of neurological disorders is expected
to continue to rise. Therefore, neurological disorders are an important cause of death around the world, and as mortality rates continue to rise in Korea, health policy makers and healthcare providers must be aware of these trends to provide appropriate services. Although the death rate associated with neurological disorders in Korea is still low, the continuous increasing trend in mortality in this country remains a concern.
The prevalence rates for transport injuries have decreased since 2007. Although the decreasing trend of prevalence rates continues due to continuous efforts to prevent traffic accidents and improve public awareness of compliance with laws and regulations, efforts to reduce deaths from traffic accidents across the nation are still lower than in major OECD member countries.20 To date, Korea has invested about 1.3 trillion Won in transportation
safety and implemented various road traffic safety projects every year. Until recently, however, the number of traffic accidents and the gap in traffic safety level has not decreased compared to other countries.21 Therefore, it is necessary to reevaluate the effectiveness
of the existing major road traffic safety projects as policy measures and to seek measures for improvement to ensure more efficient implementation of the budget. In addition, it is necessary to strengthen public relations and education for children and senior citizens in kindergarten and institutions for the elderly to prevent transport injuries.
Finally, the mortality rate associated with self-harm and interpersonal violence rose until 2011, but has since changed to a declining trend. This trend is related to a change in the suicide rate in Korea, which fell from 31.7 per 100,000 people in 2011 to 25.6 per 100,000 people in 2016. The Korean government is carrying out policies, such as the 1 million Gate Keeper training, as well as a survey of all suicide deaths over 5 years, and 24-hour telephone consultation to prevent suicide, and these efforts seem to have influenced the recent decrease in suicide rate. However, the number has increased in teenagers and in people in their 20s, and also the incidence of self-harm in the lower socioeconomic groups is on the rise.
22 Therefore, self-injury and interpersonal violence should be investigated and managed
separately in socially disadvantaged classes.
10/12
This study had a number of limitations. First, the study was conducted over a 13-year period from 2002 to 2015. A maximum of one joinpoint was allowed due to the short period of the study. A short-term trend is prone to random variation, so further studies over a longer period would provide clearer results regarding the disease trends. Second, in this study, 206 mutually exclusive diseases and injuries in Korea were divided into 21 cause clusters, and the trends of age-standardized mortality and prevalence rates were examined. As they were analyzed with disease-cause clusters, there were limitations in analyzing the trends of each individual disease. Further disease-specific studies are needed to investigate these trends. Despite these limitations, this study measured the mortality and prevalence trends of a comprehensive list of diseases in Korea and provided important implications. We expected the results of this study to be used as an important resource to establish appropriate disease prevention and health interventions.
REFERENCES
1. World Health Organization. World Health Statistics. Geneva: World Health Organization; 2009. 2. Stringhini S, Dugravot A, Shipley M, Goldberg M, Zins M, Kivimäki M, et al. Health behaviours,
socioeconomic status, and mortality: further analyses of the British Whitehall II and the French GAZEL prospective cohorts. PLoS Med 2011;8(2):e1000419.
PUBMED | CROSSREF
3. Micklesfield LK, Lambert EV, Hume DJ, Chantler S, Pienaar PR, Dickie K, et al. Socio-cultural, environmental and behavioural determinants of obesity in black South African women. Cardiovasc J Afr 2013;24(9-10):369-75.
PUBMED | CROSSREF
4. Fitzmaurice C, Allen C, Barber RM, Barregard L, Bhutta ZA, et al.; Global Burden of Disease Cancer Collaboration Global, regional, and national cancer incidence, mortality, years of life lost, years lived with disability, and disability-adjusted life-years for 32 cancer groups, 1990 to 2015: a systematic analysis for the global burden of disease study. JAMA Oncol 2017;3(4):524-48.
PUBMED | CROSSREF
5. Jung KW, Won YJ, Kong HJ, Lee ES; Community of Population-Based Regional Cancer Registries. Cancer Statistics in Korea: Incidence, Mortality, Survival, and Prevalence in 2015. Cancer Res Treat 2018;50(2):303-16. PUBMED | CROSSREF
6. Kim YE, Park H, Jo MW, Oh IH, Go DS, et al. Trends and patterns of burden of disease and injuries in Korea using disability-adjusted life years. J Korean Med Sci 2019;34(Suppl 1):e75.
PUBMED | CROSSREF
7. Lee J, Lee JS, Park SH, Shin SA, Kim K. Cohort profile: The National Health Insurance Service-National Sample Cohort (NHIS-NSC), South Korea. Int J Epidemiol 2017;46(2):e15.
PUBMED | CROSSREF
8. Yoon J, Oh IH, Seo H, Kim EJ, Gong YH, Ock M, et al. Disability-adjusted life years for 313 diseases and injuries: the 2012 Korean Burden of Disease Study. J Korean Med Sci 2016;31 Suppl 2:S146-57.
PUBMED | CROSSREF
9. Murray CJ, Lopez AD. The Global Burden of Disease: a Comprehensive Assessment of Mortality and Disability from Diseases, Injuries and Risk Factors in 1990 and Projected to 2020. Cambridge, MA: Harvard University Press; 1996. 10. Lee YR, Kim YA, Park SY, Oh CM, Kim YE, Oh IH. Application of a modified garbage code algorithm to
estimate cause-specific mortality and years of life lost in Korea. J Korean Med Sci 2016;31 Suppl 2:S121-8. PUBMED | CROSSREF
11. National Cancer Center (KR). Annual Report of Cancer Statistics in Korea in 2012. Goyang: National Cancer Center; 2014.
12. Lee WK, Lim D, Park H. Disability-adjusted life years (DALYs) for injuries using death certificates and hospital discharge survey by the Korean burden of disease study 2012. J Korean Med Sci 2016;31 Suppl 2:S200-7. PUBMED | CROSSREF
13. Joipoint Regression Program. Version 4.5.0.1. Bethesda, MD; Statistical Research and Application Branch. National Cancer Institute; 2018.
14. Korea Centers for Disease Control and Prevention. Chronic Illness Fact Book 2015. Cheongju: Korea Centers for Disease Control and Prevention; 2015.
15. Korea Centers for Disease Control and Prevention. Tuberculosis Notification Status in Korea in 2017. Cheongju: Korea Centers for Disease Control and Prevention; 2017.
16. Korea Centers for Disease Control and Prevention. Global HIV AIDS Statistics. Cheongju: Korea Centers for Disease Control and Prevention; 2017.
17. World Health Organization. Global Tuberculosis Report 2017. Geneva: World Health Organization; 2013. 18. Feigin VL, Abajobir AA, Abate KH, Abd-Allah F, Abdulle AM, Abera SF, et al. Global, regional, and
national burden of neurological disorders during 1990-2015: a systematic analysis for the Global Burden of Disease Study 2015. Lancet Neurol 2017;16(11):877-97.
PUBMED | CROSSREF
19. Statistics Korea. Major population indicators (sex ratio, population growth rate, population structure, support costs, etc.). http://kostat.go.kr/portal/korea/index.action. Accessed 19 July 2018.
20. Statistics Korea. e-national index: traffic accidents. http://www.index.go.kr/potal/main/PotalMain.do. Accessed 23 July 2018.
21. Lim JK, Seol JH, Park JW, Sung NM, Choi JS, et al. Effects and Improvements on Highway Safety Projects in Korea. Sejong: Korea Traffic Research Institute; 2016.
22. Statistics Korea. Cause of death in 2016. http://kosis.kr/. Accessed 11 July 2018.
12/12