Hydrogen Production Costs of Various Primary Energy Sources
Jae-Hyuk Choi, Nam-il Tak, Yonghee Kim, and Won Seok Park
Nuclear Hydrogen Project, KAERI, 150 Deokjin-Dong, Daejeon , 305-353, [email protected]
1. Introduction
The limited resource and environmental impacts of fossil fuels are becoming more and more serious problems in the world. Consequently, hydrogen is in the limelight as a future alternative energy due to its clean combustion and inexhaustibility and a transition from the traditional fossil fuel system to a hydrogen-based energy system is under considerations.[1] Several countries are already gearing the industries to the hydrogen economy to cope with the limitations of the current fossil fuels.
Unfortunately, hydrogen has to be chemically separated from the hydrogen compounds in nature such as water by using some energy sources. In this paper, the hydrogen production costs of major primary energy sources are compared in consideration of the Korean situations. The evaluation methodology is based on the report of the National Academy of Science (NAS) of U.S.[1]
2. Assumptions for Estimation of Hydrogen Production Costs
The possible energy sources to produce hydrogen are shown in the first column of Table 1. Currently, most of hydrogen is produced from natural gas (NG) via the steam-reforming method. The coal gasification is also a potential option for a hydrogen production. Hydrogen also can be separated from water via electrolysis or high-temperature chemical reactions. Electricity can be taken directly from the grid (from a variety of energy sources) or generated by wind turbines or photovoltaics that feed the hydrogen production facility directly. Nuclear energy might be used in high-temperature chemical reactions or electrolysis. Biomass could be used in the future with its unique method.
The estimates presented here are developed at three different scales of hydrogen generation, referred to as central station (CS), midsize (MS), and distributed (Dist). Central station plants are assumed to have a production capacity of 1,200,000 kg per day supporting nearly 2 million cars. Midsize plants are assumed to have a production capacity of 24,000 kg per day and support 40,000 cars. The distributed plants have the capacity to support 800 cars. It is assumed that natural gas, coal and nuclear energy use central station plants but biomass uses a midsize plant. Solar-photovoltaic(PV) and wind technologies are examined at distributed scale.
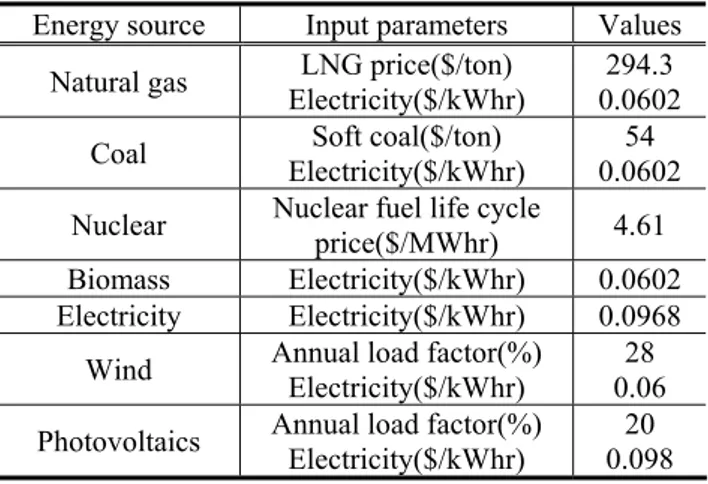
Table 1 contains major input parameters relative to Korean situations as of the year 2004. For the nuclear fuel life cycle cost, the value from Japan [2] is adopted.
In the case of wind, the load factor of the Pohang Young-deok wind plant is applied, and the electricity price reported from the Cheju Haeng-won wind plant is used.
Table. 1 Energy sources and their input parameters considered for Korean situations
Energy source Input parameters Values
Natural gas Electricity($/kWhr) LNG price($/ton) 0.0602294.3
Coal Electricity($/kWhr) Soft coal($/ton) 0.060254
Nuclear Nuclear fuel life cycle price($/MWhr) 4.61
Biomass Electricity($/kWhr) 0.0602
Electricity Electricity($/kWhr) 0.0968
Wind Annual load factor(%) Electricity($/kWhr) 0.06 28
Photovoltaics Annual load factor(%) Electricity($/kWhr) 0.098 20
3. Results
Figure 1 presents the estimated production costs based on the current technologies (only natural gas and coal) and possible future technologies. As shown in the figure, the hydrogen production cost by natural gas or coal is lower than those of the other technologies, but the natural gas or coal generate lots of carbon dioxide as a by-product, which may cause a global climatic change. In this study, 50$/tonne C is used as a carbon tax. The rise of the carbon tax directly increases the hydrogen production cost. Moreover, serious concerns about material exhibition exist.
0 2 4 6 8 10 12 14
NG Coal NG Coal Nuclear Biomass Electrolysis Wind Solar T e c h n ol ogi e s C o st o f ge n e rt in g h y d roge n ( $ / k g) 2004 C u r r e n t 1.59 8.29 1.36 2.30a 1.10 1.43a 1.61 1.64a 2.35 2.78a 5.41 4.57* 4.08† 6.961 6.032
Pos s ible future technologies (After 2020)
1. a is the hydrogen production cost by increasing 100%
2. In the case of wind, * shows 20% load factor, + shows 28% load factor 3. In the case of solar, 1 shows 12% load factor, 2 shows 20% load factor.
Figure 1. Costs of generating hydrogen based on the current and possible future technologies.
Transactions of the Korean Nuclear Society Autumn Meeting Busan, Korea, October 27-28, 2005
The hydrogen production costs by wind or solar are very high because of the high electricity costs and the low load factors less than 30%. In the case of the nuclear, a notable feature is found that the dependency of the hydrogen production cost on the material price is very low. And the hydrogen production by the nuclear is more economical than by the natural gas when the gas price is doubled. This implies that the nuclear-based hydrogen having a low carbon dioxide emission has a cost-competitiveness.
Figure 2 presents the costs of supplying hydrogen for the possible future technologies. This estimation includes the costs of distribution and dispensing. For fossil and nuclear technologies, distribution and dispensing costs are the significant part of the total cost. In the case of wind or solar, compared with Fig. 1, the production cost and the supply cost are the same because distribution and dispensing costs is not included in the supply cost due to distributed scale. Meanwhile, the supply cost by biomass is a significant higher than the production cost. For the biomass, it was assumed that distribution would be made by cryogenic trucks because of the low volumes of hydrogen. When the coal price is increased by 100%, the supplying cost by nuclear energy is almost equal to that of coal.
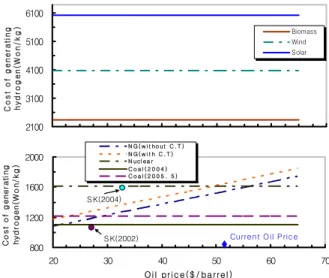
Figure 3 presents the hydrogen production costs as a function of the oil price. It was assumed that the hydrogen production costs of the renewable energies are constant because they hardly depend on the oil price. In this figure, an interesting result is that the cost by nuclear energy is lower than that of natural gas when the oil price is over about $50/barrel. Taking into consideration the expected increase of the future oil price, the nuclear-hydrogen option appears to be very attractive
4. Conclusions
The costs of generating hydrogen are evaluated for possible energy sources based on the National Academy of Science (NAS) report in consideration of the South Korean situations. The results may be summarized as follows:
• The fossil fuels are susceptible to the price variation
according to the oil price and the material price, and the hydrogen production cost also depends on the carbon tax.
• The hydrogen production cost from the renewal
energy sources such as the wind, solar, and biomass are much more expensive(greater than 4~6 times) when compared with the hydrogen production from coal or natural gas. On the other hand, the production cost by nuclear energy is lower than that of natural gas when the oil price is over about $50/barrel. It means that nuclear energy has a high potential for the hydrogen production in the future.
0 2 4 6 8 10 12 14
NG Coal Nuclear Biomass Electrolysis Wind Solar
Te c h nol ogi e s C o s t o f su ppl y in g h y d ro g e n ( $ /k g ) 2.06 1.80 2.31 3.75 5.41 4.08† 6.032 3.31a 2.18a 2.34a 4.18a 4.57 * Pos s ible future technologies (After 2020)
6.961
Figure 2. Costs of supplying hydrogen for the possible future technologies. 2100 3100 4100 5100 6100 C o s t o f g e ne ra ti ng h y droge n (W on / k g ) Biomass Wind Solar 800 1200 1600 2000 20 30 40 50 60 70 Oi l pr i c e ( $ / bar r e l ) C o s t o f g e ne ra ti ng hyd ro g en( W o n / k g ) N G ( w i t ho ut C . T ) N G ( w i t h C . T ) N ucl ea r C o a l ( 2 0 0 4 ) C o a l ( 2 0 0 5 . 5 ) S K(2002) S K(2004)
Current Oil P rice
1. SK : Naphtha method (200Ton/d, carbon imputed cost: $50/ tonne C) 2. Coal price: $54/Ton(2004), $74/Ton(2005.5, based on CIF) 3. Carbon imputed cost for natural gas: $50/Ton
4. Current Oil Price: $ 51.85/bbl(Dubai, 2005.6.30)
Figure 3. Cost of generating hydrogen according to variation of oil price.
Acknowledgement
This work was supported in part by Ministry of Science and Technology (MOST) of Korea through the Nuclear Hydrogen Development and Demonstration (NHDD) project coordinated by the Korea Atomic Energy Research Institute.
REFERENCES
[1] The Hydrogen Economy Opportunities, Costs, Barriers, and R&D Needs, The National Academy Science Press, 2004. [2] Takei, M. et al, Study on the Fuel Cycle Cost of Gas Turbine High Temperature Reactor, GTHTR-300, JAERI - Tech 2002-089.