www.cdc.go.kr
1320 주간 건강과 질병•제12권 제35호 만성질환 통계
나트륨 섭취 현황, 2007~2017
나트륨은 수분 평형, 산염기 균형 조절 등에 중요한 영양소이지만, 장기적으로 과잉 섭취할 경우 심뇌혈관질환, 신장질환 등의 발병 및 악화를 초래할 수 있고 위암, 골다공증, 비만 등도 관련이 있어 절제가 필요하며 목표섭취량 2,000㎎을 넘지 않도록 권고함. 최근 10여년 사이 나트륨 섭취 수준은 감소하는 것처럼 보이나 여전히 목표섭취량의 2배가량 섭취하고 있으며(그림 1) 연령별로는 30~40대 섭취량이 가장 높았음 (그림 2). 자세한 결과는 「2017 국민건강통계」 참조 출처 : 질병관리본부. 2017 국민건강통계, http://knhanes.cdc.go.kr/ 작성부서 : 질병관리본부 질병예방센터 건강영양조사과 * 대상 연령 : 만9세 이상 * 연도별 섭취량은 2005년 추계인구로 연령표준화 * 나트륨 목표섭취량: 2015 한국인 영양소 섭취기준(보건복지부, 2015) 275 283 288 298 297 278 237 229 242 228 213 196 203 201 209 206 204 169 165 166 157 152 0 100 200 300 2007 2008 2009 2010 2011 2012 2013 2014 2015 2016 2017 나트륨 목표섭취량 대비 섭취비율 (%) 나트륨 목표섭취량 대비 섭취비율 (%) 조사연도 남자 여자 189 137 211 157 239 162 237 171 216 150 188 141 162 108 0 100 200 300 남자 여자 10~19세 20~29세 30~39세 40~49세 50~59세 60~69세 70세 이상 그림 1. 연도별 나트륨 목표섭취량(2,000mg) 대비 섭취 비율, 2007~2017 그림 2. 연령별 나트륨 목표섭취량 대비 섭취 비율, 2017www.cdc.go.kr
1321 주간 건강과 질병•제12권 제35호
Source: Korea Health Statistics 2017, http://knhanes.cdc.go.kr/
Reported by: Division of Health and Nutrition Survey, Korea Centers for Disease Control and Prevention
Non-communicable Disease (NCD) Statistics
Trends in intake of sodium, 2007-2017
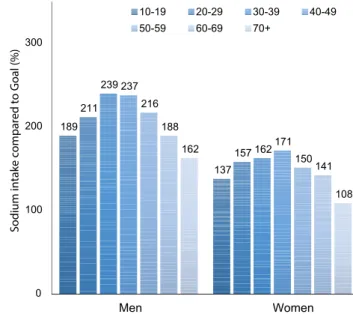
Although sodium is a major nutrient that acts as a regulator at acid-base balance, water equilibrium, etc, excess intake of sodium for long time is known as threatening cause of cardiocerebrovascular diseases, stomach cancer, osteoporosis, obesity, and so on. Sodium intake of 2017 was about double of the goal, 2,000 mg, meaning with upper limit though decreased between 2007-2017 (see Figure 1), with the highest consumption occurring among men and women in their 30-40s (see Figure 2).
* Age profile of subjects: 9 years old and over
* The mean and standard error in figure 1 were calculated using the direct standardization method based on a 2005 population projection. * Goal of sodium: 2015 Dietary Reference Intakes for Koreans (Ministry of Health and Welfare, Republic of Korea, 2015)
275 283 288 298 297 278 237 229 242 228 213 196 203 201 209 206 204 169 165 166 157 152 0 100 200 300 2007 2008 2009 2010 2011 2012 2013 2014 2015 2016 2017
Sodium intake compared to Goal (%) Sodium intake compared to Goal (%)
Survey year Men Women 189 137 211 157 239 162 237 171 216 150 188 141 162 108 0 100 200 300 Men Women 10-19 20-29 30-39 40-49 50-59 60-69 70+
Figure 1. Trends in sodium intake compared to Goal, 2007-2017
Figure 2. Sodium intake compared to Goal by age groups, 2017