저작자표시-비영리-변경금지 2.0 대한민국 이용자는 아래의 조건을 따르는 경우에 한하여 자유롭게 l 이 저작물을 복제, 배포, 전송, 전시, 공연 및 방송할 수 있습니다. 다음과 같은 조건을 따라야 합니다: l 귀하는, 이 저작물의 재이용이나 배포의 경우, 이 저작물에 적용된 이용허락조건 을 명확하게 나타내어야 합니다. l 저작권자로부터 별도의 허가를 받으면 이러한 조건들은 적용되지 않습니다. 저작권법에 따른 이용자의 권리는 위의 내용에 의하여 영향을 받지 않습니다. 이것은 이용허락규약(Legal Code)을 이해하기 쉽게 요약한 것입니다. Disclaimer 저작자표시. 귀하는 원저작자를 표시하여야 합니다. 비영리. 귀하는 이 저작물을 영리 목적으로 이용할 수 없습니다. 변경금지. 귀하는 이 저작물을 개작, 변형 또는 가공할 수 없습니다.
Doctoral thesis in Medicine
The Association between Daily
Level of Fine and Coarse Particles
and Mortality in Seoul
from 2006 to 2015
Graduate School of Ajou University
Department of Medicine
The Association between Daily
Level of Fine and Coarse Particles
and Mortality in Seoul
from 2006 to 2015
Prof. Jae-Yeon Jang, Advisor
I submit this thesis as the Doctoral thesis in medicine.
February 2019
Graduate School of Ajou University
Department of Medicine
The Doctoral thesis of Wonwoong Na in Medicine is hereby
approved.
Thesis Defense Committee Chair
SoonYoung_Lee Seal
Member Jae-Yeon_Jang Seal
Member Ho-jang Kwon Seal
Member Yunhwan Lee Seal
Member Jae Bum Park Seal
Graduate School of Ajou University
Abstract
The most concerning environmental problem in Korea is particulate matter (PM) pollution. To solve this problem, the government has implemented various policies, such as strengthening the management standards of PM2.5 (which is PM of less than
2.5 μm in diameter; fine particle). However, the Public's concern is ongoing due to the excessive policies and inaccurate information from the media. In addition, PM management is focused on fine particles, whereas the health impact is more in case of PM with larger diameter (2.5–10 μm; PM2.5-10, coarse particle). However, there
is a relative lack of information about the characteristics and health effects of coarse particles. Therefore, this study was conducted to examine the nature and occurrence of fine and coarse particles, and to determine the health effect of PM per size, in order to increase the understanding of fine dust and to propose a preferred management policy.
The PM10 and fine particle data from 2006 to 2015, provided by Seoul
Atmospheric Environment information site and climate environment headquarters, respectively, were used to examine the patterns of occurrence of coarse and fine particles. In addition, the meteorological data provided by the Meteorological Office was used to determine the nature of the occurrence of coarse and fine particles due to the meteorological factors. Health effects were estimated as the number of deaths by causes per day during the same period in Seoul by using the causes of death data. The causes of death in this study are non-traumatic, which include total deaths except for those from trauma and exogenous factors, cardiocerebrovascular
disease, and respiratory causes. Generalized additive model assuming a Poisson distribution was used for statistical analysis, and five lag models (from lag 0 day to lag 4 days) were compared.
From 2006 to 2015, the average PM10, PM2.5, and PM2.5-10 were 50.32, 25.44, and
24.88 μg/m3, respectively. Each average concentration was gradually reduced over 10 years, and the pattern of occurrence was different according to the season and weather conditions.
The impact of PM2.5 on health was more significant than that of PM2.5-10. PM2.5-10
was associated with increment of 0.15% in non-traumatic deaths in lag 3 days per 10 μg/m3 increments. 10 μg/m3 increment of PM2.5 was associated with 0.30% of
non-traumatic deaths in lag 2 days. Although deaths due to cardiocerebrovascular disease were likely to have association with increment of PM2.5, the relative risks
were not significant. Respiratory deaths increased significantly to 0.64% on the second day when the PM2.5-10 was increased.
In the analysis of impact of fine particles fraction on mortality, 10% increments in fine particle fraction were associated with 0.52% increment in non-traumatic death in lag 2 days.
The concentration of PM2.5 should be managed intensively because of its high
health impacts. However, because coarse particles also increase non-traumatic and respiratory disease deaths significantly, it is important to reduce their
Table of Contents
A.
List of Text
Abstract... i
Table of Contents... iii
A. List of Text... iii
B. List of Figures... v
C. List of Tables... v
I. Introduction... 1
II. Theoretical Background... 5
A. General character of particulate matter... 5
B. Health effect of particulate matter... 8
1. Themechanism of health effect of particulate matter... 9
2. Epidemiologic study on health effect of particulate matter ... 11
III. Hypotheses and Objectives of Study... 14
IV. Methods... 16
A. Data collection... 16
1. Air pollution data... 16
2. Confounding variables data... 17
3. Mortality data... 17
B. Statistical analysis... 19
1. Health effect according the size of particles... 19
V. Results... 22
1. General characteristic of data... 22
2. The change in concentration of particulate matter by year... 25
3. Characteristics of particulate matter concentration according to season and meteorological factors by each particle size... 26
4. Correlation of particulate matter concentration by size of particulate matter... 32
5. Analysis of association between particulate matter and mortality... 32
6. Analysis of association between fraction of PM2.5 in PM10 and mortality... 33
VI. Discussion... 36
1. The difference in concentration of fine and coarse particle... 36
2. The difference on concentration of fine and coarse particle…... 38
3. Comparison of relative risk of fine and coarse particles... 41
4. Management of Particulate matter... 42
5. Limitation and strength………...……….43
VII. Conclusion... 46
B.
List of Figures
▶
Figure 1. Trend in the search of the keyword “Particulate matter” (2004 - 2018, Google) ... 3▶
Figure 2. Yearly concentration of PM10, PM2.5-10 and PM2.5 and fraction of PM2.5 in PM10... 24▶
Figure 3. Correlation of meteorological factor with PM10, PM2.5-10 and PM2.5... 28C.
List of Tables
▶
Table 1. WHO guideline for management of particulate matter... 9▶
Table 2. General characteristic of data of air pollution, meteorological factors and mortality from 2006 to 2015... 23▶
Table 3. The yearly average concentration of PM10, PM2.5-10 and PM2.5 and the number of days of high concentration... 25▶
Table 4. PM10, PM2.5-10 and PM2.5 concentrations and PM2.5/PM10 ratio by season... 26▶
Table 5. The comparisons of PM10, PM2.5-10 and PM2.5 according to meteorological factors quartiles... 29▶
Table 6. Correlation between PM10, PM2.5-10, PM2.5 and PM2.5/PM10 ratio ... 31▶
Table 7. Generalized additive model of cause-specific mortality according to increase in PM2.5 and PM2.5-10... 34▶
Table 8. Generalized additive model of cause-specific mortality according to increase in PM10 and PM2.5 fraction in PM10... 35I.
Introduction
Air pollution, especially by particulate matter (PM), is a social problem with a cause for concern to citizens in Korean society (Korea Institute for Health and Social Affairs, 2018). Among air pollutants, solid or liquid contaminants floating in the air, which are generally referred to as total suspended particles (TSP), are distinguished from certain chemicals such as ozone or sulfur dioxide (Frumkin, 2010). Among air pollutants are PM10, which are dust particles with a size of 10 μm or less. Particles less than 2.5 μm are referred to as PM2.5 or fine particles. PMs that are greater than 2.5 μm but less than 10 μm are referred to as PM2.5-10 or coarse particles. Because of these small particle sizes, they do not get trapped in the mucous membranes of the nose or respiratory tract; therefore, they enter the lungs through the bronchi while breathing. It is known that some of these small particles subsequently infiltrate the blood vessels from the alveoli, to cause health effects (Shin, 2007).
Air pollution caused by PM has emerged as a social problem in Korea (Kim, 2013) for quite a while. The first act on atmospheric pollution in Korea was the Basic Law on Environmental Policies and the Air Quality Preservation Act, enacted in 1990. At that time, the level of air pollution was much worse than today. The average concentration of PM10 in Seoul, in 1990 was 78 μg/m3, which was much higher than the average concentration of 46 μg/m3 in 2015 (Seoul Air Quality Information). Awareness of the seriousness of the air pollution level in Korea, especially in Seoul, with the worst air quality level among the major cities of the Organization for
Economic Co-operation and Development countries, led to the enactment of a special law on the improvement of the atmospheric environment in the Seoul metropolitan area in December 2003.
Since then, a basic plan for the improvement of the atmospheric
environment in Seoul for 10 years has been established and implemented; leading to improvement in air pollution in the Seoul metropolitan area, overall (Jung, 2010). The paradigm shift in air pollution control has been from managing air pollutants to preventing health hazards (Ministry of Environment, 2018). PM2.5 has been reported to increase the incidence of diseases and mortality such as cardiocerebrovascular disease or cancer (Bae, 2014; Brown et al., 2001). The target for PM2.5 concentration is set at 15 μg/m3 or less per year, or a daily average of 35 μg/m3 or less. In
addition, the PM2.5 forecasting system and real-time concentration notification has been implemented since 2013, to allow citizens to better cope with PM.
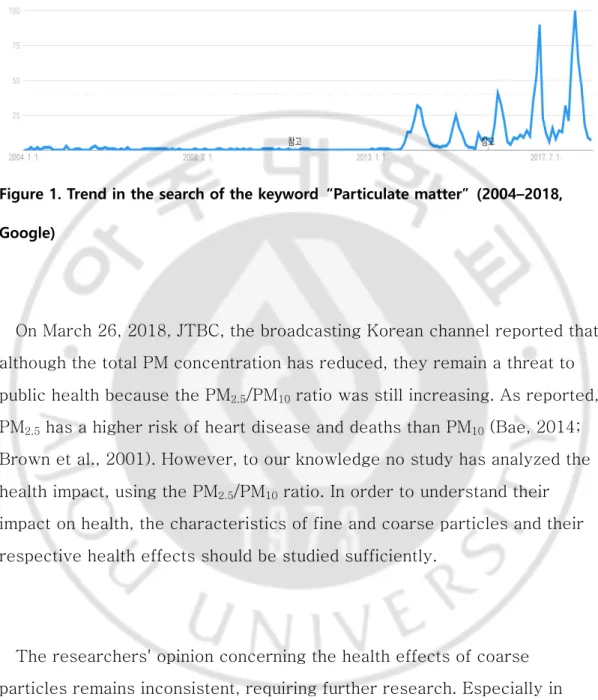
Despite these measures, however, there is increasing concern about PM. According to a study by Jang (2014), 90% of study participants perceived that the health risk of PM was high, and 92.7% think that the damage will be intensified in the future (Jang, 2014). The number of news reports dealing with PM and the increase in the search by people following the PM2.5 forecast, is a reflection of the interest and concerns of the public on PM (Fig. 1).
Figure 1. Trend in the search of the keyword “Particulate matter” (2004–2018, Google)
On March 26, 2018, JTBC, the broadcasting Korean channel reported that although the total PM concentration has reduced, they remain a threat to public health because the PM2.5/PM10 ratio was still increasing. As reported, PM2.5 has a higher risk of heart disease and deaths than PM10 (Bae, 2014; Brown et al., 2001). However, to our knowledge no study has analyzed the health impact, using the PM2.5/PM10 ratio. In order to understand their impact on health, the characteristics of fine and coarse particles and their respective health effects should be studied sufficiently.
The researchers' opinion concerning the health effects of coarse particles remains inconsistent, requiring further research. Especially in Korea, there are not many comparative studies on the health effects of fine and coarse particles.
In order to establish management measures that are based on evidence and accurate information about the risk of PM, as well as to allay public fears, health authorities need to understand the health effects of PM. In addition, as the focus of PM management gradually shifts toward fine particles, the health hazards of fine particles are becoming the main point of emphasis. However, the risk of coarse PMs that are considered to be of less importance also need to be examined, for optimal PM prevention and control.
II.
Theoretical Background
A.
General character of particulate matter
PM refers to all contaminants in the air, less than 10 μm, regardless of their composition. The major components of fine dust are heavy metals, organic compounds such as biologically derived substances, inorganic carbonaceous substances such as soot and carbon, sulfuric acid, nitric acid, ammonium, and other ions. The composition of PM differs depending on the size. Coarse particles consist of insoluble minerals derived from crust dust, endotoxins from pollen or bacteria, biomaterials including fungi and
bacteria, and sea salts. Whereas, fine particles are predominantly composed of materials produced by the combustion of carbon, hydrocarbons, metals, and other secondary substances generated from combustion processes such as sulfuric acid and nitric acid (Adams et al., 2015).
According to a study on the size distribution of fine dust in Ulsan (one of the representative industrial cities in Korea), the metallic substances measured in PM10 for 1 year were aluminum, calcium, cadmium, chromium, copper, iron, potassium, magnesium, manganese, sodium, nickel, lead, and zinc (Ny and Lee, 2011). The distribution of these metallic materials differs depending on the particle size. Cadmium, nickel, and manganese are the most abundant in PM2.5 with a diameter of less than 2.1 μm whereas, light metals and iron such as sodium, calcium, potassium, and aluminum showed the highest concentration in PM2.5-10. Metals such as lead, copper, and magnesium were found to be highly concentrated in particles larger than
5.8 μm in diameter. This difference in composition suggests that these particles may have different sources depending on their size. In that study, the enrichment factor (EF) of each metallic material was calculated. Higher EFs can be attributed to industrial activities such as smelting, automobile exhaust, and fossil fuel combustion. The EF value of cadmium was very high regardless of size, but the EF value of metallic materials less than 2.1 μm was much higher than that of metallic materials exceeding 2.1 μm. It can be interpreted that the fine particles are more likely than coarse particles to originate from human activities rather than natural sources (Ny, 2011).
Oh et al. measured and analyzed 20 kinds of PM compositions in Yongin, a metropolitan area, for 2 years (Oh et al., 2011). They obtained similar results. When the size of the particle was larger than 2.1 μm, old sea salt, construction dust, crust, and road dust appeared to be the main sources; and some materials were estimated to have traveled for some distance, that is, from another city or neighboring country. Ammonium nitrate, which is produced by secondary reaction of the exhaust gas after the combustion of automobile fuel such as diesel or gas, was also included in coarse particles. Furthermore, it was reported that the dust generated from coal or oil
combustion had more of fine particles and the dust generated in the incinerator also had fine particles. In addition, PM generated when using biomass fuel measured less than 1.1 μm.
As some of the coarse particles show a tendency to travel some distance, PM can be affected not only by the area but also by neighboring cities or countries. In Korea, it is observed that the yellow dust that occurred in
The WHO joint committee reported in a quantitatively assessed study, the extent of fine dust impact across borders in Europe in 2006 (WHO Joint, 2006). Kang et al. estimated the pollution sources of fine particles and gaseous atmospheric pollutants measured in Seoul, suggesting the possibility that they originated from other regions besides the pollutants generated in Seoul itself. Ions of nitrate, sulfate, ammonium, and potassium are likely to have originated from the coastal cities of Liaoning province in China, the inland cities in Shandong and Hebei provinces, and Mokpo, Yeosu, and Busan in Korea. Organic carbon was estimated to have originated from Liaoning Province and Shandong/Hebei Province. On the other hand, elemental carbon (EC) was analyzed to have occurred from the southern part of the western sea, due to the combustion of petroleum fuel, as large ships navigate the area (Kang et al., 2012). Lee et al. analyzed the satellite observations during the period from October 16 to October 20, 2008, when the PM concentration was measured to be very high, and found that the particles generated in China caused high concentration of PM in Korea with high air pressure (Lee et al., 2008). The Ministry of
Environment of Korea summarized the results of the "Korea-US
Cooperative Air Quality Survey (KORUS-AQ)" and found that 48% of the fine particles came from overseas, measured from May 2, 2016 to June 12, 2016. The percentages reported as coming from China, North Korea, and other countries were 34%, 9%, and 6%, respectively (Ministry of
Environment, 2017). However, as a result of the study, the summary report neither provided the quantitative evaluation results for the sources of PM, nor did it conduct a survey of the sources in other countries. Quantitative evaluation of the foreign influence of PM in Korea is necessary to highlight the necessity of a future joint research with neighboring countries.
B.
Health effect of particulate matter
The London smog of 1952 was one of the most serious health accidents caused by air pollutants, such as PM, in the history. At that time, the level of total suspended particles was up to 1,620µg/m3. Assuming that about 60% of TSP is PM10, it is estimated that the PM at that time was about 20 times the current recommended level of 50µg/m3 (Bell, 2001). The death toll from the event was estimated to be between 3,000 and 4,000, in previous studies. However, it has been argued that 10,000 to 12,000 excess deaths would have occurred over a period of several months
because of the increased mortality from influenza, after exposure to the air pollution (Bell et al., 2004). Thereafter, a number of epidemiological studies were conducted to estimate the health effects of PM. Thus, the
International Agency for Research on Cancer (IARC) announced on October 17, 2013 that PM has been designated as a Group 1 carcinogen (IARC, 2013); implying a sufficient evidence that the substance is a cause of cancer in humans. In addition, the World Health Organization (WHO) provided guidelines on air pollution control standards to prevent such health effects. Table 1 shows the guidelines.
Table 1. WHO guideline for management of particulate matter PM2.5 PM10 Annual mean 10 µg/m3 20 µg/m3 24-hour mean 25 µg/m3 50 µg/m3 (Source: www.who.int/news-room/fact-sheets/detail/ambient-(outdoor)-air-quality-and-health)
1. The mechanism of health effect of particulate matter
In a meta-study assessing the acute health effects of particulates, Seaton et al. reported that particulates appear to influence or are the cause of various diseases (Seaton et al., 1995). The mechanism suggested for the health effects evaluated in this study was that the particle that enters the human body during respiration stimulated inflammatory reaction in the alveoli, and produces inflammatory reactant. This results in deterioration of pulmonary disease or causes thrombosis. Li et al. reported that epidermal cells of the lungs and airways undergo oxidative stress due to free radicals, oxidative substances produced by particles then result in DNA damage (Li et al., 1996). In a study of the health effects and mechanism of fine
particles, Feng et al. also pointed to the resultant intracellular oxidative stress, mutagenicity, genotoxicity, and inflammatory responses to PMs (Feng et al., 2016). In addition, Ghio and Huang have shown that lung inflammation increases in human and animal exposed to PM, in an experimental study (Ghio and Huang, 2004).
lungs (Simkhovich et al., 2008; Vermylen et al., 2005). An et al. studied the mechanism of the health effects of PM on cardiovascular disease. Exposure to particles lead to changes in heart rate, blood pressure, vascular tone, blood clotting ability, and atherogenesis. The implicated mechanisms include direct toxicity, as well as, systemic inflammation and increased oxidative stress (An, 2018). Park examined the gene expression patterns of myocardial cells that have been exposed to arsenic in PMs. It was observed that the expression of adenosine monophosphate deaminase (related to the intracellular balance of ATP) mediates gene expression associated with oxidative stress, and also plays an important role in cell relaxation and contraction during arsenic exposure. This could be one of the ways by which cardiovascular disease develops following PM exposure (Park, 2008).
Coarse particles are mainly deposited in the airways, bronchi, and alveoli, whereas fine particles penetrate the blood vessels (Schwarze et al., 2016). In animal experiments, it was observed that the smaller the particle size, the stronger the inflammatory response (Brown et al., 2001). This is
probably because the small sized particle has the higher permeability of the blood vessel and the larger surface area. However, many experimental studies have suggested that coarse particles are the most toxic (Monn and Becker, 1999; Soukup and Becker, 2001; Osornio-Vargas et al., 2003). This may be due to the pathological mechanism of endotoxin contained in coarse particles and the combined action with other mechanisms causing IL-6 secretion and allergic or inflammatory reactions. In addition, dust originating from the crust of silicon oxide in coarse particle size can also be cytotoxic (Warheit, 2001).
2. Epidemiologic study on health effect of particulate matter
Studies that quantitatively assess the health effects of PM have been conducted over the past two decades. By these studies, it is widely reported that PMs have significant association with the morbidity and mortality of respiratory and circulatory diseases (Xing et al., 2016; Brook et al., 2010).
In 2006, Dominique et al. reported that the number of patients
hospitalized for chronic obstructive pulmonary disease and respiratory tract infections in the 65-year-old elderly population in the US increased by 0.91% and 0.92 % (Dominici, 2006) per 10 μg/m3 increments of PM2.5, respectively. In addition, Zheng et al. conducted a meta-analysis of the effects of air pollution on emergency visits due to asthma, with an increase of 2.3% in the number of emergency room visits per PM2.5, with a 10 μg/m3 increase (Zheng et al., 2015). Kim et al. reported the effect of PM on the number of hospitalized asthma patients in Seoul from 2003 to 2011. As a result, the number of inpatients increased by 1.56% per PM2.5, with a 10 μg/m3
increase (Kim et al., 2017).
It is reported that PMs are related to both respiratory diseases and to cardiovascular diseases aggravation. In Dominici's study, heart failure patients increased by 1.28% per 10 μg/m3 increase in PM2.5 (Dominici, 2006). Bell et al. also reported the number of hospitalization due to
PM2.5 (Bell et al., 2014).
As seen in the London smog event, the health effects of PMs also showed association with increased mortality. According to Cohen et al., in 2015, 4.2 million people died from exposure to PM2.5, estimated to be 7.6% of the world's deaths, 59% of which occurred in East and South Asia (Cohen et al., 2015). According to Bae, (2014) the total mortality and
cardiocerebrovascular disease mortality increased by 0.44% and 0.95%, respectively. For every PM10 increase by 10 μg/m3, and for every 10 μg/m3 increment of PM2.5, total death and cardiocerebrovascular disease mortality increased by 0.76% and 1.63%, respectively, from 2006 to 2010 in Seoul (Bae, 2014). Thus, the health risk of PM2.5 was reported to be higher than that of PM10. Janssen et al. reported an increase in total mortality of 0.6% and 0.8% for increase of 10 μg/m3 of PM10 and PM2.5, respectively (Janssen et al., 2013). According to a meta-analysis of the risk of fine dust in China, the PM10 increased by 0.36%, 0.36%, and 0.42% in total deaths, non-traumatic deaths, and cardiovascular deaths for every 10 μg/m3
increase, respectively. In contrast, PM2.5 increase of 0.40%, 0.63%, and 0.75% in total deaths, non-traumatic deaths, and cardiovascular deaths, respectively, occurred for every 10 μg/m3 increase (Lu et al., 2015).
Epidemiological studies on coarse particles are relatively fewer than those on fine particles, and the results are inconsistent. Lee et al. reported that coarse particles were associated with increased mortality due to
al. found that coarse particles did not have a significant effect on
cardiovascular and respiratory disease-hospitalization in the 108 regions in the United States with the control of fine particle concentrations (Roger et al., 2008). Furthermore, Host et al. reported an increase in the number of inpatients due to respiratory diseases as the coarse particle concentration increased in six French cities (Host et al, 2008). In a study by Wang et al., it was found that the daily number of visitors to the Emergency Room in Shanghai was significantly increased by 1.30% when the PM2.5-10 was increased by the quartile in the model where the fine particles, coarse particles, and carbon were controlled for (Wang, 2013).
III.
Hypotheses and Objectives of Study
The hypotheses to test in this study are as follows:
First, the occurrence patterns of fine particles and coarse particles are different from one another other.
Because of the difference in the source of fine particles and coarse particles, changes in pattern of their concentration would be different.
Second, the association of fine particles and coarse particles with mortality may be different from each other.
Because of the characteristics such as particle size and properties, increased fine particles would be associated with the deterioration in cardiocerebrovascular diseases whereas the increase in coarse particles would be related to respiratory diseases.
Third, the increase in fine particle fraction in PM would be related to the increase in mortality.
In previous studies, where fine particles showed association with higher mortality rates and higher relative risks than coarse particles, an increase in the fraction of fine particles in the same concentration of PM may be associated with increased mortality.
The purposes of this study were to provide accurate information that could be used to address the vague anxiety about PM, such that the risk communication can be performed, and to form the basis of policy towards
the prevention and effective management of the health effects of PM, through the verification of these hypotheses.
IV.
Methods
A.
Data collection
1. Air pollution data
In this study, the daily average concentration of PM measured in Seoul from 2006 to 2015 was used. Seoul Metropolitan City started to measure PM10 in 10 areas since 1995 and gradually increased its measuring stations throughout Seoul in the 2000s. The measurement of PM2.5 began in 2002. The PM2.5 data were released to the public from 2013, when the legal management guidelines came into effect, although daily average PM10 is released through the Seoul Metropolitan Government's atmospheric
environment information homepage. PM2.5 data for this study were obtained following a request to Seoul Metropolitan Climate & Environment
Headquarters. In this study, the daily average concentration of coarse particles was estimated and analyzed. The difference between the daily average PM10 concentration and the daily average fine particle
concentration was considered as the coarse particle concentration. Ozone concentration data were used to adjust for the health effects of PMs. Using the 1-hour mean concentration of ozone for the same period provided by Air Korea operated by the Korea Environment Corporation, the daily maximum value of 8-hour average concentration was calculated and used as a confounding variable. When estimating the exposure to air
pollution, it is necessary to consider both the residence and the workplace, or the exposure during transport. Therefore, it is judged that the average value of air pollution in Seoul is more appropriate than the regional data.
The arithmetic average of each regional data was used as a representative value for Seoul.
2. Confounding variables data
The meteorological factors such as temperature, humidity, and wind velocity do not have only a great influence on the concentration of fine dust, they also can be a confounding factor in the occurrence of health effects. Daily data of weather elements by period can be downloaded via the weather data release portal operated by the Korea Meteorological Administration. The meteorological data used in this study are daily
average temperature, relative humidity, precipitation, average wind speed, maximum wind speed, and wind direction with maximum wind speed. Seoul meteorological station of Jongro-gu is at latitude 37.5714, longitude
126.9658, and altitude of 85.67 m.
We also used the weekly index of the influenza sampling surveillance system operated by the Center for Disease Prevention and Control as adjusting variable to correct for the degree of flu pandemic, which may be a confounding factor in analyzing the effects of air pollution on deaths.
3. Mortality data
The indicator of health impact to be identified in this study is the number of daily deaths. Using statistical microdata service system operated by the National Statistical Office, statistical data on the causes of death in Seoul were obtained for 10 years from 2006 to 2015. The daily number of deaths was counted according to the causes of death, classified as death due to non-traumatic causes, death due to cardiocerebrovascular disease, and
death due to respiratory diseases.
Death due to cardiocerebrovascular disease included myocardial infarction, cerebral infarction, cerebral hemorrhage, aortic dissection, or hypertension, while death due to respiratory disease included death due to asthma or chronic obstructive pulmonary disease. Death due to
non-traumatic disease was defined as total death excluding deaths with traumatic codes such as S, T, V, W, X, or Y of the KCD code.
Since the number of deaths may vary depending on the total population, the annual population of Seoul was calculated by using the Statistical Office Population Registration Statistical Data.
B.
Statistical analysis
In order to investigate the pattern and characteristics of PM
concentration, we examined the variations in the concentration of each particle size according to the year, and the variation pattern of the high concentration days in which the daily average concentration of PM was very high. In order to confirm the seasonal variation pattern, the seasonal average concentration and the correlation between PM by particle size was analyzed and presented.
The correlation of concentration of each PM size with each weather element according to the change in the meteorological factor was analyzed to determine how the concentration of PM was influenced by the weather condition.
In order to evaluate the health effects, the daily air pollution averages, daily weather information, and daily number of deaths in Seoul from
January 1, 2006 to December 31, 2015 were obtained and analyzed by time series. Assuming that the number of daily deaths in Seoul followed the Poisson distribution, the effect of PM on the number of deaths was analyzed by using a generalized additive model assuming the Poisson distribution.
1. Health effect according the size of particles
To compare the health effects of the fine and coarse particles, PM pollution models were created, with each particle type used as an independent variable. Air pollution and meteorological factors, influenza epidemic, and trends over time, which could be confounding variables, were adjusted for. Air pollution was defined as daily mean concentration of
ozone. The meteorological factors included the daily mean temperature, wind speed, and relative humidity. In order to prevent time dependent changes and trends from affecting the analysis results, time series variables as well as day of weeks or holidays were also adjusted for.
The statistical model used in this study is as follows: ln#[%&'()*+(,]
= /0 + /1(4)'(+56*)' 8)((9') + /2(<=&>9) + /3(@+>A B9*&5+(,) + /4(D>E*69>=) +>A9F) + G(G), &E @99H) + I1(J98K9')(6'9) + I2(G)(9)
It is reasonable to assume that the health effects of fine dust will take some time to appear as death. In this study, lag models from 0 to 4 days were compared considering the lag effect. The regression coefficients obtained by the statistical model calculations of the fine and coarse
particles were exponentially substituted. These were used as relative risks when the fine coarse particles increased by 10 μg/m3, respectively. The significant level for p value was 0.05.
2. Health effect of fraction of fine particle in the particulate matter
The following model was used to test whether the increase in the fine particle fraction at the constant concentration of PM had a significant effect on the mortality.
ln#[%&'()*+(,]
= /0 + /1(4)'(+56*)' 8)((9') + /2(4'&K&'(+&> &E E+>9 K)'(+5*9) + /3(<=&>9) + /4(@+>A B9*&5+(,) + /5(D>E*69>=) +>A9F)
analyses were performed by R, while the Splines package was used for GAM.
V.
Results
1. General characteristic of air pollution data
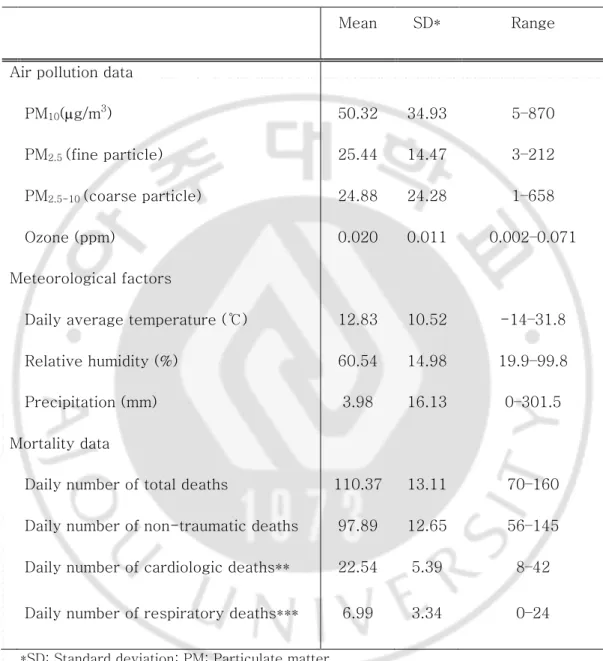
Table 2 summarizes the characteristic of data of air pollution, meteorological factors, and daily deaths by cause from 2006 to 2015.
The average daily death toll in the city over 10 years was 110.37, with death rates of 70 to 160 persons per day. The average number of non-traumatic deaths, except for causes such as trauma, suicide, or external causes was 97.89 persons per day. The mean number of deaths from cardiovascular diseases was 22.54 and the mean number of deaths from respiratory diseases was 6.99.
The mean daily temperature over 10 years was 12.83℃, and the
temperature ranged from 14℃ to 31.8℃. The relative humidity was 60.54% on average, and the average daily precipitation was 3.98 mm.
The average dust level during this period was 50.32µg/m3and the highest density was 870µg/m3, at a minimum of 5µg/m3. The average concentration of fine particles was 25.44µg/m3and the average concentration of coarse particles was 24.88µg/m3
, but the standard deviation of coarse particles was larger than that of fine particles. The highest concentrations of fine and coarse particles were 212µg/m3 and 658µg/m3,respectively, on April 8, 2006. On that day, Korea was affected by Yellow Dust Storm
(Meteorological Agency, 2006). The average concentration of ozone was 0.020 ppm.
Table 2. General characteristic of air pollution data, meteorological factors, and mortality, from 2006 to 2015
Mean SD* Range
Air pollution data
PM10(µg/m3) 50.32 34.93 5–870
PM2.5 (fine particle) 25.44 14.47 3–212
PM2.5-10 (coarse particle) 24.88 24.28 1–658
Ozone (ppm) 0.020 0.011 0.002–0.071 Meteorological factors
Daily average temperature (℃) 12.83 10.52 -14–31.8 Relative humidity (%) 60.54 14.98 19.9–99.8 Precipitation (mm) 3.98 16.13 0–301.5 Mortality data
Daily number of total deaths 110.37 13.11 70–160 Daily number of non-traumatic deaths 97.89 12.65 56–145 Daily number of cardiologic deaths** 22.54 5.39 8–42 Daily number of respiratory deaths*** 6.99 3.34 0–24
*SD: Standard deviation; PM: Particulate matter
**Cardiologic deaths: Deaths due to myocardial infarction, aortic rupture, hypertension, cerebral infraction, or cerebral hemorrhage
2. The change in the concentration of particulate matter by year
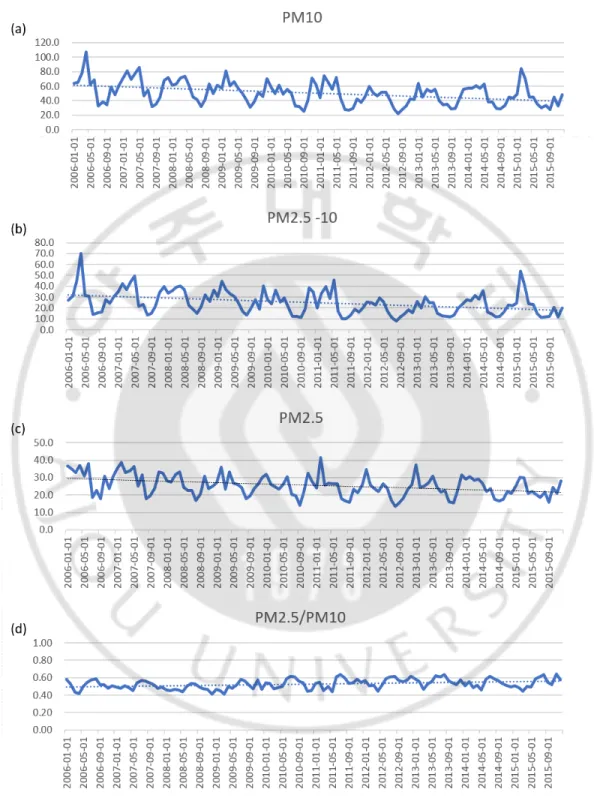
During the study period, the fine dust concentration in Seoul decreased from an average of 60µg/m3 in 2006 to 45µg/m3
in 2015 (Fig. 2). Both fine and coarse particles decreased continuously over the 10–year period. The fraction of the fine particles in the PM10 showed a slight increase, which can be interpreted as further decrease in the coarse particle concentration compared to the reduction in the fine particle concentration. With decreasing concentration of PM, the number of days of high concentration during which the concentration of fine dust increased greatly within a short period of time also decreased (Table 3).
Table 3. The yearly average concentration of PM10, PM2.5-10, and PM2.5, and the
number of days of high concentration
PM10 PM2.5-10 PM2.5 mean* Days over 200* Days over 150* mean Days over 100 Days over 75 mean Days over 100 Days over 75 2006 59.7 3 4 30.3 5 8 29.5 2 4 2007 61.3 3 7 31.3 6 14 30.0 0 4 2008 55.3 1 5 29.8 5 10 25.6 0 4 2009 54.1 2 6 27.9 6 8 26.1 0 4 2010 49.1 1 5 24.2 2 7 24.8 2 5 2011 46.9 3 6 22.8 6 7 24.2 0 4 2012 41.2 0 0 18.6 0 1 22.5 0 0 2013 44.6 0 2 19.6 0 3 25.0 0 2 2014 45.8 0 3 22.2 2 6 23.7 0 2 2015 45.2 2 4 22.2 5 7 23.1 0 0 * µg/m3 PM: Particulate matter
From 2006 to 2009, when the average PM10 concentration exceeded 50 µg/m3, the number of days exceeding the daily average of 150 µg/m3 was 5.5 days per year, whereas it was 3.3 days when the concentration was less than 50 µg/m3. In addition, in 2012 when the annual average concentration reached its lowest level, no day was recorded when the daily average of fine dust concentration exceeded 150 µg/m3. Coarse particles and fine particles showed similar patterns. The difference in annual mean concentration between the particles was not significant, but the number of days of high concentration was much higher with coarse particles.
3. Characteristics of particulate matter concentration according to
season and meteorological factors by each particle size
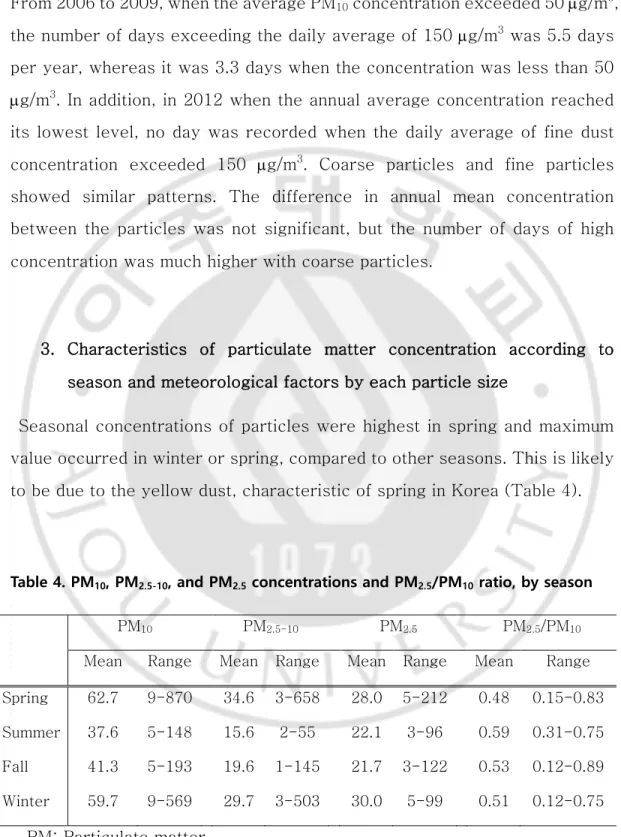
Seasonal concentrations of particles were highest in spring and maximum value occurred in winter or spring, compared to other seasons. This is likely to be due to the yellow dust, characteristic of spring in Korea (Table 4).
Table 4. PM10, PM2.5-10, and PM2.5 concentrations and PM2.5/PM10 ratio, by season
PM10 PM2.5-10 PM2.5 PM2.5/PM10
Mean Range Mean Range Mean Range Mean Range Spring 62.7 9-870 34.6 3-658 28.0 5-212 0.48 0.15-0.83 Summer 37.6 5-148 15.6 2-55 22.1 3-96 0.59 0.31-0.75 Fall 41.3 5-193 19.6 1-145 21.7 3-122 0.53 0.12-0.89 Winter 59.7 9-569 29.7 3-503 30.0 5-99 0.51 0.12-0.75
Coarse particles also showed the highest average and maximum values in spring and winter. The seasonal variation shown for the fine particles was similar, while the standard deviation was smaller than that for the coarse particles. The fraction of PM2.5 in PM10 was high in summer (0.59) and low in spring (0.47). The change in the concentration of these fine and coarse particles depended on how they are generated, and their diffusion,
according to the weather conditions. In order to examine the change in PM concentration according to the change in meteorological factors, correlation analysis was performed and shown in Fig 3.
Since the correlation coefficient is a coefficient of the linear relationship, it is desirable to estimate the general tendency rather than the correlation coefficient or the statistical significance when the linear relationship cannot be assumed.
There seemed to be a negative correlation between precipitation, average wind speed, and maximum wind speed for the concentrations of PM, coarse and fine particles. On the other hand, the air pressure was found to have a positive correlation. The correlation between increased precipitation and decreased particle concentration was more dramatic in coarse particles than in fine particles, and the relationship with wind speed was more apparent in fine particles than in coarse particles.
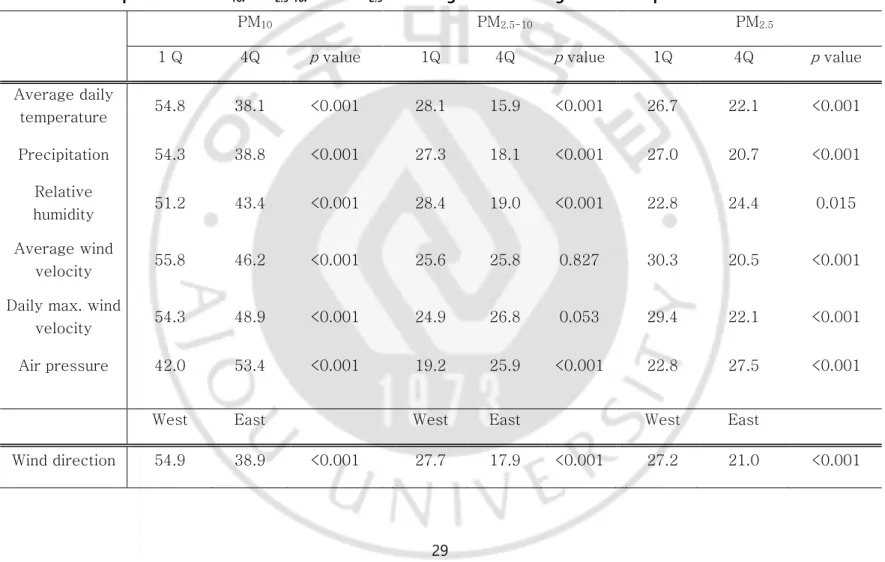
In order to confirm the effects of the concentration of PM on each of the meteorological elements, Table 5 shows the comparison between the concentrations of fine and coarse particles corresponding to the first and fourth quartiles of meteorological factors including daily average
temperature, daily precipitation, relative humidity, average wind speed, and daily maximum wind speed.
Table 5. The comparisons of PM10, PM2.5-10, and PM2.5 according to meteorological factors quartiles
PM10 PM2.5-10 PM2.5
1 Q 4Q p value 1Q 4Q p value 1Q 4Q p value Average daily temperature 54.8 38.1 <0.001 28.1 15.9 <0.001 26.7 22.1 <0.001 Precipitation 54.3 38.8 <0.001 27.3 18.1 <0.001 27.0 20.7 <0.001 Relative humidity 51.2 43.4 <0.001 28.4 19.0 <0.001 22.8 24.4 0.015 Average wind velocity 55.8 46.2 <0.001 25.6 25.8 0.827 30.3 20.5 <0.001 Daily max. wind
velocity 54.3 48.9 <0.001 24.9 26.8 0.053 29.4 22.1 <0.001 Air pressure 42.0 53.4 <0.001 19.2 25.9 <0.001 22.8 27.5 <0.001
West East West East West East
The correlation with daily mean temperature and precipitation was larger in coarse particles than in fine particles, but overall tendency was similar. However, the average coarse particle concentration did not show a
difference in the mean and maximum wind velocities, whereas the mean fine particle concentration was lower when the wind velocity was high.
In Table 5, the concentration difference according to the wind direction could also be confirmed. The average of the PM concentration in the westerly direction of the maximum wind velocity in Seoul was 16µg/m3 higher than the concentration in the east wind. It was confirmed that the average concentration of coarse particles was larger than that of fine particles in accordance with the wind direction, but the overall tendency was the same.
4. Correlation of particulate matter concentration by size of particulate
matter
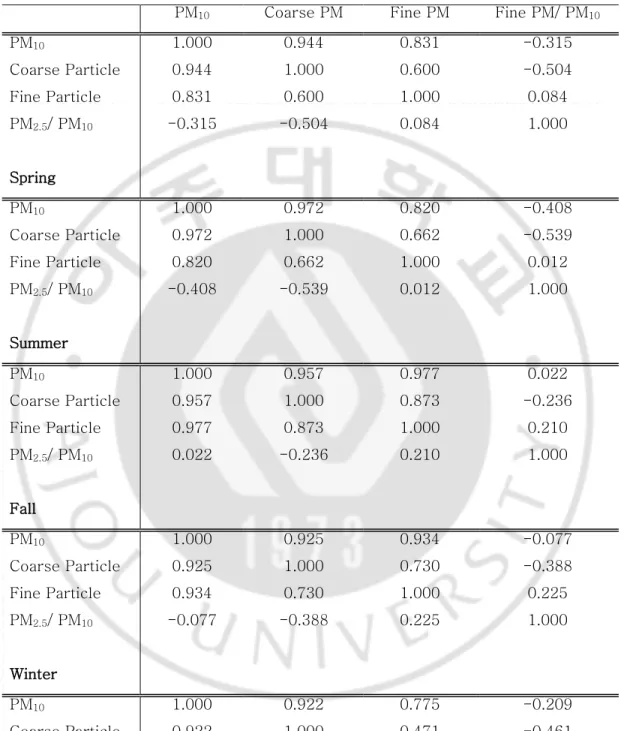
Table 6 shows the results of the correlation analysis with PM, fine particles, coarse particles, and fraction of fine particles in PM. The PM concentration showed a high correlation with the concentration of fine (0.831) and coarse particle (0.944) showed a slightly higher correlation coefficient for coarse compared to the fine particles.
The correlation coefficients differed from season to season. In winter and spring, the correlation coefficients of coarse particles were higher than those of fine particles, while those of fine particles in summer and autumn were 0.977 and 0.934, respectively, higher than those of coarse particles.
Table 6. Correlation between PM10, PM2.5-10, PM2.5,and PM2.5/ PM10 ratio
PM10 Coarse PM Fine PM Fine PM/ PM10
PM10 1.000 0.944 0.831 -0.315 Coarse Particle 0.944 1.000 0.600 -0.504 Fine Particle 0.831 0.600 1.000 0.084 PM2.5/ PM10 -0.315 -0.504 0.084 1.000 Spring PM10 1.000 0.972 0.820 -0.408 Coarse Particle 0.972 1.000 0.662 -0.539 Fine Particle 0.820 0.662 1.000 0.012 PM2.5/ PM10 -0.408 -0.539 0.012 1.000 Summer PM10 1.000 0.957 0.977 0.022 Coarse Particle 0.957 1.000 0.873 -0.236 Fine Particle 0.977 0.873 1.000 0.210 PM2.5/ PM10 0.022 -0.236 0.210 1.000 Fall PM10 1.000 0.925 0.934 -0.077 Coarse Particle 0.925 1.000 0.730 -0.388 Fine Particle 0.934 0.730 1.000 0.225 PM2.5/ PM10 -0.077 -0.388 0.225 1.000 Winter PM10 1.000 0.922 0.775 -0.209 Coarse Particle 0.922 1.000 0.471 -0.461 Fine Particle 0.775 0.471 1.000 0.277 PM2.5/ PM10 -0.209 -0.461 0.277 1.000 PM: Particulate matter
As can be seen from the above results, since the deviation and seasonal variation in fine particles were not much different compared to those of coarse particles; those of coarse particles (which likely occur in winter and spring) seem to be more correlated with the whole PM.Furthermore, since the coarse particle concentrations in summer and autumn were lower than that of fine particles, the correlation coefficient of fine particles to PM was higher.
The correlation coefficient between fine and coarse particles was 0.600. This was also stratified by season. The correlation coefficient between the fine particles and coarse particles in summer was the highest at 0.873, while that in winter was 0.471, which was lower than for other seasons. This means that the occurrence and diffusion of coarse particles in winter were different from that of fine particles, while there was a different pattern in occurrence and diffusion in summer.
5. Analysis of association between particulate matter and mortality
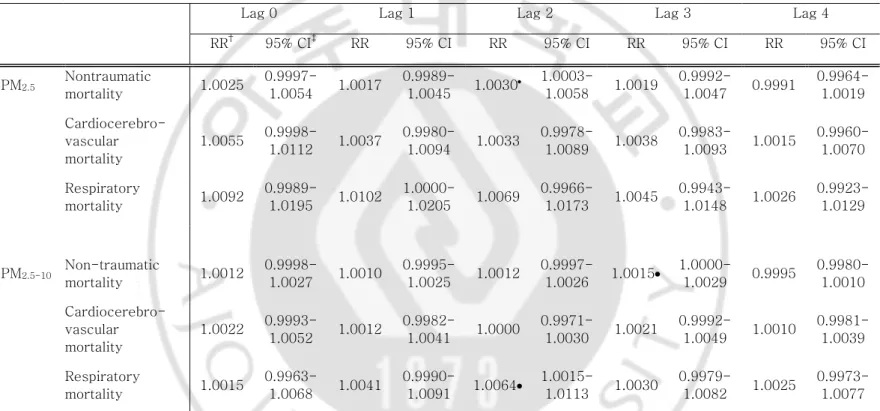
Table 7 shows the correlation between mortality, coarse, and fine particles.
For non-traumatic mortality, the 10µg/m3
increase in fine particles in the 2-day lag model was significant at 1.0030 relative risk. According to the lag effect model, the relative risk of 1.0025 and 1.0017 in the Lag 0 and Lag 1 models, respectively, showed the highest level in the Lag 2 model and then decreased gradually.
The mortality from cardiocerebrovascular disease tended to increase by 0.55% and was associated with increased fine particles in the Lag 0 model, but the association was not statistically significant.
the increase in fine dust on the first day of lag, with the highest relative risk among all the lag models.
The 10 µg/m3 increase in coarse particles was associated with a 0.15% increase in non-traumatic deaths in 3-day Lag model, but no significant effect was seen in cardiocerebrovascular disease mortality. On the other hand, respiratory disease mortality increased by 0.64% in 2-day Lag model.
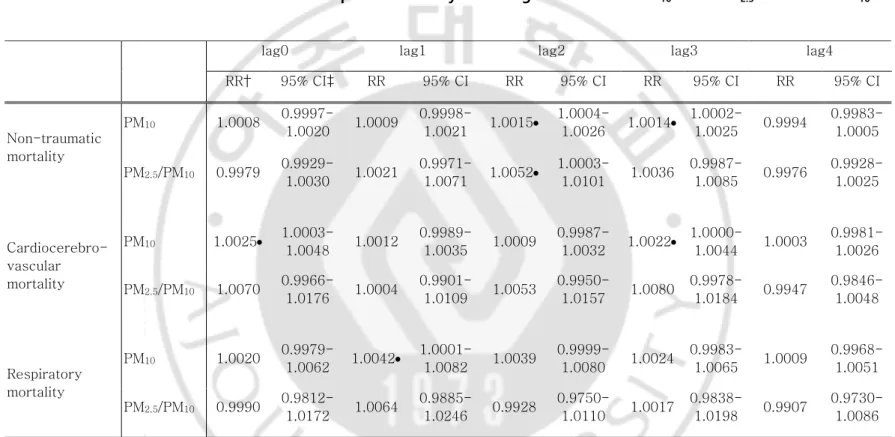
6. Analysis of association between fraction of PM2.5 in PM10 and
mortality
When the fraction of fine particles was adjusted for, PM was significantly associated with a 0.25% increase in the same day cardiocerebrovascular disease mortality, 0.42% increase in respiratory disease mortality after day 1, and a 0.15% increase in non-traumatic mortality after 2 days (Table 8).
A 10% increase in the fraction of fine particles with the PM concentration adjusted for showed a significant correlation with the increase in non-traumatic mortality in the 2-day Lag model, with a relative risk of 1.0052. There were no significant associations with other causes of death or other delayed models.
Table 7. Generalized additive model* of cause-specific mortality according to increase** in PM2.5 and PM2.5-10
Lag 0 Lag 1 Lag 2 Lag 3 Lag 4
RR† 95% CI‡ RR 95% CI RR 95% CI RR 95% CI RR 95% CI PM2.5 Nontraumatic mortality 1.0025 0.9997-1.0054 1.0017 0.9989-1.0045 1.0030• 1.0003-1.0058 1.0019 0.9992-1.0047 0.9991 0.9964-1.0019 Cardiocerebro-vascular mortality 1.0055 0.9998-1.0112 1.0037 0.9980-1.0094 1.0033 0.9978-1.0089 1.0038 0.9983-1.0093 1.0015 0.9960-1.0070 Respiratory mortality 1.0092 0.9989-1.0195 1.0102 1.0000-1.0205 1.0069 0.9966-1.0173 1.0045 0.9943-1.0148 1.0026 0.9923-1.0129 PM2.5-10 Non-traumatic mortality 1.0012 0.9998-1.0027 1.0010 0.9995-1.0025 1.0012 0.9997-1.0026 1.0015• 1.0000-1.0029 0.9995 0.9980-1.0010 Cardiocerebro-vascular mortality 1.0022 0.9993-1.0052 1.0012 0.9982-1.0041 1.0000 0.9971-1.0030 1.0021 0.9992-1.0049 1.0010 0.9981-1.0039 Respiratory mortality 1.0015 0.9963-1.0068 1.0041 0.9990-1.0091 1.0064• 1.0015-1.0113 1.0030 0.9979-1.0082 1.0025 0.9973-1.0077
*Controlled for daily ozone concentration, daily average temperature, daily mean of relative humidity, daily mean of wind velocity, influenza epidemic index, day of week, holiday, and time trend. PM: Particulate matter
Table 8. Generalized additive model* of cause-specific mortality according to increase in PM10** and PM2.5 fraction in PM10***
*Controlled for daily ozone concentration, daily average temperature, daily mean of relative humidity, daily mean of wind velocity, influenza epidemic index, day of week, holiday, and time trend. PM: Particulate matter ** Per 10 µg/m3 increments,
*** Per 10% increments,† RR: Relative risk, ‡ CI: Confidence interval, and • p value <0.05
lag0 lag1 lag2 lag3 lag4
RR† 95% CI‡ RR 95% CI RR 95% CI RR 95% CI RR 95% CI Non-traumatic mortality PM10 1.0008 0.9997-1.0020 1.0009 0.9998-1.0021 1.0015• 1.0004-1.0026 1.0014• 1.0002-1.0025 0.9994 0.9983-1.0005 PM2.5/PM10 0.9979 0.9929-1.0030 1.0021 0.9971-1.0071 1.0052• 1.0003-1.0101 1.0036 0.9987-1.0085 0.9976 0.9928-1.0025 Cardiocerebro-vascular mortality PM10 1.0025• 1.0003-1.0048 1.0012 0.9989-1.0035 1.0009 0.9987-1.0032 1.0022• 1.0000-1.0044 1.0003 0.9981-1.0026 PM2.5/PM10 1.0070 0.9966-1.0176 1.0004 0.9901-1.0109 1.0053 0.9950-1.0157 1.0080 0.9978-1.0184 0.9947 0.9846-1.0048 Respiratory mortality PM10 1.0020 0.9979-1.0062 1.0042• 1.0001-1.0082 1.0039 0.9999-1.0080 1.0024 0.9983-1.0065 1.0009 0.9968-1.0051 PM2.5/PM10 0.9990 0.9812-1.0172 1.0064 0.9885-1.0246 0.9928 0.9750-1.0110 1.0017 0.9838-1.0198 0.9907 0.9730-1.0086
VI.
Discussion
The characteristics of PM, fine, and coarse particles measured from 2006 to 2015 in Seoul and their association with mortality were analyzed in this study.
1. The difference in concentration of fine and coarse particle
Season is a factor to consider in analyzing the characteristics of PM. The concentration of PM in Korea was high in winter and spring, and relatively low in summer and autumn. In addition, unlike other seasons, the coarse particles were much higher than the fine particles in spring.
These seasonal differences can be attributed mainly to the
meteorological features of the seasons (Kim, 2014). In Korea, the humidity and precipitation in the summer is higher than the winter; therefore,
precipitation of particles occurs. In this study, precipitation was shown to have association with low concentration of both coarse and fine particles.
In addition, if the atmospheric mixing altitude is lowered in winter and the air does not diffuse to the atmosphere, the concentration of fine dust tends to increase. In this study, mean and maximum wind speeds were used as indicators to reflect the diffusion in the atmosphere. Although the
concentration of fine particles was much lower at high than at low wind speed, there was no significant difference in the concentration of coarse particles. This may be related to coarse particles originating from natural sources such as dirt, pollen, among others. However, since the average and the maximum wind speed cannot be regarded as an index that fully reflects the atmospheric diffusion, it cannot be concluded that the wind does not
increase the coarse particle concentration. Further research is needed to identify the relationship between the occurrence and diffusion of each particle, as well as the wind speed and other meteorological factors.
In addition to meteorological factors, there are likely to be factors of occurrence or of influx, such as seasonal factors. First, due to
northwestern winter winds, the concentration might have increased due to the influence of particles from adjacent cities and countries. Since the wind direction used in this study was the direction when the maximum wind speed was recorded, it is difficult to represent the wind direction of the day, but the overall tendency can be confirmed. In this study, both coarse and fine particles were higher when the east wind was blowing than when the west wind was blowing in Seoul. At the west of Seoul, there are
sources that use fossil fuels such as Incheon, Siheung industrial parks, and thermal power plants, as well as China, across the sea. Moreover, there are few industrial facilities and fewer inhabitants in the east. However,
considering the characteristics of the wind direction and its relation to other meteorological factors, the wind direction cannot be a decisive factor for PM concentration. There is need to consider the overall influence of various factors such as temperature, wind direction, wind speed, and the arrangement of air pressure.
In this study, the correlation between fine and coarse particles was found to be lower in winter and spring than in summer and autumn. This may be due to the increase and decrease of fine and coarse particle concentrations in winter and spring, which differs from that at other seasons. Assuming that the effect of weather conditions on each particle concentration will not differ from season to season, the conditions under which diffusion occurs are the same at different seasons. Thus, it can be assumed that this change
in the correlation is due to differences in the occurrence patterns. In
winter, the use of fossil fuels such as heating and electricity increases, and the coarse particles increase in spring was due to the occurrence of yellow dust and pollen. Choi (2012) studied the seasonal variation characteristics of fine particles and found that during the winter, nitrate ions, ammonium ions, and sulfurous acid gas by fossil fuel combustion increased in the fine particle components (Choi, 2012). It is thought that differences in the source of occurrence caused the differences in the occurrence patterns.
2. The difference in concentration of fine and coarse particle
Daily number of deaths in Seoul was approximated as 100 non-traumatic deaths, 20 cardiocerebrovascular deaths, and 10 respiratory deaths.
Applying the relative risk of fine particles and coarse particles to mortality here, the 10 µg/m3
increase in fine particles was associated with an increase in non-traumatic deaths by 0.3, while the 10 µg/m3
increase in coarse particles after 3 days was associated with 0.1 non-traumatic deaths, and 0.06 deaths from respiratory diseases 2 days later.
Several studies have reported that coarse particles have an effect on respiratory disease deaths (Host, 2008; Wang, 2013). However, some studies claim that this effect disappears when the fine particle
concentration is adjusted for (Lee et al., 2015; Park, 2011; Roger et al., 2008)
In the present study, the results of the adjusted model with fine and coarse particle concentration were not presented in the current text because of the collinearity. However, the increase in coarse particle was
after adjustment for fine particles.
One of the reasons for differences in the relative risk of coarse particles in each study can be found in the definition of the disease. Park (2011) reported that the effect of coarse particles on the death was removed by adjustment for fine particles in a study on the relationship between PM and deaths in Seoul (Park, 2011). Cardiologic deaths included all cardiovascular disease cases, while respiratory deaths included all respiratory disease cases reported in that study.However, in the present study, we redefined the respiratory and cardiocerebrovascular diseases selectively by
determining whether they were reported to be exacerbated by PM or were highly likely to be (Bouazza et al., 2018; Corlin et al., 2018; Liu et al. 2017; Niu et al., 2015; Turin et al., 2012). This selective definition considering the mechanism of disease would be necessary to prevent statistical errors and to obtain more accurate scientific results.
In particular, the result that the increase in coarse particle concentration was associated with increased mortality from respiratory diseases is well explained by the mechanism of health impact of PM (Schwarze et al., 2016; Simkhovich et al., 2008). Fine particles can penetrate into the blood
vessels, causing secretion of systemic inflammatory reactants, affecting autonomic nerve system, and stimulating blood vessel epithelial cells to increase blood pressure, which can affect cardiac function. Coarse particles can be deposited in the trachea, bronchi or alveolar, and can cause an inflammatory reaction in the respiratory system.
In this study, although the tendency was observed, it was characterized by no significant association of fine and coarse particles with
cardiocerebrovascular disease mortality. Fine particles have been reported to be involved in the induction and aggravation of cardiocerebrovascular disease due to its mechanism and epidemiology. Bae (2014) reported the relationship between an increase of 10µg/m3 of PM2.5 and the total deaths, and deaths due to cardiovascular diseases, which was 1.0076 and 1.0163, respectively (Bae, 2014). The study of Bae (2014) used the same data sources and geographic region as the current study. However, the period of data was from 2006 to 2010. Considering that the concentration of fine particles has been steadily decreasing over the years and the fact that fine particle measuring system was constructed in early 2000, there may be errors in the initial data, and differences in results of each study may result from differences in the study period. In addition, the selective definition of cardiocerebrovascular disease in this study may be one of the reasons for the difference. There were also studies where a significant increase in cardiovascular disease or stroke was not shown (Burnett et al., 1997; Villeneuve et al., 2006). Chang et al. (2015) investigated the relationship between fine particles and hospitalization due to cardiocerebrovascular disease. In the cross-sectional study design, hospitalization was increased due to increase in fine particles in the cool season, but no significant effect was observed in the hot season (Chang et al., 2015).
The reason for the lack of association with cardiocerebrovascular disease mortality in this study may be due to the stronger effect of other factors affecting it. Particularly in winter, low temperatures are associated with increased incidence of myocardial infarction (Näyhä, 2002). However, the adjustment for the daily mean temperature, as in this study may not
possible that the survival rate of acute cardiocerebrovascular disease was higher than that of the former, according to the emergency medical system developed in Korea. There is a need for complex analysis and research on the health effects of fine particles on recent occurrence and deaths
compared with the past. In addition, considering that the relative risk due to the increase in fine particle concentration was relatively high at 1.0055 on the Lag day 0, further studies in larger populations can be expected to provide a better quantitative assessment of the association with
cardiovascular disease mortality.
3. Comparison of relative risk of fine and coarse particles
The correlation between mortality and the size of particles showed that microparticles had the highest relative risk compared to coarse particles, as reported in other studies (Brown, 2001).
Based on this, it can be assumed that the higher the fraction of fine particles in the PM the greater the health effect. In this study, a 10%
increase in the fraction of fine particles was found to be associated with an increase in non-traumatic mortality at 2 days, and the relative risk was 1.0052.
In other words, when the daily incidence of non-traumatic deaths in Seoul is assumed to be approximately 100, a 10% increase in the fraction of fine particles will cause an average of 0.5 deaths a day. With the fact that an increase in the fraction of fine particles in the same fine dust
concentration can worsen the health effects of fine particles, there is need for effective communication to the public, this can help in motivating behavioral change to overcome the concern regarding air pollution.
However, further research is needed to determine how the health effects of fine particle fraction vary with the concentration of PM.
4. Management of Particulate matter
The Ministry of Environment's fine dust management policy is shifting from a paradigm centered on general air pollutants to a paradigm centered on human risk reduction (Ministry of Environment, 2018). As a result, the management standard for fine particles, which are known to have a greater risk to human health, has been strengthened to 35 µg/m3
at present from an average daily dose of 50 µg/m3
. As shown in this study, because the
relative risk and health effects of fine particles tend to be greater than that of coarse particles, a change in policy guideline is desirable.
However, the present study suggests that the health effects of PM may be due to the health hazards due to coarse particles as well as fine
particles. Especially, it is thought that the management of coarse particles is more necessary than of fine particles, in order to prevent death from respiratory diseases. In addition, considering the fact that coarse particles has more high-concentration days, coarse particle management may be more effective in relieving anxiety due to high concentrations of PM.
Efforts to reduce the concentration of fine particles can be accompanied by a reduction in the concentration of coarse particles. However, in order to effectively manage fine particles and coarse particles in winter, which have different source for each size of particles, it is essential to take appropriate control measures for each. For example, in order to reduce the
concentration of coarse particles, efforts may be made to reduce the dust on the road or scattering of dust at construction sites, or to avoid tree
of fine particles, emission reduction policies for automobile exhaust gas and power plants or factories will be needed. It is also necessary to take
measures to prevent disease development and deterioration through
management of population groups vulnerable to respiratory diseases at the time when the coarse particles are increased.
5. Limitation and strength
The limitations of this study are as follows:
First, there is the limitation based on statistical data. In this study, we used the statistical data on causes of death provided by the National Statistical Office, and confirmed the number of daily deaths in Seoul by using the address in the administrative area at the time of death described in this document. However, if the address in the administrative district is Seoul, participants may not necessarily reside in Seoul. Even if someone lives in Seoul, his/her workplace or residence may be in Gyeonggi Province or other provinces. The data obtained for this study did not reveal the living range of each deceased person prior to his death. Therefore, there is a limit to the relationship between the actual exposure and the occurrence of death.
In this study, the representative concentration of PM in Seoul was calculated to analyze the total deaths. Thus, PM concentration can be differentiated and the regional characteristics affecting the fatalities may also be different. This should be considered in further studies.
In addition, the cause of death listed in the Cause of Death Statistics may not be accurate. This is because there may be cases where the underlying disease was not taken into consideration when the death certificate, which
is the basis for the cause of death, is described (Yoon et al., 2017). However, one report indicates that the cause of death statistics is a representative country data, and its reliability has increased due to improved diagnostic technic.
Second, in this study, statistical analysis was performed using the number of daily deaths in order to know the health effect. It is possible that the relative risk was underestimated due to some diseases with low mortality rate depending on the disease. It is necessary to accurately assess the health effects of fine and coarse particles by examining various health indicators, such as the number of visitors per day to the emergency room and the number of hospitalizations, as well as daily number of deaths. In addition to the deaths due to acute health effects, further studies are
required such as analysis of the effects of long-term exposure to cancer or aggravation of chronic diseases leading to death.
Third, the lack of evaluation of vulnerable population like the elderly, children, and women is another limitation. The data used in this study are cause specific deaths of the total population in Seoul in one day. In this study, it is possible that the relative risk was diluted because it was not stratified by age or gender for statistical stability and comprehensive evaluation. The relative risk of cardiocerebrovascular diseases that were not described in this study is also likely to be evident in vulnerable populations, and thus, further research is essential.
used as confounder variables to adjust for this, but there may be more social factors that may affect seasonal changes of PM concentration mortality. In addition, more accurate quantitative evaluation can be made considering social events such as the epidemic of the H1N1 influenza in 2009 and the excessive death caused by heatwave.
Despite these limitations, this study has demonstrated that research studies on coarse particles are insufficient when compared with those for fine particles and the observed health effects. In addition, comparing the fine with the coarse particles, the health effect and the difference in mechanism between each size of particles could be examined, and the effect of fine particle fraction on mortality was quantitatively analyzed for the first time in this study.
Because it is important not only to improve the management but also communication and accurate information on PM, it is necessary to comprehend various studies related to it, including this study, and to protect the health of citizens and to relieve anxiety.
VII.
Conclusion
In this study, the health effects of fine and coarse particles were evaluated based on the PM data collected in Seoul from 2006 to 2015.
Fine and coarse particles showed a decreasing trend from 2006 to 2015. Concentrations of these particles changed significantly according to season and weather conditions, and the correlation between fine and coarse
particles was 0.873 in summer and 0.471 in winter.
Analysis of the effects of fine and coarse particles on deaths using the generalized additive model showed that coarse particles were associated with a 0.15% increase in non-traumatic deaths per 10 µg/m3 in the 3-day Lag effect model. Respiratory disease mortality was associated with coarse particles increase of 0.64% after 2 days. Fine particles were associated with a 0.30% increase in non-traumatic deaths after 2 days with an increase of 10 µg/m3. There was no significant increase in deaths due to cardiocerebrovascular and respiratory system diseases, but there was a tendency of 0.55% and 1.02% increase in deaths on day 0 and day 1, respectively, with an increase in fine particles of 10 µg/m3.
The increase of 10% in the fraction of fine particles was associated with an increase of about 0.52% of non-traumatic deaths after two days.
The management of fine dusts is considered to be most effective in the case of fine particles with the highest health risk. However, coarse
health effects, which differ from those of fine particles, and can be present in different forms. There is also a need for the considerations on
management.
In the management of fine and coarse particles, there is a need for a different approach considering the differences in sources and
characteristics. In addition, since the health effects of PM appear
differently depending on the particle size. Management measures that can combine particle sizes and precise risk communication to the public are needed.
This study is meaningful in that it provided the basic data necessary to develop such policies and to clarify the health effects of PM. In order to prevent the mortality health effects, further researches that analyze the vulnerable groups and study the diseases according to the mechanism are necessary.
VIII.
References
Adams K et al., “Particulate Matter Components, Sources, and Health: Systematic Approaches to Testing Effects,” Journal of the Air & Waste Management Association 65, no. 5 (March 19, 2015): 544–58.
An Z et al., “Impact of Particulate Air Pollution on Cardiovascular Health.,” Current Allergy and Asthma Reports 18, no. 3 (February 22, 2018): 15.
Atkinson RW et al., “Epidemiological Time Series Studies of PM2.5 and Daily Mortality and Hospital Admissions: a Systematic Review and
Meta-Analysis,” Thorax 69, no. 7 (June 10, 2014): 660–65.
Bae HJ, “Effects of Short-Term Exposure to PM10 and PM2.5 on Mortality in Seoul,” Korean Journal of Environmental Health Sciences 40, no. 5 (2014): 346–54.
Bell ML et al., “A Retrospective Assessment of Mortality From the London Smog Episode of 1952: the Role of Influenza and Pollution.,” Environmental Health Perspectives 112, no. 1 (January 1, 2004): 6–8.
Bell ML et al., “Associations of PM₂.₅ Constituents and Sources with Hospital Admissions: Analysis of Four Counties in Connecticut and Massachusetts (USA) for Persons ≥ 65 Years of Age.,” Environmental Health Perspectives 122, no. 2 (February 2014): 138–44.