Thy-1
+
Cancer-associated
Fibroblasts Adversely Impact Lung
Cancer Prognosis
Mark J. Schliekelman
1, Chad J. Creighton
2,3, Brandi N. Baird
4, Yulong Chen
4, Priyam
Banerjee
4, Neus Bota-Rabassedas
4, Young-Ho Ahn
4,5, Jonathon D. Roybal
4, Fengju Chen
2,
Yiqun Zhang
2, Dhruva K. Mishra
6, Min P. Kim
6, Xin Liu
4, Barbara Mino
7, Pamela Villalobos
7,
Jaime Rodriguez-Canales
7, Carmen Behrens
7, Ignacio I. Wistuba
7, Samir M. Hanash
1,8&
Jonathan M. Kurie
4Cancer-associated fibroblasts (CAFs) regulate diverse intratumoral biological programs and can promote or inhibit tumorigenesis, but those CAF populations that negatively impact the clinical outcome of lung cancer patients have not been fully elucidated. Because Thy-1 (CD90) marks CAFs that promote tumor cell invasion in a murine model of KrasG12D–driven lung adenocarcinoma (KrasLA1), here we postulated that human lung adenocarcinomas containing Thy-1+ CAFs have a worse prognosis. We first examined the location of Thy-1+ CAFs within human lung adenocarcinomas. Cells that co-express Thy-1 and α-smooth muscle actin (αSMA), a CAF marker, were located on the tumor periphery surrounding collectively invading tumor cells and in perivascular regions. To interrogate a human lung cancer database for the presence of Thy-1+ CAFs, we isolated Thy-1+ CAFs and normal lung fibroblasts (LFs) from the lungs of KrasLA1 mice and wild-type littermates, respectively, and performed global proteomic analysis on the murine CAFs and LFs, which identified 425 proteins that were differentially expressed. Used as a probe to identify Thy-1+ CAF-enriched tumors in a compendium of 1,586 lung adenocarcinomas, the presence of the 425-gene signature predicted a significantly shorter survival. Thus, Thy-1 marks a CAF population that adversely impacts clinical outcome in human lung cancer. In most tissues, fibroblasts are the primary stromal cells and are recognized by their spindle-shaped morphology and the absence of markers that define epithelial, immunologic, and other cell types. During wound healing and in pathological conditions such as fibrosis and cancer, fibroblasts acquire an activate phenotype with myofibro-blastic features and, in cancer, are referred to as cancer-associated fibroblasts (CAFs)1. CAFs regulate the activities of immune cells, tumor cells, and endothelial cells, a multi-functionality that could result from the presence of multiple CAF lineages with distinct intratumoral functions. In support of this conclusion, lung cancer patient prognosis is improved by the presence of PDGFR-α/β+ CAFs and worsened by extracellular matrix (ECM)
pro-teins commonly secreted by myofibroblastic CAFs2–6. Because factors secreted by CAFs can enhance tumor cell proliferation and invasion, promote angiogenesis, and suppress anti-tumor immunity, CAFs are an attractive target for cancer prevention and treatment7. Hence, studies are warranted to elucidate distinct CAF populations and their biological roles during tumorigenesis.
1Division of Public Health Sciences, Fred Hutchinson Cancer Research Center, Seattle, Washington, United States
of America. 2Department of Medicine and Dan L. Duncan Cancer Center, Baylor College of Medicine, Houston,
Texas, United States of America. 3Department of Bioinformatics and Computational Biology, University of Texas
MD Anderson Cancer Center, Houston, Texas, United States of America. 4Department of Thoracic/Head and Neck
Medical Oncology, University of Texas MD Anderson Cancer Center, Houston, Texas, United States of America.
5Department of Molecular Medicine and Tissue Injury Defense Research Center, Ewha Womans University School
of Medicine, Seoul, Korea. 6Department of Surgery, Houston Methodist Research Institute, Houston, Texas, United
States of America. 7Department of Translational Molecular Pathology, University of Texas MD Anderson Cancer
Center, Houston, Texas, United States of America. 8Department of Clinical Cancer Prevention, University of Texas
MD Anderson Cancer Center, Houston, Texas, United States of America. Mark J. Schliekelman and Chad J. Creighton contributed equally to this work. Correspondence and requests for materials should be addressed to J.M.K. (email: jkurie@mdanderson.org)
Received: 12 December 2016 Accepted: 22 June 2017 Published online: 25 July 2017
Thy-1 (CD90) is a heavily N-glycosylated cell surface protein that is expressed on a variety of tumor cells and normal cell types (e.g., fibroblasts, neurons, and endothelial cells) and has been shown to mediate cell-cell inter-actions by binding to integrins in a variety of tissue contexts8, 9. In the venous circulation, Thy-1 facilitates the attachment of tumor cells to endothelial cells and has been implicated in metastasis10. Thy-1 forms a tri-molecular complex with α5β1 integrin and syndecan-4 and supports β1 integrin- and syndecan-4-mediated mechanosign-aling in melanoma cells11. In human lung cancers, a population of CAFs has been isolated that expresses Thy-1, α-smooth muscle actin (αSMA), and fibroblast activation protein (FAP), but fails to express CD45 and CD11b, a phenotype consistent with that of an activated myofibroblast, and elicits either a contact-dependent enhancement or suppression of tumor-associated T cell activation12, 13. Similarly, a Thy-1+ CD45− Epcam− population of CAFs
has been isolated from KrasLA1 mice, which develop multifocal lung adenocarcinomas owing to somatic
activa-tion of a latent KrasG12D allele14; these CAFs exhibit biochemical and morphological properties of myofibroblasts, secrete diverse growth factors and pro-angiogenic and immunosuppressive cytokines15, and promote the invasive properties of lung adenocarcinoma cells derived from KrasLA1 mice in co-culture studies15. These features of CAFs are not due to somatic activation of the latent KrasG12D allele, which is in germline configuration in CAFs15. The lung parenchyma of wild-type mice and that of humans contain Thy-1+ lung fibroblasts (LFs)16. In contrast to CAFs, Thy-1+ LFs exhibit no myofibroblastic features or pro-invasive activity and secrete fewer cytokines in
co-culture with tumor cells15. Thus, the biological properties of Thy-1+ CAFs and LFs are distinct, and additional
studies are warranted to determine whether Thy-1+ CAFs promote lung tumorigenesis.
Here, we postulated that the presence of Thy-1+ CAFs confers a worse prognosis in human lung
adenocarci-noma. To test this hypothesis, we initially examined the intratumoral location of Thy-1+ CAFs, which were found
at the invasive front and in perivascular regions. Given that CAFs can generate gene expression signatures that have prognostic value in tumor transcriptomic studies17, we interrogated a human lung cancer database for the presence of Thy-1+ CAFs by performing global proteomic analysis on murine Thy-1+ CAFs and LFs, which
iden-tified 425 proteins that were differentially expressed. The 425-gene signature was used to probe a compendium of 1,586 lung adenocarcinomas, which showed that the presence of the 425-gene signature was correlated with a worse prognosis. These findings suggest that Thy-1 marks a CAF population that adversely impacts clinical outcome in human lung adenocarcinoma.
Results
Localization of Thy-1
+cells within tumor stroma.
Flow cytometric studies have detectedThy-1-expressing (Thy-1+) CAFs in human lung cancers13, but their intratumoral location remains unclear. To address this question, we initially examined the intratumoral location of Thy-1+ cells and whether Thy-1+ cells co-express
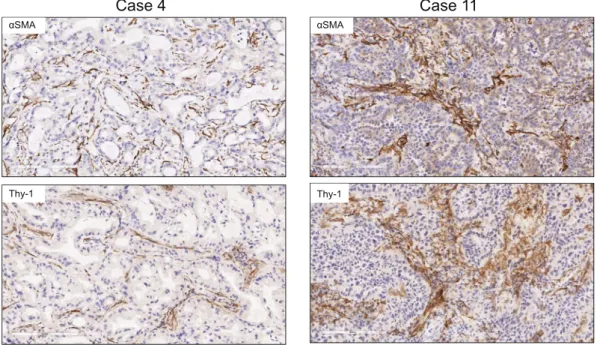
αSMA, a CAF marker. Thy-1 and αSMA were detected in tumor stroma by immunohistochemical analysis of human lung cancers (Fig. 1), and quantification of cells that express Thy-1 or αSMA within multiple microscopic fields showed that their levels were positively correlated (P = 0.018, r = 0.665) (Fig. 2). Thy-1+ cells were present
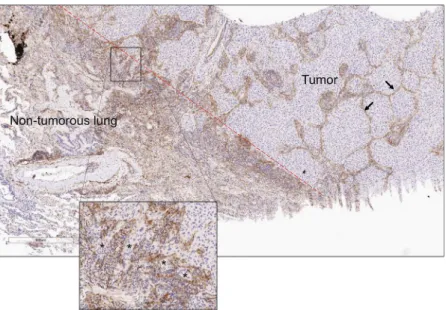
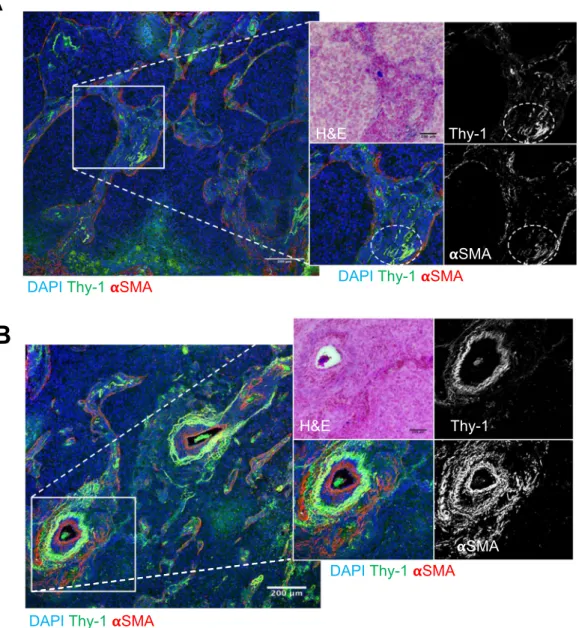
in band-like stromal structures (arrows, Fig. 3) and at the invasive front on the tumor periphery (insets, Fig. 3). By confocal microscopic analysis, cells that expressed Thy-1 or αSMA or that co-expressed Thy-1 and αSMA were detected within stromal bands (Fig. 4A) and in perivascular regions consistent with a pericyte-like cell (Fig. 4B).
1
1
e
s
a
C
4
e
s
a
C
αSMA Thy-1 αSMA Thy-1Figure 1. Detection of cells that express Thy-1 or αSMA in tumor stroma. Images of representative human lung adenocarcinomas with low levels (case 4) or high levels (case 11) of Thy-1 and αSMA. Tissues were subjected to immunohistochemical analysis and counterstained with hematoxylin. Cells that stain positively for Thy-1 or αSMA (brown) are located within stroma surrounding tumor cells (blue). Scale bar, 200 μm.
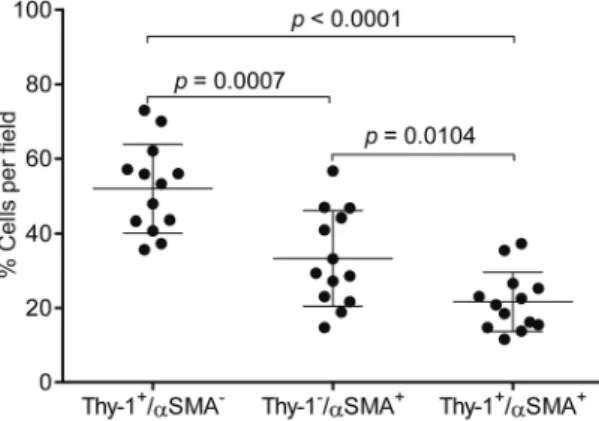
By quantification, cells with a CAF phenotype (Thy-1+ αSMA+) accounted for approximately 20% of cells per
microscopic field, whereas Thy-1+ αSMA− cells (e.g., immunologic cells) and Thy-1− αSMA+ cells (e.g., other
fibroblast subsets) were significantly more numerous (Fig. 5). These findings support the presence of Thy-1+
CAFs within tumor stroma.
An expression signature for the detection of Thy-1
+CAFs in tumors.
To determine whether thepresence of Thy-1+ CAFs impacts clinical outcome, we sought to probe publicly available lung cancer
transcrip-tomic databases for evidence of Thy-1+ CAF-enrichment. Reasoning that a proteomic signature will exclude from
the analysis those genes in the transcriptomic databases that are not differentially expressed at the protein level, we performed global proteomic analysis of matrix extracts prepared from Thy-1+ CAFs and LFs to identify those
proteins that are up- or down-regulated in CAFs and then used that protein signature to probe transcriptomic databases.
Figure 2. Positive correlation of Thy-1- and αSMA-expressing cells in tumor stroma. Scatter plot shows the percentages of cells per microscopic field per tumor that stain positively with anti-Thy-1 or anti-αSMA antibodies. Consecutive tissue sections were stained with anti-Thy-1 or anti-αSMA antibodies. Results represent mean values determined from multiple microscopic fields per tumor. Each dot represents a single tumor. P and r values, Pearson’s correlation analysis.
* * * * Tumor Non-tumorous lung
Figure 3. Thy-1-expressing cells localize within the tumor interstitium and on the tumor periphery. Image of human non-small cell lung cancer subjected to immunohistochemical analysis to detect Thy-1. Tissues counterstained with hematoxylin (blue). Cells that stain positively for Thy-1 (brown) are located within interstitial stromal bands (arrows) or at the boundary of tumor and non-tumorous lung tissues (dashed red line), a site of collectively invading tumor cells (asterisks, inset).
Thy-1+ CAFs and LFs were isolated from the lungs of KrasLA1 mice and wild-type littermates, respectively, for
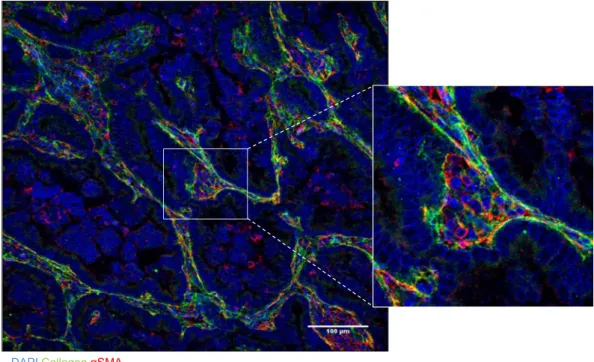
the preparation of matrix extracts that were subjected to LC-MS/MS for comparison of proteomes by spectral counting. Of the 2,361 unique genes (2,441 IPI’s) identified (at least 2 peptides per gene), 1,197 genes (1,164 IPI’s) overlapped between CAFs and LFs, and 425 proteins were differentially expressed (G-Test > 3.9), including 223 upregulated and 202 downregulated proteins (Supplementary Tables 1 and 2). These included intracellular and secreted proteins, indicating that fibroblast matrix preparations were contaminated by the contents of lysed cells. The differentially expressed proteins were enriched in diverse Gene Ontology terms (Fig. 6). The up-regulated CAF peptides demonstrated enrichment in, among other terms, “enzyme binding” (e.g., IGF2R, BRCA1, PLAUR), “tropomyosin binding” (e.g., CNN3, TMOD3, CALD1), “chromatin” (e.g., HMGN1, HMGN2, PDS5A), and “tight junction” (e.g., MTDH, ARHGAP17, CXADR). To identify extracellular matrix molecules secreted by CAFs, we reanalyzed the proteomic profiling results using less strict criteria (G-test > 1.65) and identified multi-ple collagen isoforms (Col1a2, Col5a1, and Col5a3) that were secreted more abundantly by CAFs than LFs; this finding was validated by confocal microscopic analysis of a human lung adenocarcinoma, which showed papil-lary tumor structures surrounded by collagenous stroma containing αSMA+ cells (Fig. 7). The down-regulated
DAPI
Thy-1
SMA
H&E
Thy-1
DAPI
Thy-1
SMA
SMA
DAPI
Thy-1
SMA
H&E
Thy-1
DAPI
Thy-1
SMA
SMA
A
B
Figure 4. Stromal cells that co-express Thy-1 and αSMA. Merged fluorescence micrographs of human lung adenocarcinoma tissue sections co-stained with antibodies that detect Thy-1 or αSMA (pseudocolored green and red, respectively). Nuclei were counterstained with DAPI (pseudocolored blue). Illustrated at higher magnification (inset) are fluorescence and bright field micrographs of a stromal region (A) and a perivascular stromal region (B). The insets contain bright field image of tissues stained with hematoxylin and eosin (top left) and fluorescence micrographs of anti-Thy-1 and -αSMA shown as single channel images (grey scale, top and bottom right) and as merged images (pseudocolored, bottom left). Cells that co-express Thy-1 and αSMA are yellow. Regions of co-localization in Fig. 4A are indicated (ovals). Scale bar, 200 μm.
peptides were enriched in, among other terms, “respiratory gaseous exchange” (e.g., NDFUA12, SFTPB, SFTPD), “proteinaceous extracellular matrix” (e.g., COL6A1, COL6A3, COL6A2, FBN1), “mitochondrial envelope” (e.g., TOMM20, HADHB, COX5B), “cell-cell adhesion” (e.g., COL6A2, VNN1, DSP, ITGA8, CDH1) and “protein transport” (e.g., ERC1, LRP1B, RRBP1, SANP23) (Supplementary Table 3). In addition, several basement mem-brane components were down-regulated, including basement memmem-brane-associated proteoglycans nidogen-1 and laminin subunits LAMA5 and LAMC1. Thus, the CAF and LF proteomes contained widespread differences.
A worse prognosis for lung adenocarcinoma patients with the Thy-1
+CAF expression
signa-ture.
Twelve independent cohorts of lung adenocarcinoma patients for which both gene expression and clin-ical outcome data were publicly available18–29 were scored based on the manifestation of the 425-gene signature in primary lung tumors, using a “t-score” metric as previously described30, where the overall t-score is high in a profile where the genes up in the CAF expression signature are relatively high while the genes down in the signa-ture are relatively low. The association of the signasigna-ture in lung tumors with patient survival was evaluated by both Figure 5. Quantification of cells that express Thy-1 or αSMA or both. Scatter plot shows the percentages of cells per microscopic field that are Thy-1+/αSMA−, Thy-1−/αSMA+, or Thy-1+/αSMA+. Each dot represents a singlemicroscopic field from the same tumor specimen illustrated in Figs 4 and 5. A total of 13 randomly chosen microscopic fields were analyzed. Mean ± SD (bar and whiskers) from the 13 microscopic fields. P values, two tailed unpaired t test.
Figure 6. Gene Ontology term enrichment in the CAF proteomic signature. The 10 most highly enriched terms among peptides up-regulated in CAFs (top pie chart) or down-regulated in CAFs (bottom pie chart) relative to LFs. Pie segment size is proportional to the gene numbers represented in each term.
Kaplan-Meier plot (taking the top third, bottom third, and middle third of signature scores) and by univariate Cox (which evaluated the t-scores as a continuous measure, without the need for binning). We observed a corre-lation between the presence of the CAF signature and reduced overall survival duration (Fig. 8A), which reached statistical significance in three of the individual cohorts and as a “compendium” of all twelve cohorts (Fig. 8B); with the larger numbers providing greater power in the compendium dataset, clear survival trends may be evi-dent that might have been missed in individual studies involving much fewer cases. This result indicates that the
DAPI Collagen αSMA
Figure 7. αSMA+ cells localize within collagenous stroma in a human lung adenocarcinoma. Merged
fluorescence micrographs of a human lung adenocarcinoma tissue section co-stained with antibodies that detect type I collagen or αSMA (green and red, respectively). Nuclei were counterstained with DAPI (blue). Zoom (right) of boxed area shows a region of collagenous stroma that contains αSMA+ cells and surrounds
papillary tumor structures.
A
B
0 0.1 0.2 0.3 0.4 0.5 0.6 0.7 0.8 0.9 1 0 50 100 150 200 250 Survival Probabili tyOverall survival (months)
bottom third intermediate top third
n = 1,586
Log rank p = 4.8E-07
dataset n beta p-value
Beer 86 pos 0.039 Bhattacharjee 84 pos 0.572 Bild 58 pos 0.344 Botling 106 pos 0.217 Chitale 193 pos 0.027 Hou 40 pos 0.535 Okayama 204 pos 0.194 Shedden 354 0.006 Tang 133 pos 0.181 Tomida 117 pos 0.055 Zhu 28 neg 0.196 compendium 1586 pos <0.0002 Sato 183 pos 0.255 pos
Figure 8. The presence of the CAF signature is correlated with a worse prognosis in human lung cancer. Survival analysis of lung adenocarcinoma patients, comparing the differences in risk between tumors, according to degree of manifestation of a CAF proteomic signature (in terms of corresponding mRNA patterns). Kaplan-Meier plot compares top third (“strong manifestation”), bottom third (“weak manifestation”), and middle third (“intermediate”) for a compendium of 12 independent lung adenocarcinoma cohorts. P-values by log-rank test. (B) Table shows correlations by univariate Cox, for each individual array dataset examined, as well as for a “compendium” of all available datasets (featured in Kaplan-Meier plot). Positive beta denotes correlation with worse patient prognosis.
gene expression signature associated with CAFs is also associated with more aggressive lung adenocarcinoma in patients.
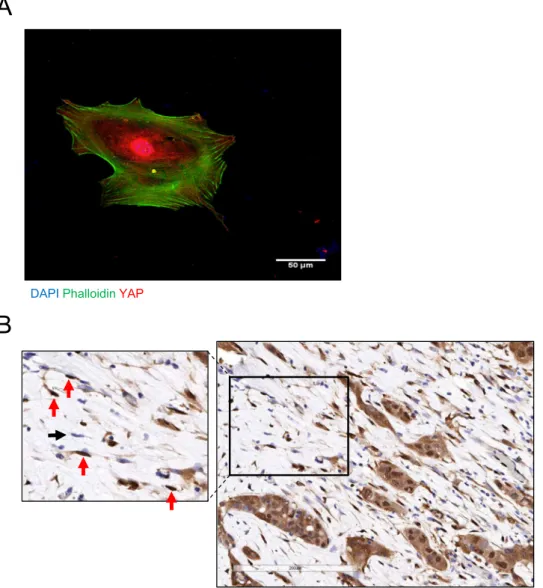
By associating with integrins and syndecan-4 on adjacent cells, Thy-1 supports contractility-dependent mech-anosignaling31, 32. External force activates the YAP and TAZ transcriptional regulators33, and YAP activation is required for CAFs to promote matrix stiffening, cancer cell invasion, and angiogenesis34. A hallmark of YAP activation, nuclear localization of YAP was detectable in 45 of 53 (84%) Thy-1+ CAFs grown in monolayer culture
(Fig. 9A). Therefore, we postulated that CAFs have prognostic value because they generate mechanical signals that drive metastasis. To test this hypothesis, we performed immunohistochemical analysis of YAP expression on a cohort of early-stage lung adenocarcinoma patients (n = 248) that have been annotated on the basis of clinical outcome (Supplementary Table 4) and have a median survival duration of 67 months. We excluded tumor cells from the analysis and quantified YAP in regions of tumor stroma, where YAP was detectable in the cytoplasm and/or nuclei of a subset of stromal cells (Fig. 9B). A composite H-score was generated for cytoplasmic and nuclear YAP on the basis of staining intensity and extension, and the percentage of stromal cells deemed positive for nuclear YAP was quantified (Supplementary Table 4). By both metrics, nuclear YAP was not correlated with survival duration in this lung adenocarcinoma cohort.
Discussion
Studies using experimental tumor models have established a strong link between CAF infiltration and the devel-opment of a tumor microenvironment that suppresses anti-tumor immunity, supports vascular growth, and promotes tumor cell invasion and metastasis35. Playing central roles in these processes are diffusible cytokines secreted by CAFs, such as vascular endothelial growth factor and transforming growth factor-β136. However,
DAPIPhalloidinYAP
A
B
Figure 9. Nuclear YAP in stromal cells. (A) Merged fluorescence micrographs of a Thy-1+ CAF stained with anti-YAP antibodies (red), phalloidin (green), and DAPI (blue). (B) Anti-YAP immunohistochemical analysis of a stromal region within a human lung adenocarcinoma. Within the inset (left), arrows point to stromal cells with nuclei that stain positively (red) or negatively (black) for YAP.
CAFs are of heterogeneous origins, exhibit diverse biological properties, and can promote or inhibit tumorigene-sis37. Tumor classification systems incorporating CAF expression signatures accurately predict patient outcome2–5,
38–47. Similar to the findings reported here, Navab et al. generated an expression signature from CAFs and LFs that had been isolated from human lung cancer and adjacent normal lung tissues, respectively, and found that the signature was correlated with a poor prognosis in human lung cancer cohorts17. However, the CAFs and LFs stud-ied by Navab et al. were unselected and are probably more heterogeneous than the selected population (Thy-1+
CD31− CD45− Ep-CAM−) studied here. In fact, the signature reported here did not significantly overlap with that
reported by Navab et al., suggesting that the cells are biologically distinct. Furthermore, the two studies under-took different expression profiling approaches (proteomic versus transcriptomic). The analysis undertaken here in which proteomic and transcriptomic databases were merged has inherent limitations if changes in the abundance of a transcript and the protein it encodes are not correlated. Regardless, proteomic signatures did reveal overlap with transcriptomic signatures in this study and in a separate report on colon cancer48.
The concept that resident fibroblasts can be converted to CAFs is supported by evidence that deregulated expression of specific microRNAs in resident ovarian fibroblasts supports CAF development in ovarian cancer49. Thy-1+ lung fibroblasts are considered progenitors of lung myofibroblasts in patients with idiopathic pulmonary
fibrosis (IPF)50, but Thy-1 expression is silenced epigenetically in IPF-derived myofibroblasts51, suggesting that Thy-1 expression is not required for the maintenance of myofibroblast differentiation in IPF. Thy-1 is a cell surface glycoprotein that lacks a cytoplasmic domain but plays a critical role in contractility-dependent mechanosign-aling31, 32. Given that mechanosignaling is required for the generation and maintenance of CAFs34, studies are warranted to examine whether Thy-1 drives CAF development in lung cancer.
Nuclear YAP expression in tumor cells is correlated with a worse prognosis in esophageal carcinoma, cervical carcinoma, hepatocellular carcinoma, gastric carcinoma, and lung cancer52. The findings reported here represent the first analysis, to our knowledge, of nuclear YAP specifically in tumor stroma. In contrast to the Thy-1+ gene
expression signature, which was correlated with shorter survival in a subset of lung adenocarcinoma cohorts, nuclear YAP in tumor stroma was not correlated with a worse prognosis in a single patient cohort. Additional studies on independent cohorts are needed before definitive conclusions about the prognostic value of nuclear YAP in tumor stroma can be made, but the findings presented here raise the possibility that the prognostic value of CAFs is not related exclusively to mechanosignaling within tumor stroma.
Methods
Animal husbandry.
Before their initiation, all mouse experiments were submitted to and approved by the Institutional Animal Care and Use Committee at the University of Texas MD Anderson Cancer Center, and all methods were performed in accordance with the relevant guidelines and regulations. KrasLA1/+ mice receivedstandards of care and were euthanized according to the standards set forth by the IACUC. KrasLA1 mice have been
maintained on their original 129sv background14.
Immunohistochemistry and digital pathology analysis.
Formalin fixed paraffin embedded tissue specimens from 12 patients with lung adenocarcinoma were selected for immunohistochemical staining to detect Thy-1 and αSMA. All cases were anonymized and approved by the Institutional Review Board. Five-μm-thick unstained sections from the cases were stained in a Leica Bond Max autostainer (Leica Biosystems, Nussloch GmbH). Slides were deparaffinized and rehydrated in the autostainer according to the manufacturer’s instruc-tions. Antigen retrieval was performed with Bond Epitope Retrieval Solution #1 (Leica Biosystems), equivalent to citrate buffer pH 6.0 for detection of αSMA, and Bond Epitope Retrieval Solution #2 (Leica Biosystems), equiva-lent to EDTA pH 9.0, for detection of Thy-1. Primary antibodies employed were anti-αSMA (1:300, rabbit poly-clonal, Abcam, catalog #ab5694), anti-Thy-1 (1:200, rabbit monoclonal clone D3V8A, Cell Signaling Technology, catalog #13801), anti-type I collagen (1:400, rabbit polyclonal, Abcam catalog #ab34710), and anti-YAP (1:100, rabbit monoclonal, clone D8H1X, Cell Signaling Technology, Danvers, MA, catalog number #14074). The anti-bodies were detected using Bond Polymer Refine detection kit (Leica Biosystems) and the labeling was visualized using 3′3′-diaminobenzidine and hematoxylin counterstaining. A human colon specimen was used as control for both Thy-1 and αSMA detection (cytoplasmic staining in the stromal cell compartment and smooth muscle cells, respectively). The staining quality was assessed by two pathologists. After staining, the slides were digital-ized in an Aperio AT2 scanner (Leica Biosystems). The digital slides were then evaluated by a pathologist who selected five random areas of around 1 mm2. The analysis was performed on the selected tumor areas using acolocalization algorithm from the Aperio Image Toolbox analysis software (Leica Biosystems). The final data were expressed as the average of the percentage of tumor expressing Thy-1 or αSMA in the analyzed tumor regions.
For the quantification of YAP expression in a cohort of clinically annotated human lung adenocarcinomas, we used a tissue microarray containing 248 tumors (three core biopsies of one millimeter diameter per tumor). We employed 4-μm-thick sections of formalin-fixated, paraffin-embedded tumor blocks selected by a pathol-ogist. Immunohistochemistry was performed using an automated staining system (Leica BOND-MAX; Leica Biosystems, Nussloch, GmbH) according to standard protocols. After incubation with the primary antibody, YAP expression was detected using a Novocastra Bond Polymer Refine Detection kit (Leica Bioosystems) with a diaminobenzidine reaction to detect antibody labeling and hematoxylin counterstaining. The immunostained sections were digitally scanned using the Aperio AT2 scanner (Leica Biosystems) under 20 × objective magnifi-cation. The images were visualized using ImageScope
™
software (Aperio). The expression of YAP was evaluated in stromal cells using digital image analysis with Aperio Image Toolbox™
using a pathologist-trained nuclear and cytoplasmic-specific algorithm. YAP nuclear and cytoplasmic expression was evaluated according to the H-score system: The percent of staining intensity was scored as 0 (no staining), 1+ (weak staining), 2+ (moderate stain-ing), and 3+ (strong stainstain-ing), and the extension of the expression for each sample was reported as percentageof positive nuclei (0% to 100%). The final score (H-score) was then obtained by multiplying the intensity and reactivity extension values (range, 0–300) as we have reported53.
Immunofluorescent staining.
Immunofluorescent staining of human lung cancer tissue sections was performed as described elsewhere54. Bright field and fluorescence Images were acquired with a 20X (0.75 NA) objective on a Nikon A1+ confocal or with a 10X (0.45 NA) objective on a Nikon Eclipse Ti inverted widefield microscope (Nikon Corporation, Tokyo, Japan) equipped with DS-Qi2 monochrome camera (fluorescence) and DS-Ri2 color camera (color Brightfield) using NIS Elements software (Nikon). Raw images were deconvolved with Huygens Professional version 15.05 (Scientific Volume Imaging, The Netherlands, https://svi.nl/) and processed in ImageJ (NIH, Bethesda, https://imagej.nih.gov/ij). Briefly, deconvolved images were thresholded, smoothened and watershed segmented before creating a mask for DAPI channel to score for total number of cells per field. Other channels were processed identically and multiplied with the nuclear mask before scoring for number of single positive cells. Double positive cells were identified using RG2B colocalization plugin. Scores were expressed as percentage.Flow cytometric isolation of primary lung fibroblasts.
CAFs and LFs were isolated from the lungs of KrasLA1 mice and wild-type littermates, respectively, by flow cytometric analysis to first remove hematopoieticcells (anti-CD45), endothelial cells (anti-CD31), and epithelial cells (anti-Epcam) and then positively select fibro-blasts using an antibody against cell-surface glycoprotein Thy-1 (CD90). Briefly, murine lungs were digested into single cell suspension by immersion in 3 mg/mL of collagenase type I (Worthington, Lakewood, NJ) and 4 mg/ mL dispase II (Roche, Indianapolis, IN) and mechanical mincing on a gentleMACS Dissociator (Miltenyi Biotec, Auburn, CA) followed by gentle rocking at 37 °C for 45 minutes. Dispersed cells were centrifuged, washed with PBS-2% fetal bovine serum, and subjected to red blood cell lysis (BioLegend, San Diego, CA). The remaining cells were centrifuged, washed, filtered (70 and 40 μm) and counted (Countess, Invitrogen, Grand Island, NY) for further processing. Fibroblasts were isolated by flow cytometry using directly conjugated monoclonal rat anti-mouse antibodies against CD31, CD45, Ep-CAM, and Thy-1 and relevant isotype controls tagged with flu-orochromes including FITC, PE, PE-Cy7, or APC purchased from either BD Biosciences (Franklin Lakes, NJ), eBioscience (San Diego, CA), or Biolegend (San Diego, CA). 7-aminoactinomycin D (7-AAD; 2 μg/mL, Sigma Aldrich, St Louis, MO) was used as a viability dye for flow cytometric detection and exclusion of non-viable cells. Cells (5 × 10⁷ cells/mL) were resuspended in PBS and 2% FBS in an optimally pre-titered cocktail of antibodies
and incubated for 45 minutes on ice. The labeled cells were washed and resuspended at 5–10 × 106 cells/mL and
held on ice for flow cytometric analysis and sorting using a FACSAria cell sorter (BD Biosciences). Fibroblasts were cultured in α-modified essential medium (MEM) (Corning, Manassas, VA) supplemented with 20% fetal bovine serum, penicillin/streptomycin, L-glutamine, and sodium pyruvate. Primary cells used in experiments had been passaged fewer than 6 times.
Fibroblast matrix isolation.
CAF and LF extracellular matrices were isolated based on a modification of previously published methods55. Briefly, fibroblast mono-cultures were grown to confluence in 150 mm plates in α-modified essential medium (Sigma Aldrich) supplemented with 20% fetal bovine serum, penicillin/strepto-mycin, 1X L-glutamine, and 1X sodium pyruvate. To enhance matrix secretion, L-ascorbic acid (50 µg/ml) was freshly prepared and added at each media change. For matrix isolation, cells were lysed in water for 10 minutes at which point cellular debris was removed. The remaining matrices (n = 3, each group) were scraped from plates and snap frozen for later analysis.Protein fractionation and liquid chromatography-mass spectrometry (LC-MS/MS).
Fibroblast matrices from LFs and CAFs (3 of each type) were prepared as described above. LC/MS-MS analysis was done as previously described56. In brief, samples were lysed first in a modified RIPA buffer (PBS, pH7.4; 0.1% SDS; 0.25% Na-deoxycholate) with phosphatase and protease inhibitors at 2 ml/g, followed by further extraction of the insoluble fraction with a urea lysis buffer (PBS, pH7.4; 5.0 M urea, 2.0 M thiourea; 0.1% SDS; 50 mM DTT). SDS and Na-deoxycholate was removed from the samples prior to fractionation with detergent removal spin columns (Pierce). Matrix proteins extracted as described above from fibroblasts were reduced overnight in DTT prior to fractionation. Individual fractions were trypsin digested and combined into 24 pools. Pools were then analyzed in a LTQ-ORBITRAP mass spectrometer (Thermo-Finnigan; San Jose, CA) with a nanoflow chromatrography system (Eksigent; Dublin, California). Acquired mass spectrometry data were automatically processed by the Computational Proteomics Analysis System (CPAS) pipeline using the X!Tandem search algorithm configured with the K-score module plug-in. The tandem mass spectra were searched against a composite database of IPI mouse (v3.64) and IPI bovine (v3.50). To estimate the significance of peptide and protein matches, we applied the tools of PeptideProphet and ProteinProphet. Peptides identified with PeptideProphet probability of a minimum 0.05 were selected and submitted to ProteinProphet; peptides with shared bovine sequence were not included. The derived protein identifications were filtered at a maximum 5% error rate. Peptide quantitation was computed by the Q3 quantitation tool using peptides achieving PeptideProphet probability of a minimum 0.5 and fractional delta mass not exceeding 20 ppm. Enrichment analysis for Gene Ontology terms was conducted on the differ-entially expressed proteins by Database for Annotation, Visualization, and Integrated Discovery (DAVID). GO categories with p-values > 0.01 and containing five or fewer genes from the list were discarded.Statistical analysis.
Numerical values of cell culture and mouse cohort data were analyzed using student’s t-test for significance in GraphPad software. The difference was considered significant at P < 0.05 (two-tailed). For experimental data, all computations were carried out in SAS 9.2 and S-plus 8.0.For analysis of mRNA expression and lung cancer patient survival, we examined a previously-assembled compendium dataset of 11 published expression profiling datasets for human lung adenocarcinomas (n = 1,492
tumors)57–60, with the addition of another dataset from Sato et al.29; patients represented in both Shedden and Chitale datasets (n = 88 patients) were first removed from the Shedden dataset, and one patient from Bild data-set thought to potentially represent squamous cell carcinoma was also removed (leaving n = 1,586 tumors in total). This compendium expression dataset was compiled using approaches previously described60, 61; briefly, genes within each array dataset were first normalized to standard deviations from the median; where multiple human array probe sets referenced the same gene, the probe set with the highest variation was used to represent the gene. In order to score each human lung tumor within the compendium dataset for similarity to our CAF proteomic signature, we derived a “t-score” metric for each human tumor in relation to the signature, using the same approach as that of previous studies30, 58–60, 62–84; briefly, the t-score was defined for each external profile as the two-sided t-statistic comparing, within the profile, the average of the genes high in CAF with the average of the genes low in CAF. From the 425 proteins in the CAF proteomic signature, 391 corresponding mRNAs (206 up in CAFs, 185 down in CAFs) were represented in the human lung tumor compendium.
References
1. Desmouliere, A., Guyot, C. & Gabbiani, G. The stroma reaction myofibroblast: a key player in the control of tumor cell behavior. The
International journal of developmental biology 48, 509–517, doi:10.1387/ijdb.041802ad (2004).
2. Donnem, T. et al. Prognostic impact of platelet-derived growth factors in non-small cell lung cancer tumor and stromal cells. Journal
of thoracic oncology: official publication of the International Association for the Study of Lung Cancer 3, 963–970, doi:10.1097/ JTO.0b013e3181834f52 (2008).
3. Hong, L. Z., Wei, X. W., Chen, J. F. & Shi, Y. Overexpression of periostin predicts poor prognosis in non-small cell lung cancer.
Oncology letters 6, 1595–1603, doi:10.3892/ol.2013.1590 (2013).
4. Huang, Y. et al. SPARC expression and prognostic value in non-small cell lung cancer. Chinese journal of cancer 31, 541–548, doi:10.5732/cjc.012.10212 (2012).
5. Kurtul, N. et al. Prognostic value of SPARC expression in unresectable NSCLC treated with concurrent chemoradiotherapy. Asian
Pacific journal of cancer prevention: APJCP 15, 8911–8916 (2014).
6. Hanley, C. J. et al. A subset of myofibroblastic cancer-associated fibroblasts regulate collagen fiber elongation, which is prognostic in multiple cancers. Oncotarget 7, 6159–6174, doi:10.18632/oncotarget.6740 (2016).
7. Mahale, J., Smagurauskaite, G., Brown, K., Thomas, A. & Howells, L. The role of stromal fibroblasts in lung carcinogenesis: A target for chemoprevention? Int J Cancer 138, 30–44 (2016).
8. Campbell, D., Gagnon, J., Reid, K. & Williams, A. Rat brain Thy-1 glycoprotein. The amino acid sequence, disulphide bonds and an unusual hydrophobic region. Biochem J 195, 15–30 (1981).
9. Wetzel, A. et al. Human Thy-1 (CD90) on activated endothelial cells is a counterreceptor for the leukocyte integrin Mac-1 (CD11b/ CD18). J Immunol 172, 3850–3859 (2004).
10. Saalbach, A., Hildebrandt, G., Haustein, U. & Anderegg, U. The Thy-1/Thy-1 ligand interaction is involved in binding of melanoma cells to activated Thy-1- positive microvascular endothelial cells. Microvasc Res 64, 86–93 (2002).
11. Fiore, V., Ju, L., Chen, Y., Zhu, C. & Barker, T. Dynamic catch of a Thy-1-α5β1+ syndecan-4 trimolecular complex. Nat Commun 5, 4886 (2014).
12. Barkan, D. et al. Metastatic growth from dormant cells induced by a col-I-enriched fibrotic environment. Cancer research 70, 5706–5716, doi:10.1158/0008-5472.CAN-09-2356 (2010).
13. Nazareth, M. et al. Characterization of human lung tumor-associated fibroblasts and their ability to modulate the activation of tumor-associated T cells. J Immunol 178, 5552–5562 (2007).
14. Johnson, L. et al. Somatic activation of the K-ras oncogene causes early onset lung cancer in mice. Nature 410, 1111–1116, doi:10.1038/35074129 (2001).
15. Roybal, J. D. et al. miR-200 Inhibits lung adenocarcinoma cell invasion and metastasis by targeting Flt1/VEGFR1. Molecular cancer
research: MCR 9, 25–35, doi:10.1158/1541-7786.MCR-10-0497 (2011).
16. Fries, K. M. et al. Evidence of fibroblast heterogeneity and the role of fibroblast subpopulations in fibrosis. Clinical immunology and
immunopathology 72, 283–292 (1994).
17. Navab, R. et al. Prognostic gene-expression signature of carcinoma-associated fibroblasts in non-small cell lung cancer. Proc Natl
Acad Sci USA 108, 7160–7165 (2011).
18. Chitale, D. et al. An integrated genomic analysis of lung cancer reveals loss of DUSP4 in EGFR-mutant tumors. Oncogene 28, 2773–2783, doi:10.1038/onc.2009.135 (2009).
19. Tomida, S. et al. Relapse-related molecular signature in lung adenocarcinomas identifies patients with dismal prognosis. Journal of
clinical oncology: official journal of the American Society of Clinical Oncology 27, 2793–2799, doi:10.1200/JCO.2008.19.7053 (2009). 20. Bhattacharjee, A. et al. Classification of human lung carcinomas by mRNA expression profiling reveals distinct adenocarcinoma
subclasses. Proceedings of the National Academy of Sciences of the United States of America 98, 13790–13795, doi:10.1073/ pnas.191502998 (2001).
21. Director’s Challenge Consortium for the Molecular Classification of Lung, A. et al. Gene expression-based survival prediction in lung adenocarcinoma: a multi-site, blinded validation study. Nature medicine 14, 822–827, doi:10.1038/nm.1790 (2008). 22. Beer, D. G. et al. Gene-expression profiles predict survival of patients with lung adenocarcinoma. Nature medicine 8, 816–824,
doi:10.1038/nm733 (2002).
23. Zhu, C. Q. et al. Prognostic and predictive gene signature for adjuvant chemotherapy in resected non-small-cell lung cancer. Journal
of clinical oncology: official journal of the American Society of Clinical Oncology 28, 4417–4424, doi:10.1200/JCO.2009.26.4325
(2010).
24. Bild, A. H. et al. Oncogenic pathway signatures in human cancers as a guide to targeted therapies. Nature 439, 353–357, doi:10.1038/ nature04296 (2006).
25. Botling, J. et al. Biomarker discovery in non-small cell lung cancer: integrating gene expression profiling, meta-analysis, and tissue microarray validation. Clinical cancer research: an official journal of the American Association for Cancer Research 19, 194–204, doi:10.1158/1078-0432.CCR-12-1139 (2013).
26. Hou, J. et al. Gene expression-based classification of non-small cell lung carcinomas and survival prediction. PloS one 5, e10312, doi:10.1371/journal.pone.0010312 (2010).
27. Okayama, H. et al. Identification of genes upregulated in ALK-positive and EGFR/KRAS/ALK-negative lung adenocarcinomas.
Cancer research 72, 100–111, doi:10.1158/0008-5472.CAN-11-1403 (2012).
28. Tang, H. et al. A 12-gene set predicts survival benefits from adjuvant chemotherapy in non-small cell lung cancer patients. Clinical
cancer research: an official journal of the American Association for Cancer Research 19, 1577–1586, doi: 10.1158/1078-0432.CCR-12-2321 (2013).
29. Sato, M. et al. Human lung epithelial cells progressed to malignancy through specific oncogenic manipulations. Molecular cancer
30. Gibbons, D. L. et al. Expression signatures of metastatic capacity in a genetic mouse model of lung adenocarcinoma. PloS one 4, e5401, doi:10.1371/journal.pone.0005401 (2009).
31. Barker, T. H. & Hagood, J. S. Getting a grip on Thy-1 signaling. Biochimica et biophysica acta 1793, 921–923, doi:10.1016/j. bbamcr.2008.10.004 (2009).
32. Fiore, V. F., Ju, L., Chen, Y., Zhu, C. & Barker, T. H. Dynamic catch of a Thy-1-alpha5beta1+ syndecan-4 trimolecular complex.
Nature communications 5, 4886, doi:10.1038/ncomms5886 (2014).
33. Dupont, S. et al. Role of YAP/TAZ in mechanotransduction. Nature 474, 179–183 (2011).
34. Calvo, F. et al. Mechanotransduction and YAP-dependent matrix remodelling is required for the generation and maintenance of cancer-associated fibroblasts. Nature cell biology 15, 637–646 (2013).
35. Nelson, C. M. & Bissell, M. J. Of extracellular matrix, scaffolds, and signaling: tissue architecture regulates development, homeostasis, and cancer. Annual review of cell and developmental biology 22, 287–309, doi:10.1146/annurev.cellbio.22.010305.104315
(2006).
36. Vong, S. & Kalluri, R. The role of stromal myofibroblast and extracellular matrix in tumor angiogenesis. Genes & cancer 2, 1139–1145, doi:10.1177/1947601911423940 (2011).
37. Gascard, P. & Tlsty, T. D. Carcinoma-associated fibroblasts: orchestrating the composition of malignancy. Genes & development 30, 1002–1019, doi:10.1101/gad.279737.116 (2016).
38. Chen, Y. et al. Transforming growth factor-beta1 and alpha-smooth muscle actin in stromal fibroblasts are associated with a poor prognosis in patients with clinical stage I-IIIA nonsmall cell lung cancer after curative resection. Tumour biology: the journal of the
International Society for Oncodevelopmental Biology and Medicine 35, 6707–6713, doi:10.1007/s13277-014-1908-y (2014). 39. Edlund, K. et al. CD99 is a novel prognostic stromal marker in non-small cell lung cancer. International journal of cancer 131,
2264–2273, doi:10.1002/ijc.27518 (2012).
40. Kilvaer, T. K. et al. Cancer Associated Fibroblasts in Stage I-IIIA NSCLC: Prognostic Impact and Their Correlations with Tumor Molecular Markers. PloS one 10, e0134965, doi:10.1371/journal.pone.0134965 (2015).
41. Kitano, H. et al. Podoplanin expression in cancerous stroma induces lymphangiogenesis and predicts lymphatic spread and patient survival. Archives of pathology & laboratory medicine 134, 1520–1527, doi:10.1043/2009-0114-OA.1 (2010).
42. Koriyama, H. et al. Presence of podoplanin-positive cancer-associated fibroblasts in surgically resected primary lung adenocarcinoma predicts a shorter progression-free survival period in patients with recurrences who received platinum-based chemotherapy. Journal of cancer research and clinical oncology 141, 1163–1170, doi:10.1007/s00432-014-1891-0 (2015).
43. Liao, Y., Ni, Y., He, R., Liu, W. & Du, J. Clinical implications of fibroblast activation protein-alpha in non-small cell lung cancer after curative resection: a new predictor for prognosis. Journal of cancer research and clinical oncology 139, 1523–1528, doi:10.1007/ s00432-013-1471-8 (2013).
44. Meijer, T. W. et al. Differences in metabolism between adeno- and squamous cell non-small cell lung carcinomas: spatial distribution and prognostic value of GLUT1 and MCT4. Lung cancer 76, 316–323, doi:10.1016/j.lungcan.2011.11.006 (2012).
45. Neri, S. et al. Recruitment of podoplanin positive cancer-associated fibroblasts in metastatic lymph nodes predicts poor prognosis in pathological N2 stage III lung adenocarcinoma. Annals of surgical oncology 19, 3953–3962, doi:10.1245/s10434-012-2421-4
(2012).
46. Pirinen, R. et al. Versican in nonsmall cell lung cancer: relation to hyaluronan, clinicopathologic factors, and prognosis. Human
pathology 36, 44–50, doi:10.1016/j.humpath.2004.10.010 (2005).
47. Zhang, T. et al. Tumor-stroma ratio is an independent predictor for survival in NSCLC. International journal of clinical and
experimental pathology 8, 11348–11355 (2015).
48. Zhang, B. et al. Proteogenomic characterization of human colon and rectal cancer. Nature 513, 382–387 (2014).
49. Mitra, A. K. et al. MicroRNAs reprogram normal fibroblasts into cancer-associated fibroblasts in ovarian cancer. Cancer discovery 2, 1100–1108, doi:10.1158/2159-8290.CD-12-0206 (2012).
50. Bradley, J. E., Ramirez, G. & Hagood, J. S. Roles and regulation of Thy-1, a context-dependent modulator of cell phenotype.
BioFactors 35, 258–265, doi:10.1002/biof.41 (2009).
51. Sanders, Y. Y. et al. Thy-1 promoter hypermethylation: a novel epigenetic pathogenic mechanism in pulmonary fibrosis. American
journal of respiratory cell and molecular biology 39, 610–618, doi:10.1165/rcmb.2007-0322OC (2008).
52. Wang, H., Du, Y., Zhou, X., Liu, H. & Tang, S. The dual functions of YAP-1 to promote and inhibit cell growth in human malignancy.
Cancer Metastasis Rev 33, 173–181 (2014).
53. Kim, J. et al. XPO1-dependent nuclear export is a druggable vulnerability in KRAS-mutant lung cancer. Nature 538, 114–117 (2016). 54. Robertson, D. & Isacke, C. M. Multiple immunofluorescence labeling of formalin-fixed paraffin-embedded tissue. Methods in
molecular biology 724, 69–77, doi:10.1007/978-1-61779-055-3_4 (2011).
55. Beacham, D. A., Amatangelo, M. D. & Cukierman, E. Preparation of extracellular matrices produced by cultured and primary fibroblasts. Current protocols in cell biology/editorial board, Juan S. Bonifacino… [et al.] Chapter 10, Unit 10 19, doi:10.1002/0471143030.cb1009s33 (2007).
56. Schliekelman, M. J. et al. Targets of the tumor suppressor miR-200 in regulation of the epithelial-mesenchymal transition in cancer.
Cancer research 71, 7670–7682, doi:10.1158/0008-5472.CAN-11-0964 (2011).
57. Creighton, C. J., Gibbons, D. L. & Kurie, J. M. The role of epithelial-mesenchymal transition programming in invasion and metastasis: a clinical perspective. Cancer management and research 5, 187–195, doi:10.2147/CMAR.S35171 (2013).
58. Mishra, D. K. et al. Ex vivo four-dimensional lung cancer model mimics metastasis. The Annals of thoracic surgery 99, 1149–1156, doi:10.1016/j.athoracsur.2014.08.085 (2015).
59. Yang, Y. et al. ZEB1 sensitizes lung adenocarcinoma to metastasis suppression by PI3K antagonism. The Journal of clinical
investigation 124, 2696–2708, doi:10.1172/JCI72171 (2014).
60. Mishra, D. K. et al. Gene expression profile of A549 cells from tissue of 4D model predicts poor prognosis in lung cancer patients.
International journal of cancer 134, 789–798, doi:10.1002/ijc.28428 (2014).
61. Kessler, J. D. et al. A SUMOylation-dependent transcriptional subprogram is required for Myc-driven tumorigenesis. Science 335, 348–353, doi:10.1126/science.1212728 (2012).
62. Chen, F. et al. Multilevel Genomics-Based Taxonomy of Renal Cell Carcinoma. Cell reports 14, 2476–2489, doi:10.1016/j. celrep.2016.02.024 (2016).
63. Wu, S. P. et al. Increased COUP-TFII expression in adult hearts induces mitochondrial dysfunction resulting in heart failure. Nature
communications 6, 8245, doi:10.1038/ncomms9245 (2015).
64. Qin, J. et al. Androgen deprivation-induced NCoA2 promotes metastatic and castration-resistant prostate cancer. The Journal of
clinical investigation 124, 5013–5026, doi:10.1172/JCI76412 (2014).
65. Fu, X. et al. Overcoming endocrine resistance due to reduced PTEN levels in estrogen receptor-positive breast cancer by co-targeting mammalian target of rapamycin, protein kinase B, or mitogen-activated protein kinase kinase. Breast cancer research: BCR 16, 430, doi:10.1186/s13058-014-0430-x (2014).
66. Feng, Q. et al. An epigenomic approach to therapy for tamoxifen-resistant breast cancer. Cell research 24, 809–819, doi:10.1038/ cr.2014.71 (2014).
67. Atkinson, R. L. et al. Cancer stem cell markers are enriched in normal tissue adjacent to triple negative breast cancer and inversely correlated with DNA repair deficiency. Breast cancer research: BCR 15, R77, doi:10.1186/bcr3471 (2013).
68. Cancer Genome Atlas Research, N. Comprehensive molecular characterization of clear cell renal cell carcinoma. Nature 499, 43–49, doi:10.1038/nature12222 (2013).
69. Wardwell-Ozgo, J. et al. HOXA1 drives melanoma tumor growth and metastasis and elicits an invasion gene expression signature that prognosticates clinical outcome. Oncogene 33, 1017–1026, doi:10.1038/onc.2013.30 (2014).
70. Qin, J. et al. COUP-TFII inhibits TGF-beta-induced growth barrier to promote prostate tumorigenesis. Nature 493, 236–240, doi:10.1038/nature11674 (2013).
71. Cancer Genome Atlas, N. Comprehensive molecular portraits of human breast tumours. Nature 490, 61–70, doi:10.1038/ nature11412 (2012).
72. Brewer Savannah, K. J. et al. Dual targeting of mTOR and aurora-A kinase for the treatment of uterine Leiomyosarcoma. Clinical
cancer research: an official journal of the American Association for Cancer Research 18, 4633–4645, doi: 10.1158/1078-0432.CCR-12-0436 (2012).
73. Creighton, C. J. et al. Integrated analyses of microRNAs demonstrate their widespread influence on gene expression in high-grade serous ovarian carcinoma. PloS one 7, e34546, doi:10.1371/journal.pone.0034546 (2012).
74. Cancer Genome Atlas Research, N. Integrated genomic analyses of ovarian carcinoma. Nature 474, 609–615, doi:10.1038/ nature10166 (2011).
75. Yu, W. et al. FGFR-4 Arg(3)(8)(8) enhances prostate cancer progression via extracellular signal-related kinase and serum response factor signaling. Clinical cancer research: an official journal of the American Association for Cancer Research 17, 4355–4366, doi:10.1158/1078-0432.CCR-10-2858 (2011).
76. Creighton, C. J. et al. A gene transcription signature of obesity in breast cancer. Breast cancer research and treatment 132, 993–1000, doi:10.1007/s10549-011-1595-y (2012).
77. Mullany, L. K. et al. Molecular and functional characteristics of ovarian surface epithelial cells transformed by KrasG12D and loss of Pten in a mouse model in vivo. Oncogene 30, 3522–3536, doi:10.1038/onc.2011.70 (2011).
78. Creighton, C. J. et al. Proteomic and transcriptomic profiling reveals a link between the PI3K pathway and lower estrogen-receptor (ER) levels and activity in ER+ breast cancer. Breast cancer research: BCR 12, R40, doi:10.1186/bcr2594 (2010).
79. Pond, A. C. et al. Fibroblast growth factor receptor signaling dramatically accelerates tumorigenesis and enhances oncoprotein translation in the mouse mammary tumor virus-Wnt-1 mouse model of breast cancer. Cancer research 70, 4868–4879, doi:10.1158/0008-5472.CAN-09-4404 (2010).
80. Creighton, C. J. et al. Residual breast cancers after conventional therapy display mesenchymal as well as tumor-initiating features.
Proceedings of the National Academy of Sciences of the United States of America 106, 13820–13825, doi:10.1073/pnas.0905718106
(2009).
81. Luo, J. et al. A genome-wide RNAi screen identifies multiple synthetic lethal interactions with the Ras oncogene. Cell 137, 835–848, doi:10.1016/j.cell.2009.05.006 (2009).
82. Creighton, C. J. et al. Insulin-like growth factor-I activates gene transcription programs strongly associated with poor breast cancer prognosis. Journal of clinical oncology: official journal of the American Society of Clinical Oncology 26, 4078–4085, doi:10.1200/ JCO.2007.13.4429 (2008).
83. Creighton, C. J. Multiple oncogenic pathway signatures show coordinate expression patterns in human prostate tumors. PloS one 3, e1816, doi:10.1371/journal.pone.0001816 (2008).
84. Choi, K., Creighton, C. J., Stivers, D., Fujimoto, N. & Kurie, J. M. Transcriptional profiling of non-small cell lung cancer cells with activating EGFR somatic mutations. PloS one 2, e1226, doi:10.1371/journal.pone.0001226 (2007).
Acknowledgements
This work was supported in part by the following grants from the National Institutes of Health (NIH) grant 2R01CA125123-09 (C. Creighton), MD Anderson’s Institutional Tissue Bank Award (2P30CA016672, I. Wistuba), and The University of Texas Lung Specialized Programs of Research Excellence grant (P50CA70907, I. Wistuba) and Cancer Prevention and Research Institute of Texas (CPRIT) grant RP120713 C2 (C. Creighton) and P1 (J. Kurie), and Department of Defense PROSPECT grant (W81XWH-07-1-0306, I. Wistuba).
Author Contributions
Conceived and designed the experiments: J.M.K., C.J.C., S.M.H. Performed the experiments: M.J.S., B.N.B., P.B., N.B.R., P.V., J.D.R., D.K.M., X.L., B.M. Analyzed the data: Y.C., Y.H.A., F.C., C.B., Y.Z., M.P.K., J.R., I.I.W., C.J.C., S.M.H., J.M.K. Contributed reagents/materials/analysis tools: J.M.K., S.M.H., C.J.C. Wrote the paper: B.N.B., Y.C., Y.H.A., C.J.C., J.M.K.
Additional Information
Supplementary information accompanies this paper at doi:10.1038/s41598-017-06922-5 Competing Interests: The authors declare that they have no competing interests.
Publisher's note: Springer Nature remains neutral with regard to jurisdictional claims in published maps and institutional affiliations.
Open Access This article is licensed under a Creative Commons Attribution 4.0 International License, which permits use, sharing, adaptation, distribution and reproduction in any medium or format, as long as you give appropriate credit to the original author(s) and the source, provide a link to the Cre-ative Commons license, and indicate if changes were made. The images or other third party material in this article are included in the article’s Creative Commons license, unless indicated otherwise in a credit line to the material. If material is not included in the article’s Creative Commons license and your intended use is not per-mitted by statutory regulation or exceeds the perper-mitted use, you will need to obtain permission directly from the copyright holder. To view a copy of this license, visit http://creativecommons.org/licenses/by/4.0/.