R E S E A R C H A R T I C L E
Open Access
Impact of socioeconomic status and
subjective social class on overall and health-related
quality of life
Jae-Hyun Kim
1,2and Eun-Cheol Park
2,3*Abstract
Background: Our objective was to investigate the impact of socioeconomic status and subjective social class on health-related quality of life (HRQOL) vs. overall quality of life (QOL).
Methods: We performed a longitudinal analysis using data regarding 8250 individuals drawn from the Korean Longitudinal Study of Aging (KLoSA). We analyzed differences between HRQOL and QOL in individuals of various socioeconomic strata (high, middle, or low household income and education levels) and subjective social classes (high, middle, or low) at baseline (2009).
Results: Individuals with low household incomes and of low subjective social class had the highest probability of reporting discrepant HRQOL and QOL scores (B: 4.796; P < 0.0001), whereas individuals with high household incomes and high subjective social class had the lowest probability of discrepant HRQOL and QOL scores (B: −3.625; P = 0.000). Similar trends were seen when education was used as a proxy for socioeconomic status.
Conclusion: In conclusion, both household income/subjective social class and education/subjective social class were found to have an impact on the degree of divergence between QOL and HRQOL. Therefore, in designing interventions, socioeconomic inequalities should be taken into account through the use of multi-dimensional measurement tools.
Keywords: Quality of life, Socioeconomic status, Health-related quality of life
Background
Differences in socioeconomic status (SES), as assessed by income or educational achievement, are associated with large disparities in health status [1]. In Western European countries and in the U.S, the association between SES and health follows a common pattern [2–4]: the lower individuals are with respect to SES, the poorer their state of health. Similar results have been obtained in different countries, irrespective of cultural background or economic growth [5]. The association between SES and health out-comes persists across the life cycle [6] and across multiple measures of health, including health status [7], morbidity
[8], mortality [9], self-assessed health [3, 10], and disease prevalence [11].
Many investigators find it difficult to ascertain which measures of SES are valid, which can be applied to multiple outcomes, and which are most relevant for specific condi-tions. In addition, while most researchers understand they must control for the effects of SES when analyzing health outcomes, many regard different measures of SES as inter-changeable. In reality, education and income capture differ-ent aspects of social position and, thus, have distinctive characteristics [12]. For example, income is sensitive to changes in life circumstances and time, resulting in age lim-itations. Meanwhile, education is known to influence one’s ability to make informed decisions [13]. For example, previ-ous research indicates that a higher level of education is as-sociated with increased understanding of prostate health [14] and reduced pelvic function distress [15].
* Correspondence:[email protected]
2Institute of Health Services Research, Yonsei University, Seoul, Republic of
Korea
3Department of Preventive Medicine, Yonsei University College of Medicine,
Seodaemun-gu, Seoul, Republic of Korea
Full list of author information is available at the end of the article
© 2015 Kim and Park.Open Access This article is distributed under the terms of the Creative Commons Attribution 4.0 International License (http://creativecommons.org/licenses/by/4.0/), which permits unrestricted use, distribution, and reproduction in any medium, provided you give appropriate credit to the original author(s) and the source, provide a link to the Creative Commons license, and indicate if changes were made. The Creative Commons Public Domain Dedication waiver (http://creativecommons.org/publicdomain/zero/1.0/) applies to the data made available in this article, unless otherwise stated.
Kim and ParkBMC Public Health (2015) 15:783 DOI 10.1186/s12889-015-2014-9
Disparities in health outcomes may stem from discordant social comparisons [16–18]; in wealthier countries, it has been argued, it is not economic level per se, but the distri-bution of income and wealth that is most important for the health status of a population [19]. Previous research sug-gests that subjective social class most accurately captures subtle aspects of social status, as it taps into psychosocial processes influenced by one’s social context [20]. Subjective social class has been found to better predict current physical and mental health (i.e., depression, negative affect, pessimism, reported stress, and general health ratings [17, 21]), and even mortality [17, 22].
In the last two decades, as populations have aged and the burden of chronic diseases has grown heavier, researchers have paid increasing attention to both quality of life (QOL) and health-related quality of life (HRQOL). Previous re-search [23] indicates that an individual’s subjective percep-tion of their physical health, psychological health, social functioning, and environment, or“subjective quality of life”, is an independent determinant of wellness and disease bur-den. SES measures, such as income and education, have the potential to impact both HRQOL and QOL [24], and they have also been found to influence an individual’s life oppor-tunities [25, 26]. Life opporoppor-tunities can manifest in various ways, such as in the availability of healthcare resources or in an individual’s perception of his or her HRQOL, defined as the impact of a specific illness, injury, medical treatment, or health services policy on QOL [27]. QOL is used to de-scribe a person’s general well-being. The World Health Organization QOL Group defines QOL [28] as: “Individ-uals’ perception of their position in life in the context of the culture and the value systems in which they live in relation to their goals, expectations, standards and concerns.” It is a broad concept, reflecting the fact that QOL may be affected in a complex manner by individuals’ physical health, psy-chological state, level of independence and social relation-ships, all of which represent salient features of the environment. Thus, the concept of HRQOL is often used to assess the impact of illness on QOL [29].
A previous cross-sectional study [30] investigated whether quality of life (BREAST-Q) and health-related quality of life (RAND 36) were directly influenced by sur-gery. However, no studies have investigated which of these two variables (QOL or HRQOL) is more heavily influenced by socioeconomic variables. Therefore, the primary aim of this study was to investigate whether discordant socioeco-nomic status and subjective social class were associated with discrepancies between HRQOL and QOL scores. Methods
Study sample & design
Data for this study were drawn from the Korean Longitudinal Study of Aging (KLoSA), a nationwide multistage, stratified, cluster sampling survey of Koreans
dwelling in the community. KLoSA is conducted by the Korea Labor Institute to collect the basic data needed to devise and implement effective social and economic pol-icies that address emerging trends related to population aging. The original KLoSA study population comprised South Koreans aged 45 years or older in 2006 who lived in 15 large administrative areas. The survey is repeated every even-numbered year.
In the baseline survey in 2006, 10,254 individuals in 6171 households (1.7 individuals per household) were inter-viewed using a computer-assisted personal interviewing method. The second survey, in 2008, followed up with 8688 subjects, representing 86.6 % of the original panel. The third survey, in 2010, followed up with 7920 subjects, representing 80.3 % of the original panel. Finally, the fourth survey, in 2012, followed up with 7486 subjects, represent-ing 76.2 % of the original panel. We used only 2008 and 2010 data, which included a household income question targeted at adults over the age of 45.
Of these participants, we excluded 435 subjects with no information on our variables of interest (household income, education, and subjective social class) for 2008. In addition, we excluded two subjects with no QOL data for 2008, and one subject with no data of any kind in 2008. We also excluded nine subjects with no informa-tion on our variables of interest (household income, education, and subjective social class) for 2010. In addition, we excluded two subjects with no QOL data for 2010, and two subjects with no data at all for 2010.
Korean Longitudinal Study of Aging (KLoSA) data are available in a national public database (website: http:// www.kli.re.kr/klosa/en/about/introduce.jsp) and thus, ethical approval to conduct the study is not needed.
Independent variables Household income
Household income was divided into tertiles using the SAS rank function, from lowest (1) to highest (3).
Education level
Education was categorized into three groups: (1) middle school or lower, (2) high school, and (3) college or higher.
Subjective social class
Subjective social classes were determined by asking the respondents to assess their social class and rank them-selves. The items were coded so that a higher score indi-cated a higher subjective social class. The item was rated 1 (Low-Low) to 6 (High-High). The response “Low-High” or “Low-Low” indicated “Low,” “Middle-Low” or “Middle-High” indicated “Middle,” and “High-High” or “High-Low” indicated “High.”
Gap between socioeconomic stratum and subjective social class
This gap represents the difference between household in-come [high, middle, low] and education [≥college, high school, ≤middle school] and subjective social class [high, middle, low]. Therefore, it was categorized into nine groups for household income and nine for education: HL [high (≥college) - low], HM [high (≥college) - middle], HH [high (≥college) - high], ML [middle (high school) - low], MM [middle (high school) middle], MH [middle (high school) -high], LL [low (≤ middle school) - low], LM [low (≤ middle school) - middle], and LH [low (≤ middle school) - high].
Dependent variables HRQOL
We used the Euro-QoL visual analog scale (EQ VAS) to measure HRQOL. The HRQOL was measured as a re-sponse to the simple question“How do you usually per-ceive your health-related quality of life?” [31, 32]. This scale was specifically designed to capture overall health status. The HRQOL recorded the respondent’s current health state on a vertical, visual analog scale. The end-points were labeled “best imaginable health state” (100) and“worst imaginable health state” (0). This information was used as a quantitative measure of health outcomes as judged by the individual respondents.
Subjective QOL
The subjective QOL was measured using the simple question “How is your overall quality of life?” and was a proxy indicator of the current health status of each re-spondent. Subjective QOL recorded each respondent’s current overall state on a vertical, visual analogue scale ran-ging from “best imaginable overall state” (100) to “worst imaginable overall state” (0). To assess QOL, an instru-ment measuring general well-being was used. The subject-ive QOL instruments included items addressing physical function, role-physical, bodily pain, general health, vitality, social function, role-emotional, and mental health.
Difference in HRQOL and QOL
We analyzed the difference between HRQOL and QOL as a dependent variable.
Control variables
Age was divided into seven categories:≤49, 50–54, 55–59, 60–64, 65–69, 70–74, and ≥75 years. Residential regions were categorized as urban (Seoul, Daejeon, Daegu, Busan, Incheon, Kwangju, and Ulsan) or rural (areas not classified as a city). Individuals were classified as currently married or not currently married, with the latter group including those previously married, widowed, or divorced. Employment sta-tus was divided into two categories: employed and un-employed (the latter category including housewives and
students). Individuals were categorized as current users, former users, or never users of alcohol and cigarettes. Num-ber of contact with friends was divided into five categories: every day, 1–2 times a week, 1–2 times a month, 3–6 times a year, and never. Self-rated health was assessed with the question “How do you usually perceive your health?” [33]. A response of “insufficient” or “very insufficient” was con-sidered to indicate“Bad,” the response “normal,” was con-sidered to indicate“Normal,” and a response of “sufficient,” or“very sufficient” was considered to indicate “Good.” The presence of self-reported depressive symptoms, categorized as “yes” or “no,” was extracted from the response to the question “Have you ever felt sadness or despair that hin-dered everyday life and continued for 2 weeks or more dur-ing the last year?” The number of chronic diseases (hypertension, diabetes, cancer, pulmonary disease, liver dis-ease, coronary heart disdis-ease, cardiovascular disdis-ease, mental disease, and arthritis) was also included in our models, as were the number of offspring and year (time) of survey.
Analytical approach and statistics
Analysis of variance (ANOVA) and generalized linear mixed models were used to investigate the effect of gap between socioeconomic stratum and subjective social class on difference HRQOL and QOL among old adults. For all analyses, the criterion for significance was P≤ 0.05, two-tailed. All analyses were conducted using the SAS statistical software package version 9.2 (SAS Institute Inc., Cary, NC, USA).
Generalized linear mixed effects model (SAS® Proc Glimmix)
Proc Glimmix is a generalized linear model procedure that permits the specification of a mixed multiple regression model. In a generalized linear mixed model, the observations of one individual over time are not independ-ent of each other, and the model also takes into account the fact that the repeated observations of each individual are correlated. In all mixed models presented, only the inter-cept was allowed to vary between subjects, and regression slopes were assumed to be fixed effects; random intercept models were applied to our data. The random intercept variance is reported asσ2. To determine whether the prob-ability of a difference between HRQOL and QOL changed over time, we included time (year of survey) in the model as a categorical covariate; the regression coefficient was used to estimate both the change in probability of a differ-ence between HRQOL and QOL and the association with our independent variables, annually.
Results
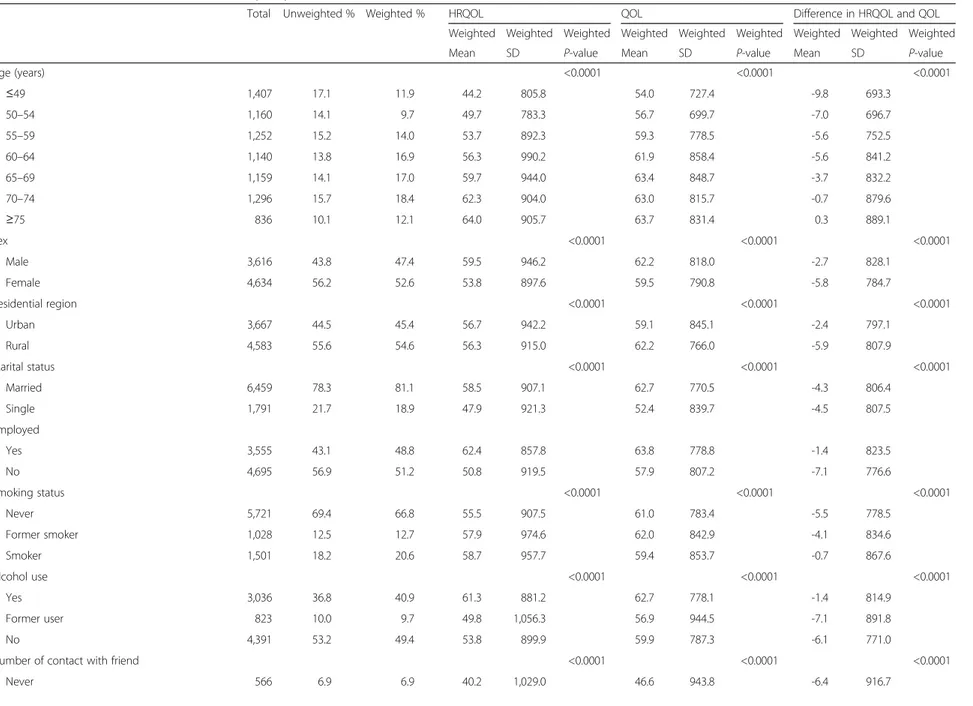
Table 1 presents the general characteristics of the 8250 research subjects at baseline as well as the association between each variable of interest and HRQOL, QOL, and the difference between HRQOL and QOL (Table 1).
Table 1 General characteristics of the 8,250 study subjects and association of each covariate with HRQOL, QOL, and the difference in HRQOL and QOL at baseline (2008)
Total Unweighted % Weighted % HRQOL QOL Difference in HRQOL and QOL
Weighted Weighted Weighted Weighted Weighted Weighted Weighted Weighted Weighted
Mean SD P-value Mean SD P-value Mean SD P-value
Age (years) <0.0001 <0.0001 <0.0001 ≤49 1,407 17.1 11.9 44.2 805.8 54.0 727.4 -9.8 693.3 50–54 1,160 14.1 9.7 49.7 783.3 56.7 699.7 -7.0 696.7 55–59 1,252 15.2 14.0 53.7 892.3 59.3 778.5 -5.6 752.5 60–64 1,140 13.8 16.9 56.3 990.2 61.9 858.4 -5.6 841.2 65–69 1,159 14.1 17.0 59.7 944.0 63.4 848.7 -3.7 832.2 70–74 1,296 15.7 18.4 62.3 904.0 63.0 815.7 -0.7 879.6 ≥75 836 10.1 12.1 64.0 905.7 63.7 831.4 0.3 889.1 Sex <0.0001 <0.0001 <0.0001 Male 3,616 43.8 47.4 59.5 946.2 62.2 818.0 -2.7 828.1 Female 4,634 56.2 52.6 53.8 897.6 59.5 790.8 -5.8 784.7 Residential region <0.0001 <0.0001 <0.0001 Urban 3,667 44.5 45.4 56.7 942.2 59.1 845.1 -2.4 797.1 Rural 4,583 55.6 54.6 56.3 915.0 62.2 766.0 -5.9 807.9 Marital status <0.0001 <0.0001 <0.0001 Married 6,459 78.3 81.1 58.5 907.1 62.7 770.5 -4.3 806.4 Single 1,791 21.7 18.9 47.9 921.3 52.4 839.7 -4.5 807.5 Employed Yes 3,555 43.1 48.8 62.4 857.8 63.8 778.8 -1.4 823.5 No 4,695 56.9 51.2 50.8 919.5 57.9 807.2 -7.1 776.6 Smoking status <0.0001 <0.0001 <0.0001 Never 5,721 69.4 66.8 55.5 907.5 61.0 783.4 -5.5 778.5 Former smoker 1,028 12.5 12.7 57.9 974.6 62.0 842.9 -4.1 834.6 Smoker 1,501 18.2 20.6 58.7 957.7 59.4 853.7 -0.7 867.6 Alcohol use <0.0001 <0.0001 <0.0001 Yes 3,036 36.8 40.9 61.3 881.2 62.7 778.1 -1.4 814.9 Former user 823 10.0 9.7 49.8 1,056.3 56.9 944.5 -7.1 891.8 No 4,391 53.2 49.4 53.8 899.9 59.9 787.3 -6.1 771.0
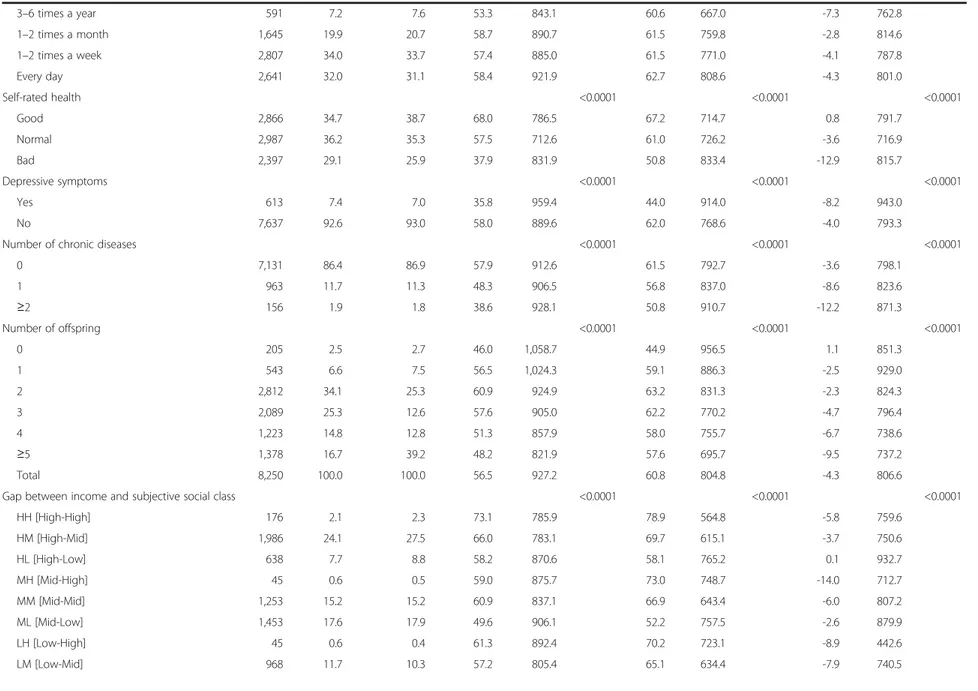
Number of contact with friend <0.0001 <0.0001 <0.0001
Never 566 6.9 6.9 40.2 1,029.0 46.6 943.8 -6.4 916.7 Kim and Park BMC Public Health (2015) 15:783 Page 4 of 15
Table 1 General characteristics of the 8,250 study subjects and association of each covariate with HRQOL, QOL, and the difference in HRQOL and QOL at baseline (2008) (Continued) 3–6 times a year 591 7.2 7.6 53.3 843.1 60.6 667.0 -7.3 762.8 1–2 times a month 1,645 19.9 20.7 58.7 890.7 61.5 759.8 -2.8 814.6 1–2 times a week 2,807 34.0 33.7 57.4 885.0 61.5 771.0 -4.1 787.8 Every day 2,641 32.0 31.1 58.4 921.9 62.7 808.6 -4.3 801.0 Self-rated health <0.0001 <0.0001 <0.0001 Good 2,866 34.7 38.7 68.0 786.5 67.2 714.7 0.8 791.7 Normal 2,987 36.2 35.3 57.5 712.6 61.0 726.2 -3.6 716.9 Bad 2,397 29.1 25.9 37.9 831.9 50.8 833.4 -12.9 815.7 Depressive symptoms <0.0001 <0.0001 <0.0001 Yes 613 7.4 7.0 35.8 959.4 44.0 914.0 -8.2 943.0 No 7,637 92.6 93.0 58.0 889.6 62.0 768.6 -4.0 793.3
Number of chronic diseases <0.0001 <0.0001 <0.0001
0 7,131 86.4 86.9 57.9 912.6 61.5 792.7 -3.6 798.1 1 963 11.7 11.3 48.3 906.5 56.8 837.0 -8.6 823.6 ≥2 156 1.9 1.8 38.6 928.1 50.8 910.7 -12.2 871.3 Number of offspring <0.0001 <0.0001 <0.0001 0 205 2.5 2.7 46.0 1,058.7 44.9 956.5 1.1 851.3 1 543 6.6 7.5 56.5 1,024.3 59.1 886.3 -2.5 929.0 2 2,812 34.1 25.3 60.9 924.9 63.2 831.3 -2.3 824.3 3 2,089 25.3 12.6 57.6 905.0 62.2 770.2 -4.7 796.4 4 1,223 14.8 12.8 51.3 857.9 58.0 755.7 -6.7 738.6 ≥5 1,378 16.7 39.2 48.2 821.9 57.6 695.7 -9.5 737.2 Total 8,250 100.0 100.0 56.5 927.2 60.8 804.8 -4.3 806.6
Gap between income and subjective social class <0.0001 <0.0001 <0.0001
HH [High-High] 176 2.1 2.3 73.1 785.9 78.9 564.8 -5.8 759.6 HM [High-Mid] 1,986 24.1 27.5 66.0 783.1 69.7 615.1 -3.7 750.6 HL [High-Low] 638 7.7 8.8 58.2 870.6 58.1 765.2 0.1 932.7 MH [Mid-High] 45 0.6 0.5 59.0 875.7 73.0 748.7 -14.0 712.7 MM [Mid-Mid] 1,253 15.2 15.2 60.9 837.1 66.9 643.4 -6.0 807.2 ML [Mid-Low] 1,453 17.6 17.9 49.6 906.1 52.2 757.5 -2.6 879.9 LH [Low-High] 45 0.6 0.4 61.3 892.4 70.2 723.1 -8.9 442.6 LM [Low-Mid] 968 11.7 10.3 57.2 805.4 65.1 634.4 -7.9 740.5 Kim and Park BMC Public Health (2015) 15:783 Page 5 of 15
Table 1 General characteristics of the 8,250 study subjects and association of each covariate with HRQOL, QOL, and the difference in HRQOL and QOL at baseline (2008) (Continued)
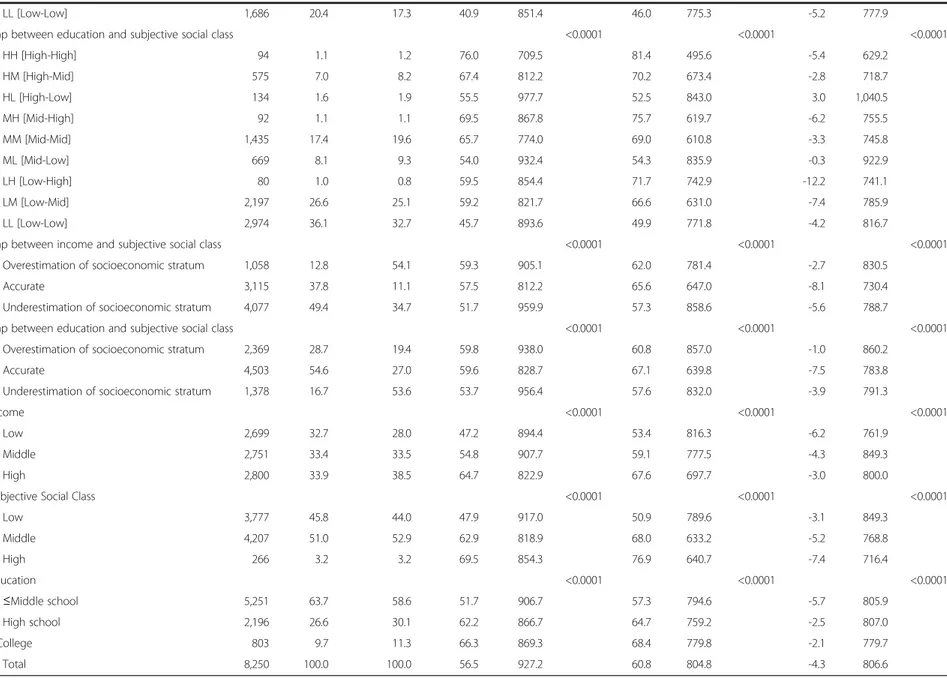
LL [Low-Low] 1,686 20.4 17.3 40.9 851.4 46.0 775.3 -5.2 777.9
Gap between education and subjective social class <0.0001 <0.0001 <0.0001
HH [High-High] 94 1.1 1.2 76.0 709.5 81.4 495.6 -5.4 629.2 HM [High-Mid] 575 7.0 8.2 67.4 812.2 70.2 673.4 -2.8 718.7 HL [High-Low] 134 1.6 1.9 55.5 977.7 52.5 843.0 3.0 1,040.5 MH [Mid-High] 92 1.1 1.1 69.5 867.8 75.7 619.7 -6.2 755.5 MM [Mid-Mid] 1,435 17.4 19.6 65.7 774.0 69.0 610.8 -3.3 745.8 ML [Mid-Low] 669 8.1 9.3 54.0 932.4 54.3 835.9 -0.3 922.9 LH [Low-High] 80 1.0 0.8 59.5 854.4 71.7 742.9 -12.2 741.1 LM [Low-Mid] 2,197 26.6 25.1 59.2 821.7 66.6 631.0 -7.4 785.9 LL [Low-Low] 2,974 36.1 32.7 45.7 893.6 49.9 771.8 -4.2 816.7
Gap between income and subjective social class <0.0001 <0.0001 <0.0001
Overestimation of socioeconomic stratum 1,058 12.8 54.1 59.3 905.1 62.0 781.4 -2.7 830.5
Accurate 3,115 37.8 11.1 57.5 812.2 65.6 647.0 -8.1 730.4
Underestimation of socioeconomic stratum 4,077 49.4 34.7 51.7 959.9 57.3 858.6 -5.6 788.7
Gap between education and subjective social class <0.0001 <0.0001 <0.0001
Overestimation of socioeconomic stratum 2,369 28.7 19.4 59.8 938.0 60.8 857.0 -1.0 860.2
Accurate 4,503 54.6 27.0 59.6 828.7 67.1 639.8 -7.5 783.8
Underestimation of socioeconomic stratum 1,378 16.7 53.6 53.7 956.4 57.6 832.0 -3.9 791.3
Income <0.0001 <0.0001 <0.0001
Low 2,699 32.7 28.0 47.2 894.4 53.4 816.3 -6.2 761.9
Middle 2,751 33.4 33.5 54.8 907.7 59.1 777.5 -4.3 849.3
High 2,800 33.9 38.5 64.7 822.9 67.6 697.7 -3.0 800.0
Subjective Social Class <0.0001 <0.0001 <0.0001
Low 3,777 45.8 44.0 47.9 917.0 50.9 789.6 -3.1 849.3 Middle 4,207 51.0 52.9 62.9 818.9 68.0 633.2 -5.2 768.8 High 266 3.2 3.2 69.5 854.3 76.9 640.7 -7.4 716.4 Education <0.0001 <0.0001 <0.0001 ≤Middle school 5,251 63.7 58.6 51.7 906.7 57.3 794.6 -5.7 805.9 High school 2,196 26.6 30.1 62.2 866.7 64.7 759.2 -2.5 807.0 ≥College 803 9.7 11.3 66.3 869.3 68.4 779.8 -2.1 779.7 Total 8,250 100.0 100.0 56.5 927.2 60.8 804.8 -4.3 806.6 Kim and Park BMC Public Health (2015) 15:783 Page 6 of 15
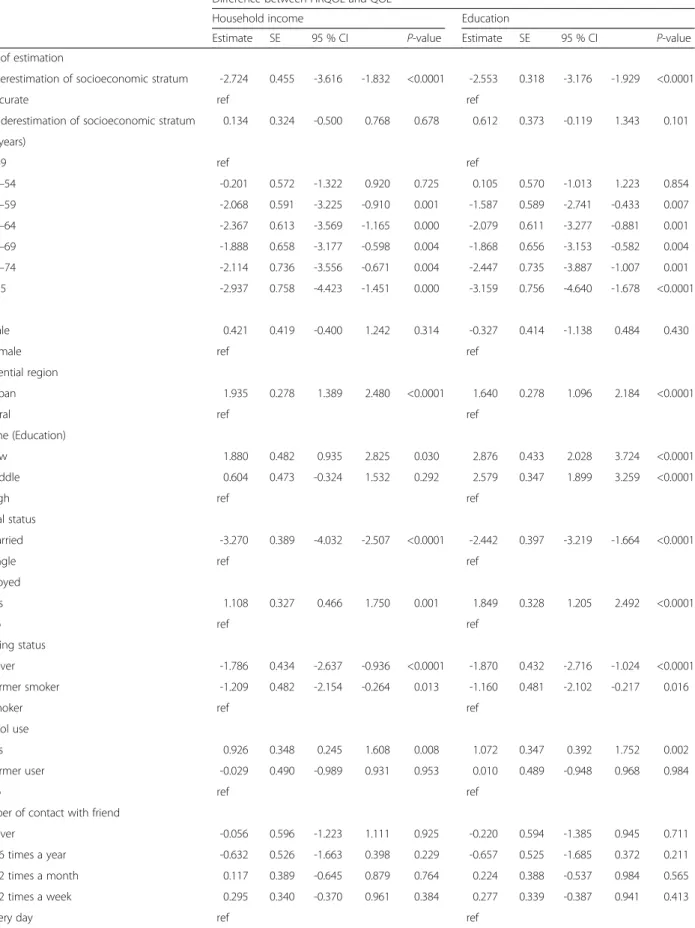
Table 2 Adjusted effect of gap between household income or education and subjective social class on difference between HRQOL and QOL
Difference between HRQOL and QOL
Household income Education
Estimate SE 95 % CI P-value Estimate SE 95 % CI P-value
Scale of estimation
Overestimation of socioeconomic stratum -2.724 0.455 -3.616 -1.832 <0.0001 -2.553 0.318 -3.176 -1.929 <0.0001
Accurate ref ref
Underestimation of socioeconomic stratum 0.134 0.324 -0.500 0.768 0.678 0.612 0.373 -0.119 1.343 0.101
Age (years) ≤49 ref ref 50–54 -0.201 0.572 -1.322 0.920 0.725 0.105 0.570 -1.013 1.223 0.854 55–59 -2.068 0.591 -3.225 -0.910 0.001 -1.587 0.589 -2.741 -0.433 0.007 60–64 -2.367 0.613 -3.569 -1.165 0.000 -2.079 0.611 -3.277 -0.881 0.001 65–69 -1.888 0.658 -3.177 -0.598 0.004 -1.868 0.656 -3.153 -0.582 0.004 70–74 -2.114 0.736 -3.556 -0.671 0.004 -2.447 0.735 -3.887 -1.007 0.001 ≥75 -2.937 0.758 -4.423 -1.451 0.000 -3.159 0.756 -4.640 -1.678 <0.0001 Sex Male 0.421 0.419 -0.400 1.242 0.314 -0.327 0.414 -1.138 0.484 0.430
Female ref ref
Residential region
Urban 1.935 0.278 1.389 2.480 <0.0001 1.640 0.278 1.096 2.184 <0.0001
Rural ref ref
Income (Education)
Low 1.880 0.482 0.935 2.825 0.030 2.876 0.433 2.028 3.724 <0.0001
Middle 0.604 0.473 -0.324 1.532 0.292 2.579 0.347 1.899 3.259 <0.0001
High ref ref
Marital status
Married -3.270 0.389 -4.032 -2.507 <0.0001 -2.442 0.397 -3.219 -1.664 <0.0001
Single ref ref
Employed Yes 1.108 0.327 0.466 1.750 0.001 1.849 0.328 1.205 2.492 <0.0001 No ref ref Smoking status Never -1.786 0.434 -2.637 -0.936 <0.0001 -1.870 0.432 -2.716 -1.024 <0.0001 Former smoker -1.209 0.482 -2.154 -0.264 0.013 -1.160 0.481 -2.102 -0.217 0.016
Smoker ref ref
Alcohol use
Yes 0.926 0.348 0.245 1.608 0.008 1.072 0.347 0.392 1.752 0.002
Former user -0.029 0.490 -0.989 0.931 0.953 0.010 0.489 -0.948 0.968 0.984
No ref ref
Number of contact with friend
Never -0.056 0.596 -1.223 1.111 0.925 -0.220 0.594 -1.385 0.945 0.711
3–6 times a year -0.632 0.526 -1.663 0.398 0.229 -0.657 0.525 -1.685 0.372 0.211
1–2 times a month 0.117 0.389 -0.645 0.879 0.764 0.224 0.388 -0.537 0.984 0.565
1–2 times a week 0.295 0.340 -0.370 0.961 0.384 0.277 0.339 -0.387 0.941 0.413
Every day ref ref
Table 2 shows the effects of various variables of interest on the difference between HRQOL and QOL. The base-line weighted mean differences between yearly HRQOL and QOL among individuals whose household income matched their subjective social class was−5.8 for individ-uals with high incomes and of high social class, −6.0 for those with medium incomes and of medium social class, and −5.2 for those with low incomes and of low social class (Table 2). In addition, Table 2 includes a scale indi-cating the effects of overestimated, accurate, or underesti-mated socioeconomic status, as reflected in subjective assessments of social class. When an individual’s subject-ive social class was higher than his/her socioeconomic status, as measured by household income, the difference between HRQOL and QOL was −2.724 (P < 0.0001); when an individual’s subjective social class was higher than his/her socioeconomic status, as measured by education, the difference between the two measures was−2.553 (P < 0.0001).
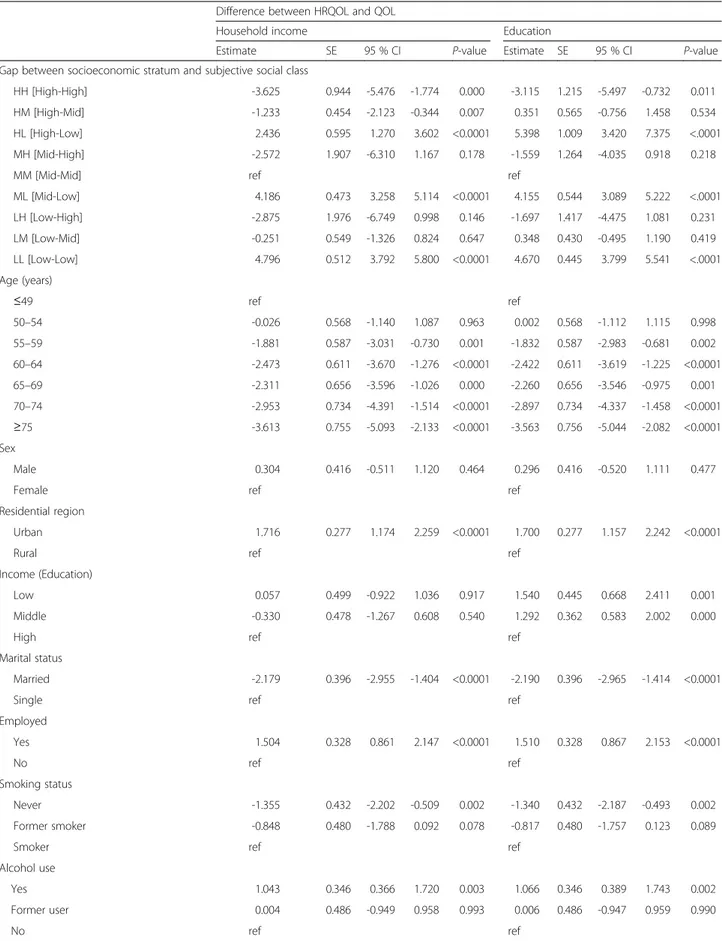
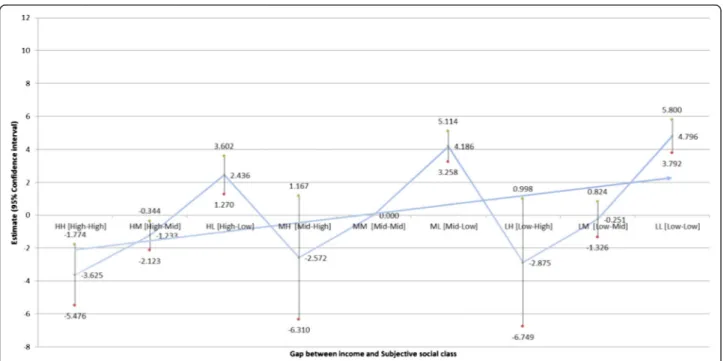
Table 3 indicates the impact of the gap between subjective social class and household income (Fig. 1) and education (Fig. 2) on the difference between HRQOL and QOL scores (Table 3). Individuals with low household incomes and of low subjective social class were the most likely to display a positive difference between HRQOL and QOL scores (B = 4.796;P < 0.0001),
while those with high household incomes and of high sub-jective social class were the least likely to exhibit such a discrepancy (B =−3.625, P = 0.000). Similarly, individuals with a low education level and of low subjective social status were the most likely to exhibit a positive differ-ence between HRQOL and QOL scores (B = 4.670; P < 0.0001), while individuals with a high education level and of high subjective social status were the least likely to do so (B =−3.115, 95 % CI: 0.568–0.862).
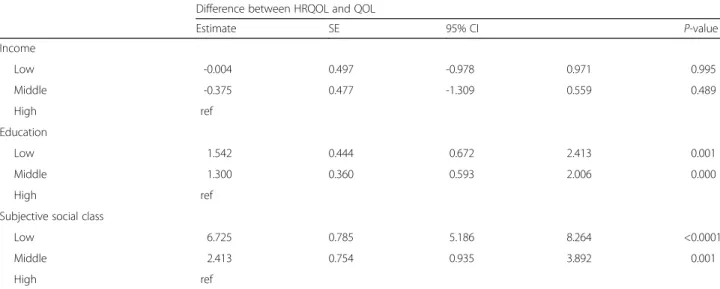
In addition, we analyzed the associations between HRQOL and QOL discrepancies and socioeconomic status (as measured by household income and educa-tion) and subjective social class (Table 4). The adjusted effect of the gap between socioeconomic status and subjective social class on the difference between HRQOL and QOL increased across the socioeconomic spectrum, but similar findings were not found with respect to household income.
Discussion
In this study, our primary purpose was to investigate the impact of disadvantaged socioeconomic status and subjective social class on QOL measurement tools (QOL and HRQOL). Furthermore, we focused on determining which dependent variable (HRQOL or QOL) is more heav-ily influenced by socioeconomic variables.
Table 2 Adjusted effect of gap between household income or education and subjective social class on difference between HRQOL and QOL (Continued)
Self-rated health
Good 11.978 0.412 11.171 12.785 <0.0001 12.173 0.410 11.369 12.976 <0.0001
Normal 8.307 0.373 7.577 9.037 <0.0001 8.359 0.371 7.631 9.087 <0.0001
Bad ref ref
Depressive symptoms
Yes -0.331 0.569 -1.446 0.785 0.562 -0.585 0.568 -1.699 0.528 0.303
No ref ref
Number of chronic diseases
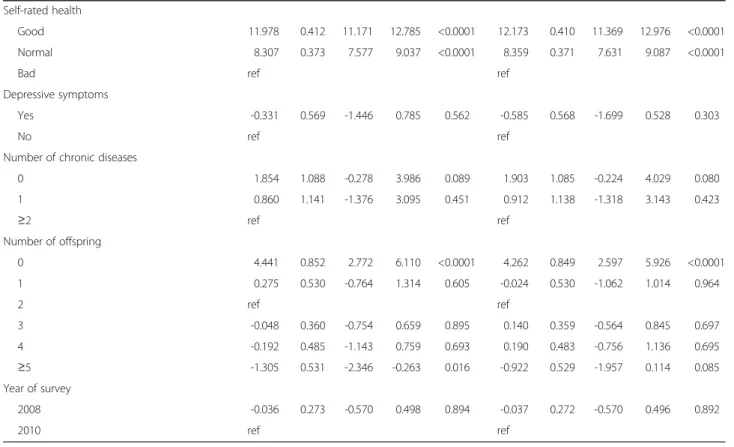
0 1.854 1.088 -0.278 3.986 0.089 1.903 1.085 -0.224 4.029 0.080 1 0.860 1.141 -1.376 3.095 0.451 0.912 1.138 -1.318 3.143 0.423 ≥2 ref ref Number of offspring 0 4.441 0.852 2.772 6.110 <0.0001 4.262 0.849 2.597 5.926 <0.0001 1 0.275 0.530 -0.764 1.314 0.605 -0.024 0.530 -1.062 1.014 0.964 2 ref ref 3 -0.048 0.360 -0.754 0.659 0.895 0.140 0.359 -0.564 0.845 0.697 4 -0.192 0.485 -1.143 0.759 0.693 0.190 0.483 -0.756 1.136 0.695 ≥5 -1.305 0.531 -2.346 -0.263 0.016 -0.922 0.529 -1.957 0.114 0.085 Year of survey 2008 -0.036 0.273 -0.570 0.498 0.894 -0.037 0.272 -0.570 0.496 0.892 2010 ref ref
Table 3 Adjusted effect of gap between household income or education levels and subjective social class on difference between HRQOL and QOL
Difference between HRQOL and QOL
Household income Education
Estimate SE 95 % CI P-value Estimate SE 95 % CI P-value
Gap between socioeconomic stratum and subjective social class
HH [High-High] -3.625 0.944 -5.476 -1.774 0.000 -3.115 1.215 -5.497 -0.732 0.011
HM [High-Mid] -1.233 0.454 -2.123 -0.344 0.007 0.351 0.565 -0.756 1.458 0.534
HL [High-Low] 2.436 0.595 1.270 3.602 <0.0001 5.398 1.009 3.420 7.375 <.0001
MH [Mid-High] -2.572 1.907 -6.310 1.167 0.178 -1.559 1.264 -4.035 0.918 0.218
MM [Mid-Mid] ref ref
ML [Mid-Low] 4.186 0.473 3.258 5.114 <0.0001 4.155 0.544 3.089 5.222 <.0001 LH [Low-High] -2.875 1.976 -6.749 0.998 0.146 -1.697 1.417 -4.475 1.081 0.231 LM [Low-Mid] -0.251 0.549 -1.326 0.824 0.647 0.348 0.430 -0.495 1.190 0.419 LL [Low-Low] 4.796 0.512 3.792 5.800 <0.0001 4.670 0.445 3.799 5.541 <.0001 Age (years) ≤49 ref ref 50–54 -0.026 0.568 -1.140 1.087 0.963 0.002 0.568 -1.112 1.115 0.998 55–59 -1.881 0.587 -3.031 -0.730 0.001 -1.832 0.587 -2.983 -0.681 0.002 60–64 -2.473 0.611 -3.670 -1.276 <0.0001 -2.422 0.611 -3.619 -1.225 <0.0001 65–69 -2.311 0.656 -3.596 -1.026 0.000 -2.260 0.656 -3.546 -0.975 0.001 70–74 -2.953 0.734 -4.391 -1.514 <0.0001 -2.897 0.734 -4.337 -1.458 <0.0001 ≥75 -3.613 0.755 -5.093 -2.133 <0.0001 -3.563 0.756 -5.044 -2.082 <0.0001 Sex Male 0.304 0.416 -0.511 1.120 0.464 0.296 0.416 -0.520 1.111 0.477
Female ref ref
Residential region
Urban 1.716 0.277 1.174 2.259 <0.0001 1.700 0.277 1.157 2.242 <0.0001
Rural ref ref
Income (Education)
Low 0.057 0.499 -0.922 1.036 0.917 1.540 0.445 0.668 2.411 0.001
Middle -0.330 0.478 -1.267 0.608 0.540 1.292 0.362 0.583 2.002 0.000
High ref ref
Marital status
Married -2.179 0.396 -2.955 -1.404 <0.0001 -2.190 0.396 -2.965 -1.414 <0.0001
Single ref ref
Employed Yes 1.504 0.328 0.861 2.147 <0.0001 1.510 0.328 0.867 2.153 <0.0001 No ref ref Smoking status Never -1.355 0.432 -2.202 -0.509 0.002 -1.340 0.432 -2.187 -0.493 0.002 Former smoker -0.848 0.480 -1.788 0.092 0.078 -0.817 0.480 -1.757 0.123 0.089
Smoker ref ref
Alcohol use
Yes 1.043 0.346 0.366 1.720 0.003 1.066 0.346 0.389 1.743 0.002
Former user 0.004 0.486 -0.949 0.958 0.993 0.006 0.486 -0.947 0.959 0.990
No ref ref
Table 3 Adjusted effect of gap between household income or education levels and subjective social class on difference between HRQOL and QOL (Continued)
Number of contact with friend
Never -0.607 0.592 -1.768 0.554 0.306 -0.618 0.593 -1.780 0.543 0.297
3-6 times a year -0.625 0.522 -1.649 0.399 0.232 -0.628 0.523 -1.652 0.396 0.230
1-2 times a month 0.229 0.386 -0.528 0.986 0.553 0.224 0.386 -0.533 0.981 0.563
1-2 times a week 0.313 0.337 -0.348 0.974 0.354 0.329 0.337 -0.333 0.990 0.330
Every day ref ref
Self-rated health
Good 13.221 0.417 12.404 14.038 <0.0001 13.183 0.416 12.366 13.999 <0.0001
Normal 8.858 0.372 8.128 9.588 <0.0001 8.804 0.372 8.076 9.532 <0.0001
Bad ref ref
Depressive symptoms
Yes -0.733 0.566 -1.842 0.376 0.196 -0.696 0.566 -1.805 0.412 0.219
No ref ref
Number of chronic diseases
0 1.948 1.080 -0.169 4.065 0.072 1.971 1.080 -0.146 4.088 0.068 1 1.038 1.133 -1.182 3.258 0.360 1.056 1.133 -1.164 3.277 0.351 ≥2 ref ref Number of offspring 0 3.458 0.848 1.796 5.120 0.000 3.506 0.847 1.845 5.167 <0.0001 1 -0.171 0.527 -1.205 0.862 0.746 -0.174 0.527 -1.208 0.860 0.742 2 ref ref 3 0.003 0.358 -0.698 0.705 0.992 -0.018 0.358 -0.720 0.683 0.960 4 -0.216 0.482 -1.160 0.728 0.655 -0.228 0.482 -1.173 0.716 0.637 ≥5 -1.394 0.528 -2.428 -0.360 0.010 -1.412 0.528 -2.446 -0.377 0.009 Year of survey 2008 -0.136 0.271 -0.666 0.395 0.616 -0.132 0.271 -0.662 0.399 0.627 2010 ref ref
Table 4 Adjusted effect of the gap between socioeconomic stratum and subjective social class on difference between HRQOL and QOLa
Difference between HRQOL and QOL
Estimate SE 95% CI P-value Income Low -0.004 0.497 -0.978 0.971 0.995 Middle -0.375 0.477 -1.309 0.559 0.489 High ref Education Low 1.542 0.444 0.672 2.413 0.001 Middle 1.300 0.360 0.593 2.006 0.000 High ref
Subjective social class
Low 6.725 0.785 5.186 8.264 <0.0001
Middle 2.413 0.754 0.935 3.892 0.001
High ref
a
Models adjusted for age, sex, residential region, marital status, employment status, smoking status, alcohol consumption, number of contact with friend, self-rated health, depressive symptoms, and year of survey
To do so, we conducted a longitudinal assessment of a nationally representative sample of adults aged 45 years and higher in South Korea.
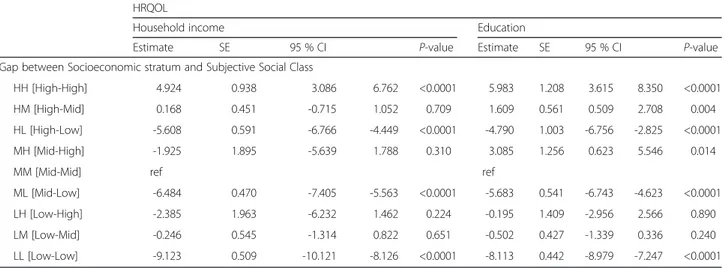
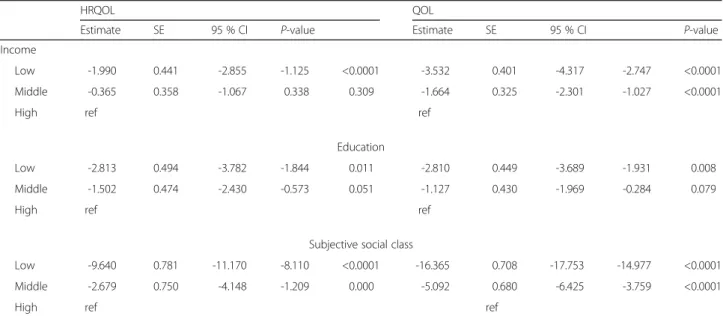
Overall, the variation in QOL observed in relation to SES was greater than the variation observed in HRQOL (Appendix 1 and 2), but subjective social class was more strongly associated with both HRQOL and QOL than either income or education (Appendix 3).
We found that gaps between income and subjective social class were associated with increased differences
between HRQOL and QOL, as were gaps between educa-tion and subjective social class. The QOL scores of individuals of high subjective social class tended to be higher than their HRQOL scores, whereas the HRQOL scores of individuals of low subjective social class tended to be higher than their QOL scores. This trend was observed at all levels of household income and education. That is, for a given household income, the probability that HRQOL was higher than QOL increased as subjective social class de-creased. Similarly, the probability of HRQOL being higher Fig. 1 Adjusted effect of the gap between income and subjective social class on difference between HRQOL and QOL
Fig. 2 Adjusted effect of the gap between education level and subjective social class on difference between HRQOL and QOL
than QOL was elevated in individuals with low household income (or low education) and of low subjective social class. Our results indicated that within any socioeconomic stratum, those of low subjective social class tended to exhibit a greater difference between HRQOL and QOL scores.
These associations were independent of sociodemo-graphic variables (age, sex, residential region, income, education, marital status, and employment status), health risks and behavioral variables (amount of contact with friends, smoking status, and alcohol use), health status (self-rated health, depressive symptoms, and number of chronic diseases), number of offspring, and the year of the survey.
Research has suggested that patients suffering from depression exhibit similar or worse subjective QOL scores than patients with chronic medical conditions or other severe mental illnesses (e.g., schizophrenia or bipolar disorder) [23]. Furthermore, researchers have found that effective treatments for depression do not always improve subjective QOL [34, 35]. It is generally agreed that subjective QOL is a con-struct determined by multiple factors [36]. Researchers have suggested that various clinical, sociodemographic, or biological factors may moderate subjective QOL and that value systems and cultural factors in particular may have a strong influence.
To date, there have been few studies examining the relationship between SES and HRQOL in Asian countries. Lam et al. examined the effect of HRQOL on health service utilitilization and validated the SF12 Health Survey in a Chinese sample [37]. In addition, several recent stud-ies have examined SES and HRQOL, but all have focused on special populations such as the elderly living alone [38], the elderly with hearing impairments [39], or patients with diseases [40]. Meanwhile, studies regarding QOL and its relation to sociodemographic characteristics in South Korea have yielded inconsistent findings [41, 42]. Suh [42] found that education, income, employment status, and stage of disease impacted QOL, whereas age, religion, mari-tal status, and type of adjunct therapy do not. However, Shim and Park [41] reported that“being religious” was the only sociodemographic characteristic that influenced QOL; age, education, employment status, income, time since operation, and number of chemotherapy rounds did not.
QOL, as defined by the World Health Organization (WHO), is a multidimensional construct with numerous physical, psychological, social, and economic components [28]. Despite the uncertainty inherent in the definition, HRQOL is a construct of high clinical relevance, as recent research has shown that it is an important predictor of other health outcomes [43]. Therefore, it has become increasingly important to understand the socioeconomic factors that influence QOL, including HRQOL [44], and our findings support previous research on this subject.
Our study’s purpose was to explore two separate socio-economic measures and their effects on differences between HRQOL and overall QOL. In conclusion, the combination
of high income-based status and subjective social class was found to have a greater impact on the difference between HRQOL and QOL scores (when comparing between HH and LL groups) than the combination of high education-based status and subjective social class. In addition, the combinations of household income/subjective social class and education/subjective social classes were both found to have an impact on the difference between QOL and HRQOL. Further studies are needed to test our hypothesis by developing precise socioeconomic measures (income, education and subjective social class) and determining their predictive value with respect to QOL or HRQOL.
Our study has a number of strengths and limitations. A major strength is that the participants in the survey are rep-resentative of the overall South Korean adult population and, because the sample size is large, our results can be generalized to the national level. Nevertheless, the potential for bias exists. For example, current household income may not adequately represent the standard of living for retired individuals, because it may not reflect all financial resources available; in addition, it disregards the cumulative effects of a lifetime of deprivation or privilege. Moreover, because current income may be a product of recent health, associa-tions between income and health are subject to reverse-causation problems. A second problem is that respondents’ reports of their social class, depressive symptoms, QOL, and HRQOL are subjective and imperfect measures that may be affected by false consciousness or adaptation to re-sources. Third, because personality characteristics are likely to be associated with both subjective social class and QOL, including HRQOL, failure to include them in statistical models may lead to a distortion of the results and an exag-geration of observed effects. In addition to the above poten-tial biases, which are likely to inflate the associations between subjective social class and some health variables, we recognize that our estimates may understate the poten-tial effects of all factors on the difference between HRQOL and QOL due to the short follow-up period in our analysis. Fourth, although we analyzed longitudinal data, the results may reflect a bidirectional relationship in the association between the difference between HRQOL and QOL and dis-advantaged socioeconomic status and subjective social class. Conclusions
According to our results, combined measures of household income/subjective social class and education/subjective social classes were both found to have an impact on the difference between QOL and HRQOL. Therefore, socio-economic inequalities should be taken into account when designing interventions focusing on psychosocial factors. Our study provides additional evidence that gaps between socioeconomic status and perceived position in the social hierarchy may have important health implications with regard to the difference between HRQOL and QOL.
Appendix 1
Table 5 Adjusted effect of the gap between subjective social class and household income and education level on HRQOLa HRQOL
Household income Education
Estimate SE 95 % CI P-value Estimate SE 95 % CI P-value
Gap between Socioeconomic stratum and Subjective Social Class
HH [High-High] 4.924 0.938 3.086 6.762 <0.0001 5.983 1.208 3.615 8.350 <0.0001
HM [High-Mid] 0.168 0.451 -0.715 1.052 0.709 1.609 0.561 0.509 2.708 0.004
HL [High-Low] -5.608 0.591 -6.766 -4.449 <0.0001 -4.790 1.003 -6.756 -2.825 <0.0001
MH [Mid-High] -1.925 1.895 -5.639 1.788 0.310 3.085 1.256 0.623 5.546 0.014
MM [Mid-Mid] ref ref
ML [Mid-Low] -6.484 0.470 -7.405 -5.563 <0.0001 -5.683 0.541 -6.743 -4.623 <0.0001
LH [Low-High] -2.385 1.963 -6.232 1.462 0.224 -0.195 1.409 -2.956 2.566 0.890
LM [Low-Mid] -0.246 0.545 -1.314 0.822 0.651 -0.502 0.427 -1.339 0.336 0.240
LL [Low-Low] -9.123 0.509 -10.121 -8.126 <0.0001 -8.113 0.442 -8.979 -7.247 <0.0001
a
Adjusted for age, sex, residential region, income (education), marital status, employment status, smoking status, alcohol use, number of contact with friend, self-rated health, depressive symptoms, number of chronic diseases, number of offspring, and year of survey
Table 6 Adjusted effect of the gap between subjective social class and household income and education level on QOLa QOL
Household income Education
Estimate SE 95% CI P-value Estimate SE 95% CI P-value
Gap between Socioeconomic stratum and Subjective Social Class
HH [High-High] 8.549 0.850 6.883 10.215 <0.0001 9.097 1.096 6.950 11.244 <0.0001
HM [High-Mid] 1.402 0.409 0.601 2.203 0.001 1.258 0.509 0.260 2.255 0.014
HL [High-Low] -8.044 0.536 -9.094 -6.994 <0.0001 -10.188 0.910 -11.971 -8.405 <0.0001
MH [Mid-High] 0.646 1.717 -2.720 4.012 0.707 4.643 1.139 2.411 6.876 <0.0001
MM [Mid-Mid] ref ref
ML [Mid-Low] -10.670 0.426 -11.505 -9.835 <0.0001 -9.838 0.490 -10.799 -8.877 <0.0001
LH [Low-High] 0.491 1.779 -2.997 3.978 0.783 1.501 1.278 -1.003 4.005 0.240
LM [Low-Mid] 0.005 0.494 -0.963 0.973 0.992 -0.849 0.388 -1.609 -0.090 0.029
LL [Low-Low] -13.919 0.461 -14.823 -13.015 <0.0001 -12.783 0.401 -13.568 -11.998 <0.0001
a
Adjusted for age, sex, residential region, income (education), marital status, employment status, smoking status, alcohol use, number of contact with friend, self-rated health, depressive symptoms, number of chronic diseases, number of offspring, and year of survey
Appendix 2
Competing interests
The authors declare that they have no competing interests.
Authors’ contributions
Acquisition of data, conceived and designed the experiments: JHK Performed the experiments: JHK, ECP Analyzed the data: JHK, ECP Wrote the manuscript: JHK. All authors read and approved the final manuscript.
Acknowledgment
The authors are grateful to all the authors of the papers included in this review who responded to our emails to provide additional information about their studies.
Author details
1Department of Public Health, Graduate School, Yonsei University, Seoul,
Republic of Korea.2Institute of Health Services Research, Yonsei University, Seoul, Republic of Korea.3Department of Preventive Medicine, Yonsei
University College of Medicine, Seodaemun-gu, Seoul, Republic of Korea.
Received: 15 October 2014 Accepted: 2 July 2015
References
1. Anderson RT, Sorlie P, Backlund E, Johnson N, Kaplan GA. Mortality effects of community socioeconomic status. Epidemiology. 1997;8(1):42–7.
2. Kennedy BP, Kawachi I, Glass R, Prothrow-Stith D. Income distribution, socioeconomic status, and self rated health in the United States: multilevel analysis. BMJ. 1998;317(7163):917–21.
3. Marmot MG, Smith GD, Stansfeld S, Patel C, North F, Head J, et al. Health Inequalities among British Civil-Servants - the Whitehall-Ii Study. Lancet. 1991;337(8754):1387–93.
4. Regidor E, Barrio G, de la Fuente L, Domingo A, Rodriguez C, Alonso J. Association between educational level and health related quality of life in Spanish adults. J Epidemiol Commun H. 1999;53(2):75–82.
5. Thumboo J, Fong KY, Machin D, Chan SP, Soh CH, Leong KH, et al. Quality of life in an urban Asian population: the impact of ethnicity and socio-economic status. Soc Sci Med. 2003;56(8):1761–72.
6. Starfield B, Robertson J, Riley AW. Social class gradients and health in childhood. Ambulatory pediatrics: the official journal of the Ambulatory Pediatric Association. 2002;2(4):238–46.
7. Fiscella K. Is lower income associated with greater biopsychosocial morbidity? Implications for physicians working with underserved patients. J Fam Practice. 1999;48(5):372–7.
8. Marmot M, Shipley M, Brunner E, Hemingway H. Relative contribution of early life and adult socioeconomic factors to adult morbidity in the Whitehall II study. J Epidemiol Community Health. 2001;55(5):301–7. 9. Wong MD, Shapiro MF, Boscardin WJ, Ettner SL. Contribution of major
diseases to disparities in mortality. N Engl J Med. 2002;347(20):1585–92. 10. Mackenbach JP, Kunst AE, Cavelaars AE, Groenhof F, Geurts JJ.
Socioeconomic inequalities in morbidity and mortality in western Europe. The EU Working Group on Socioeconomic Inequalities in Health. Lancet. 1997;349(9066):1655–9.
11. Apter AJ, Reisine ST, Affleck G, Barrows E, ZuWallack RL. The influence of demographic and socioeconomic factors on health-related quality of life in asthma. The Journal of allergy and clinical immunology. 1999;103(1 Pt 1):72–8.
12. Liberatos P, Link BG, Kelsey JL. The measurement of social class in epidemiology. Epidemiol Rev. 1988;10:87–121.
13. Kane CJ, Lubeck DP, Knight SJ, Spitalny M, Downs TM, Grossfeld GD, et al. Impact of patient educational level on treatment for patients with prostate cancer: data from CaPSURE. Urology. 2003;62(6):1035–9.
14. Wilkinson S, List M, Sinner M, Dai L, Chodak G. Educating African-American men about prostate cancer: Impact on awareness and knowledge. Urology. 2003;61(2):308–13.
15. Brar R, Maliski SL, Kwan L, Krupski TL, Litwin MS. Changes in quality of life among low-income men treated for prostate cancer. Urology. 2005;66(2):344–9.
16. Adler NE, Boyce T, Chesney MA, Cohen S, Folkman S, Kahn RL, et al. Socioeconomic status and health. The challenge of the gradient. The American psychologist. 1994;49(1):15–24.
17. Singh-Manoux A, Adler NE, Marmot MG. Subjective social status: its determinants and its association with measures of ill-health in the Whitehall II study. Soc Sci Med. 2003;56(6):1321–33.
18. Singh-Manoux A, Marmot MG, Adler NE. Does subjective social status predict health and change in health status better than objective status? Psychosom Med. 2005;67(6):855–61.
19. Wilkinson RG. Income distribution and life expectancy. BMJ. 1992;304(6820):165–8.
20. Operario D, Adler NE, Williams DR. Subjective social status: Reliability and predictive utility for global health. Psychol Health. 2004;19(2):237–46.
Table 7 Adjusted effect of the gap between socioeconomic stratum and subjective social class on HRQOL and QOLa
HRQOL QOL
Estimate SE 95 % CI P-value Estimate SE 95 % CI P-value
Income
Low -1.990 0.441 -2.855 -1.125 <0.0001 -3.532 0.401 -4.317 -2.747 <0.0001
Middle -0.365 0.358 -1.067 0.338 0.309 -1.664 0.325 -2.301 -1.027 <0.0001
High ref ref
Education
Low -2.813 0.494 -3.782 -1.844 0.011 -2.810 0.449 -3.689 -1.931 0.008
Middle -1.502 0.474 -2.430 -0.573 0.051 -1.127 0.430 -1.969 -0.284 0.079
High ref ref
Subjective social class
Low -9.640 0.781 -11.170 -8.110 <0.0001 -16.365 0.708 -17.753 -14.977 <0.0001
Middle -2.679 0.750 -4.148 -1.209 0.000 -5.092 0.680 -6.425 -3.759 <0.0001
High ref ref
a
Adjusted for age, sex, residential region, income (education), marital status, employment status, smoking status, alcohol use, number of contact with friend, self-rated health, depressive symptoms, number of chronic diseases, number of offspring, and year of survey
Appendix 3
21. Adler NE, Epel ES, Castellazzo G, Ickovics JR. Relationship of subjective and objective social status with psychological and physiological functioning: preliminary data in healthy white women. Health psychology: official journal of the Division of Health Psychology, American Psychological Association. 2000;19(6):586–92.
22. Kopp MS, Skrabski A, Kawachi I, Adler NE. Low socioeconomic status of the opposite sex is a risk factor for middle aged mortality. J Epidemiol Commun H. 2005;59(8):675–8.
23. Papakostas GI, Petersen T, Mahal Y, Mischoulon D, Nierenberg AA, Fava M. Quality of life assessments in major depressive disorder: a review of the literature. Gen Hosp Psychiatry. 2004;26(1):13–7.
24. Bobak M, Pikhart H, Hertzman C, Rose R, Marmot M. Socioeconomic factors, perceived control and self-reported health in Russia. A cross-sectional survey. Soc Sci Med. 1998;47(2):269–79.
25. Ashing-Giwa KT, Padilla G, Tejero J, Kraemer J, Wright K, Coscarelli A, et al. Understanding the breast cancer experience of women: a qualitative study of African American, Asian American, Latina and Caucasian cancer survivors. Psycho-Oncology. 2004;13(6):408–28.
26. Augustus JS, Kwan L, Fink A, Connor SE, Maliski SL, Litwin MS. Education as a predictor of quality of life outcomes among disadvantaged men. Prostate Cancer P D. 2009;12(3):253–8.
27. Drotar D. Measuring health-related quality of life in children and adolescents : implications for research and practice. Mahwah, NJ: Lawrence Erlbaum Associates, Publishers; 1998. p. 372.
28. World Health Organization Quality of Life Assessment Group. The World Health Organization Quality of Life assessment (WHOQOL): position paper from the World Health Organization. Soc Sci Med. 1995;41(10):1403–9. 29. Ware Jr JE. Conceptualization and measurement of health-related quality of
life: comments on an evolving field. Arch Phys Med Rehabil. 2003;84(4 Suppl 2):S43–51.
30. Eltahir Y, Werners LLCH, Dreise MM, van Emmichoven IAZ, Jansen L, Werker PMN, et al. Quality-of-Life Outcomes between Mastectomy Alone and Breast Reconstruction: Comparison of Patient-Reported BREAST-Q and Other Health-Related Quality-of-Life Measures. Plast Reconstr Surg. 2013;132(2):201e–9e.
31. Kim JH, Park EC. Influence of offspring on quality of life among cancer patients and survivors: results from the Korean longitudinal study of aging (KLoSA), 2008–2011. Asian Pac J Cancer Prev. 2014;15(23):10531–7. 32. Oh B, Cho B, Choi HC, Son KY, Park SM, Chun S, et al. The influence of
lower-extremity function in elderly individuals' quality of life (QOL): an analysis of the correlation between SPPB and EQ-5D. Arch Gerontol Geriatr. 2014;58(2):278–82.
33. Kim JH, Kim KR, Cho KH, Yoo KB, Kwon JA, Park EC. The Association between Sleep Duration and Self-Rated Health in the Korean General Population. J Clin Sleep Med. 2013;9(10):1057–64.
34. Hirschfeld RMA, Dunner DL, Keitner G, Klein DN, Koran LM, Kornstein SG, et al. Does psychosocial functioning improve independent of depressive symptoms? A comparison of nefazodone, psychotherapy, and their combination. Biol Psychiat. 2002;51(2):123–33.
35. Trivedi MH, Rush AJ, Wisniewski SR, Warden D, McKinney W, Downing M, et al. Factors associated with health-related quality of life among outpatients with major depressive disorder: A STAR*D report. J Clin Psychiat. 2006;67(2):185–95.
36. Taylor JE, Poston 2nd WS, Haddock CK, Blackburn GL, Heber D, Heymsfield SB, et al. Psychometric characteristics of the General Well-Being Schedule (GWB) with African-American women. Qual Life Res Int J Qual Life Asp Treat Care Rehab. 2003;12(1):31–9.
37. Lam CL, Fong DY, Lauder IJ, Lam TP. The effect of health-related quality of life (HRQOL) on health service utilisation of a Chinese population. Soc Sci Med. 2002;55(9):1635–46.
38. Wang HCK, Chen K, Zhou B, Wang JF. Study on social determinants and health-related quality of life among the‘empty nest’ (lonely) elderly Chinese people. Zhonghua Liu Xing Bing Xue Za Zhi. 2010;31:400–4.
39. Wong LL, Cheng LK. Quality of life in older Chinese-speaking adults with hearing impairment. Disabil Rehabil. 2012;34(8):655–64.
40. Jia TW, Utzinger J, Deng Y, Yang K, Li YY, Zhu JH, et al. Quantifying quality of life and disability of patients with advanced schistosomiasis japonica. PLoS Negl Trop Dis. 2011;5(2):e966.
41. Shim J, Park K. A study on quality of life of those who have breast cancer patients taking chemotherapy. Journal of Korean Academy of Adult Nursing. 2004;16:49–59.
42. Suh Y. Predictors of quality of life in women with breast cancer. J Korean Acad Nurs. 2007;37:459–66.
43. Failde I, Ramos I. Validity and reliability of the SF-36 Health Survey Questionnaire in patients with coronary artery disease. J Clin Epidemiol. 2000;53(4):359–65.
44. Cassedy A, Drotar D, Ittenbach R, Hottinger S, Wray J, Wernovsky G, et al. The impact of socio-economic status on health related quality of life for children and adolescents with heart disease. Health Qual Life Outcomes. 2013;11:99.
Submit your next manuscript to BioMed Central and take full advantage of:
• Convenient online submission • Thorough peer review
• No space constraints or color figure charges • Immediate publication on acceptance
• Inclusion in PubMed, CAS, Scopus and Google Scholar • Research which is freely available for redistribution
Submit your manuscript at www.biomedcentral.com/submit