저작자표시-비영리-변경금지 2.0 대한민국 이용자는 아래의 조건을 따르는 경우에 한하여 자유롭게 l 이 저작물을 복제, 배포, 전송, 전시, 공연 및 방송할 수 있습니다. 다음과 같은 조건을 따라야 합니다: l 귀하는, 이 저작물의 재이용이나 배포의 경우, 이 저작물에 적용된 이용허락조건 을 명확하게 나타내어야 합니다. l 저작권자로부터 별도의 허가를 받으면 이러한 조건들은 적용되지 않습니다. 저작권법에 따른 이용자의 권리는 위의 내용에 의하여 영향을 받지 않습니다. 이것은 이용허락규약(Legal Code)을 이해하기 쉽게 요약한 것입니다. Disclaimer 저작자표시. 귀하는 원저작자를 표시하여야 합니다. 비영리. 귀하는 이 저작물을 영리 목적으로 이용할 수 없습니다. 변경금지. 귀하는 이 저작물을 개작, 변형 또는 가공할 수 없습니다.
A Thesis for The Degree of Doctor of Philosophy
Development of Artificial
Intelligence-based Climate Control
System for Smart Greenhouse
August 2020
Graduate School of College of Agriculture and
Life Sciences
Seoul National University
Major in Biosystems Engineering
T
ABLE OF
C
ONTENTS
Development of Artificial Intelligence-based Climate Control System
for Smart Greenhouse ... i
List of figures ... vii
List of tables ... xiii
Abstract ... xv
1 Introduction ... 1
1.1. Study Background ... 1
1.2. Problem statement ... 6
1.3. Objectives and Aims ... 11
1.3.1.Overall Objective ... 11
1.3.2.Specific Aims ... 11
2. Literature Review ... 15
2.1. Overview of research trend ... 15
2.2. Control models for inside climate in greenhouse ... 21
2.3. Deep learning-based environmental modeling ... 24
2.4. Applications of AI to climate control ... 30
3. Development of multivariable climate control system based on linear algorithm... 33
3.1. Description of climate control system in smart greenhouse ... 37
3.1.1. Hardware of controller ... 37
3.1.2. Control software ... 43
3.2. Multivariable climate control based on a linear algorithm ... 49
3.2.2. CO2 control ... 53
3.2.3. Humidity control ... 55
3.2.4. Heat retention curtain and shade curtain control ... 58
3.2.5.Heating control ... 64 3.3.Experimental results for the optimal coefficients of ventilation
3.3.1.Application results of PD-band ventilation control ... 68
3.3.2.Results of the linear regression model ... 69
3.3.3.Results of the surface response analysis for optimizing the coefficients ... 73
3.4.Chapter conclusion ... 77
4. Greenhouse inside climate prediction based on artificial intelligence model ... 79
4.1.Machine learning (ML) estimation model ... 81
4.1.1.Machine learning-based prediction model for inside climate change of greenhouse ... 81
4.1.2.Artificial neural network-based prediction model for greenhouse inside climate ... 82
4.1.3.Gradient descent method ... 84
4.1.4.Gauss-newton method ... 85
4.1.5.Levenberg-Marquardt method ... 86
4.2.Time-series based algorithm model... 89
4.2.1.Recurrent neural network ... 89
4.2.2.Long short-term memory ... 91
4.2.3.Nonlinear autoregressive exogenous NARX ... 94
4.3.Development of prediction model by time step ... 95
4.4.The results of time-series prediction models ... 98
4.4.1.Prediction performance of various time step ... 98
4.4.2.Comparison of validation results for the three models in various training conditions ... 104
4.5.Convolutional neural network (CNN)-LSTM models for climate prediction ... 108
4.5.1.Convolutional layer ... 109
4.5.2.Pooling ... 110
4.5.5.The results of CNN-LSTM based climate models ... 114 4.5.6.The results of CNN-LSTM based substrate models ... 116 4.5.7.Comparison of training performance between RNN-LSTM and
CNN-LSTM ... 118 4.5.8. Study to improve the humidity prediction performance
considering the amount of evapotranspiration rate (ET) ... 122 4.6. Automated learning system for deep learning models based on e
mbedded board ... 127 4.6.1. Experimental environment and control conditions ... 129 4.6.2. Deep learning model implementation and automatic learning algorithm
... 129 4.6.3. The results of automated learning system ... 132 4.7. Chapter conclusion ... 137
5. Development of climate control system based on artificial intelligence
... 139 5.1. Output feedback neural network (OFNN) model for optimal control
... 141 5.1.1. Performance comparison by optimization module ... 142 5.1.2. Exploring gradient descent-based optimizers for linear regression
example ... 147 5.1.3. Greenhouse control signal determination for performance
comparison of optimization algorithm ... 152 5.2. Output Feedback Neural Network (OFNN) application for optimal
ventilation control ... 160 5.2.1. Neural-network-based temperature prediction model ... 161 5.3. Application of OFNN to ventilation control of single span greenhouse
... 166 5.3.1. Description of experimental greenhouse ... 166 5.3.2. Simulation and field experiment testing ... 169
5.3.4. Simulation and field test results ... 173
5.4. Chapter conclusion ... 180
6. Development of artificial intelligence control logic considering the energy use efficiency of greenhouse... 181
6.1. Design of energy use efficiency in cost function ... 182
6.1.1. Energy consumption module ... 182
6.2. Simulation study considering energy optimization in deep learning model and OFNN structure ... 183
6.2.1. Greenhouse operating costs for actuators ... 183
6.3. AI control simulation analysis results by seasonal climate ... 194
6.3.1. Comparison of simulation results in winter climate ... 195
6.3.2. Comparison of simulation results in spring climate ... 200
6.3.3. Comparison of simulation results in summer climate ... 205
6.4. Field test and results ... 210
6.5. Chapter conclusion ... 219
7. Overall conclusion and Discussion ... 220
8. Appendices ... 239
8.1. Design and applicability of reinforcement learning to the optimal climate control ... 239
L
IST OF FIGURES
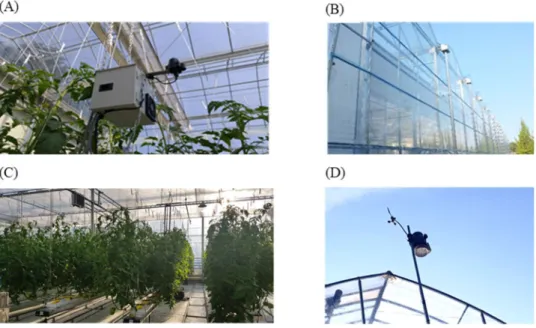
Figure 1. Smart agriculture market size and growth prospects (revenue in million USD) 2014–2025 (Sources: Agfunder, EPA, World Bank Reports, Drone Blog, ICT Update, company annual reports, primary interviews, and Grand View Research) ...3 Figure 2. Global artificial intelligence (AI) market in agriculture, 2017–2026 (million USD) (top) and growth of AI in the agricultural market between 2020 and 2026 (bottom). (Sources: Annual reports, press releases, investor presentations, expert interviews, Association for the Advancement of Artificial Intelligence, Artificial Intelligence Association of India, Chinese Association for Artificial Intelligence, Pattern Recognition and Machine Intelligence Association, and market analysis). ...4 Figure 3. Overview of ICT-based smart farm ...6 Figure 4. Example of temperature changes in a typical greenhouse using a commercial controller. ...7 Figure 5. The relationship between various environmental control elements and the corresponding environmental factors within a greenhouse. ...9 Figure 6. Examples of the setting screen for a greenhouse environmental controller: (a) the setting of influential parameters and (b) the setting screen for greenhouse ventilation control... 10 Figure 7. Development of a smart farm climate control system for greenhouses based on an AI prediction model. ... 12 Figure 8. The specific AI-based environmental control concept proposed in this study. ... 13 Figure 9. Step-by-step research outline for the present study in the development of second-generation smart farm technology. ... 14 Figure 10. Concept art for AI-based control logic proposed for the autonomous greenhouse challenge hosted by Wageningen University & Research. ... 18 Figure 11. Frame of management system for greenhouse: Data collection, preprocessing, design of prediction model using ANN (proposed by Kim et al., (2017)). ... 21 Figure 12. Two time-scale horizon optimal control system(TTRHOC) proposed by Xu et al., (2018) ... 23 Figure 13. Schematic of the fuzzy-based control system (Maher et al., 2016). ... 24 Figure 14. The difference between two modeling approaches. ... 25 Figure 15. He and Ma, (2010) reorted result on regression lines between measured and predicted humidity by BPNN based on PCA. ... 26 Figure 16. A diagram of a closed-loop soilless culture system and measured data of nutrient solutions and growth environment (reported by Moon et al., (2018)) .... 28 Figure 17. CNN-LSTM structure proposed by Kim and Cho(2019) ... 29 Figure 18 CNN–LSTM model architecture proposed by Livierise et al., (2020). ... 29 Figure 19. Nonlinear adaptive neural nettwork based control system architecture (proposed by Calise et al., (2001)). ... 31 Figure 20. Automatic irrigation controller and reported Embedded Linux board board (developed by Tarange et al., (2015)) ... 32 Figure 21. Overall appearance of the multi-span venlo-type greenhouse. ... 37
greenhouse. (c) Tomatoes growing inside the greenhouse. (d) Weather station to
measure outside climatic variables. ... 38
Figure 23. Monitoring sensors and environmental control actuators included in the greenhouse used for data acquisition. ... 39
Figure 24. Features of the Raspberry Pi 3.0 model B. ... 40
Figure 25. View of controller and relay board installed in the control room of the greenhouse. ... 41
Figure 26. Floor plan showing the structure of the greenhouse and the position of the controller and actuators ... 42
Figure 27. Environmental control program monitoring in greenhouse operating room. ... 44
Figure 28. Overview of monitoring sensor communication protocol ... 45
Figure 29. The overview of MQTT data publish/ subscribe system between the broker and clients ... 46
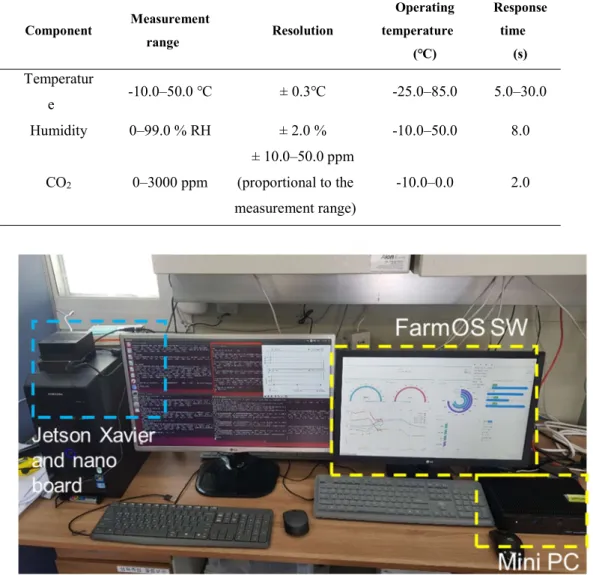
Figure 30. Climate control software (Welgrow) developed for smart farm control in this study: (A) monitoring screen and (B) setting screen. ... 48
Figure 31. creen view of FarmOS, which can be used as an open platform for greenhouse climate management. ... 49
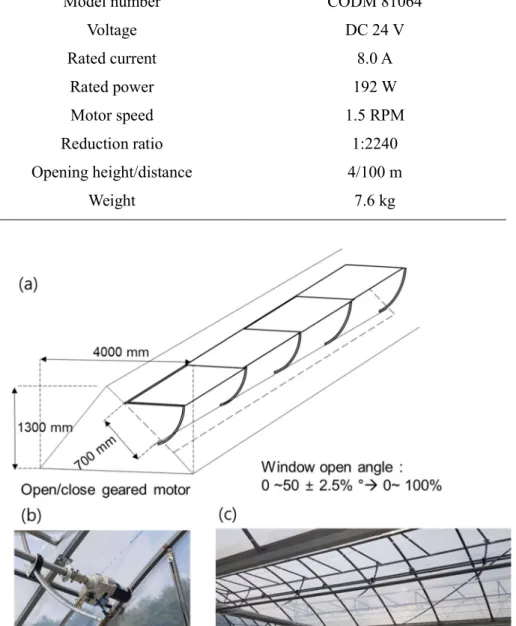
Figure 32 (a) Opening of the windows for ventilation control. (b) Installation of the rack geared motor to open the window. (c) Overall view of the windows. ... 50
Figure 33. The two types of greenhouse control actuator employed in the present study. ... 53
Figure 34.Carbon dioxide gas for spraying in the greenhouse and carbon dioxide inlet at the bottom of the growing bed. ... 54
Figure 35. The results for CO2 concentration control in the greenhouse. ... 55
Figure 36. Overview of the automatic fog system used in the greenhouse... 56
Figure 37. The result of the controlled humidity. ... 57
Figure 38. (A) Installation location and operating direction of the shading and heat retention curtains in the greenhouse and (B) their coverage area. ... 58
Figure 39. Heat retention curtains installed in the greenhouse. ... 59
Figure 41. Controlled temperature by using P-band controller (top), and the opening ratios of windows and curtains(bottom) . ... 63
Figure 42. Overview of the automatic heating system used in the greenhouse. ... 65
Figure 43. Response surface plots with two factors to RMSE of P4 ... 72
Figure 44. Temperature changes in the greenhouse managed using the optimal ventilation coefficients and the comparison with the target ventilation temperatures. ... 75
Figure 45. Changes in external environmental conditions in the experiment with optimal ventilation coefficients. ... 76
Figure 46. Structural comparisons of times series neural networks and traditional neural networks (Revised from Mitrea et al., 2009). ... 84
Figure 47. ANN basic Neuron for greenhouse climate prediction model. ... 84
Figure 48. Block diagram for training using Levenberg–Marquardt algorithm: wk is the current weight, wk+1 is the next weight, Ek+1 is the current total error, and Ek is the last total error. ... 88
Figure 49. Basic 3-layered RNN model ... 89
Figure 52. LSTM configured by adding a cell-state to the hidden state in RNN structure. ... 93 Figure 53. A LSTM unit with input (i.e. ), output (i.e. ), and forget (i.e. ) gates. Each of these gates can be thought as a "standard" neuron in a feed-forward (or multi-layer) neural network. ... 94 Figure 54. NARX structure for forecasting greenhouse climate value ... 95 Figure 55. Schematic diagram of three approaches for building the prediction models (a): comparison of various time step, (b): model performance comparison of two categories of input variables, (c): model performance comparison by the number of training data set ... 97 Figure 56. Comparison of SEP changes per time step for temperature prediction models
... 101 Figure 57. Comparison of SEP changes per time step for humidity prediction models ... 101 Figure 58. Comparison of SEP changes per time step for CO2 prediction models .... 102 Figure 59. ANN prediction results using a test set of cold (days 1–3), hot (days 4–6), and moderate (days 7–9) climates with various training datasets. ... 105 Figure 60. NARX prediction results using a test set of cold (days 1–3), hot (days 4–6), and moderate (days 7–9) climates with various training datasets. ... 106 Figure 61. RNN-LSTM prediction results using a test set of cold (days 1–3), hot (days 4–6), and moderate (days 7–9) climates with various training datasets. ... 107 Figure 62. Typical covolutional layer with sequence to classify handwritten digits. 109 Figure 63. Types of pooling. ... 111 Figure 64. Overall conceptual diagram of CNN-LSTM based environmental prediction model (a), 2 D CNN conv layer diagram (b), LSTM device (c). ... 113 Figure 65 The details of CNN-LSTM structure. ... 113 Figure 66. Comparison of the predictive models for the change in temperature after 30 minutes in the greenhouse. ... 114 Figure 67. Comparison of the predictive models for the change in CO2 after 30 minutes in the greenhouse. ... 115 Figure 68. Comparison of the predictive models for the change in relative humidity after 30 minutes in the greenhouse. ... 115 Figure 69. Comparison of the prediction models for the electrical conductivity (EC) of the hydroponic growing substrate. ... 116 Figure 70. Comparison of the prediction models for the volumetric water content (VWC)
of the hydroponic growing substrate. ... 117 Figure 71. Evapotranspiration monitoring dataset based on the weight sensor for the growing medium used to train the CNN-LSTM model. ... 118 Figure 72. Comparison of the predictive results for the proposed CNN-LSTM model and the actual evapotranspiration rate. ... 118 Figure 73. Evapotranspiration rate calculated using the Stenghilini evapotranspiration model (used in Model 2). ... 125 Figure 74. Dew point temperature, leaf surface temperature, and substrate weight (used in Model 3). ... 126 Figure 75. Training results for the three models (left: Model 1; middle: Model 2; right: Model 3). ... 126 Figure 76. Test set results for the three models in predicting the relative humidity in a
Figure 78 Unfolded LSTM layer. ... 131
Figure 79. Flow chart for the automatic model training system. ... 131
Figure 80. Temperature prediction curves of four deep learning models with actual values at 1-4 days. ... 132
Figure 81. Temperature prediction curves for the four deep-learning models compared with actual data from Days 5 to 9. ... 133
Figure 82. Relative humidity prediction curves for the four deep-learning models compared with actual data from Days 1 to 4. ... 133
Figure 83. Relative humidity prediction curves for the four deep-learning models compared with actual data for Days 5 to 9. ... 134
Figure 84. Comparison of the accuracy (R2) of the predicted temperature (top) and humidity (bottom) using the automatic model updating system. ... 136
Figure 85 Framework for determining the optimal signal in a deep-learning model. ... 142
Figure 85. Schematic of the neural-network-based temperature prediction model and optimizer... 143
Figure 86. Oscillating Gradient Descent ... 144
Figure 87. Simple linear regression equation with noise used for case study. ... 148
Figure 88. 3D graph with visualized cost function. ... 148
Figure 89. Loss change for each step and optimization coefficient change in SGD algorithm (a,b). ... 149
Figure 90. Loss change and optimization coefficient for each step in the Momentom algorithm (a,b) and change in the velocity coefficient value. ... 150
Figure 91. Loss change and optimization coefficient for each step in the adadelta algorithm (a,b). ... 151
Figure 92. Temperature profile for the optimization algorithm simulation. ... 153
Figure 93. Contour map of the change in cost according to the opening of the left and right windows in the simulation. ... 154
Figure 94. Contour map of the change in cost according to the ventilation rate and the trajectory of the change in the optimization point with SGD. ... 156
Figure 95. Contour map of the change in cost according to the ventilation rate and the trajectory of the change in the optimization point with SGD ... 157
Figure 96. Contour map of cost change according to ventilation rate and trajectory of optimization point change with RMSprops. ... 158
Figure 98. Contour map of cost change according to ventilation rate and trajectory of optimization point change with Adadelta. ... 159
Figure 99. Conceptual diagram of output feedback neural network-based greenhouse environmental control ... 161
Figure 100. Structure of the neural network model for prediction of inside temperature. ... 163
Figure 101. Structure of the output feedback neural network (OFNN) and operational direction. ... 164
Figure 102. Flowchart for optimal control values using the gradient descent method. ... 165
Figure 103. Strawberry greenhouse used in this study: (a) exterior and (b) inside with multi-window shell structure, and (c) schematic of experimental greenhouse monitoring and control system. ... 167
Figure 105. Comparative greenhouse and control node diagram for field application experiment. ... 171 Figure 106. Comparisons between predicted and measured temperature ... 172 Figure 107. Comparisons between difference between current temperature and predicted or measured temperature after 30 min. ... 172 Figure 108. Performance of temperature prediction in 30 minutes. ... 173 Figure 109 Three cases of predicted temperature change and window open ratio change plot as a result of the operation state of OFNN and ANN during 60 epochs; (c) expected temperature changes in case-2, (d) changes in window open ratio determined by OFNN ... 175 Figure 110. Comparison of temperature control performance between the proposed method and the conventional controller on 11 May. network-based controller. 176 Figure 111. Comparison of opening ratios of windows between the commercial controller and the output feedback neural network-based controller under the same condition. ... 177 Figure 112. Field test results for the proposed method from 18 May to 24 May. ... 178 Figure 113. Changes in outside environmental conditions in the experiment: outside temperature (a), solar radiation(b), and wind velocity (c). ... 178 Figure 114. Cost gate design for control signal determination in climate in greenhouse.
... 183 Figure 115. Cost map with energy consumption rate for determining control signals for fogging and ventilation. ... 186 Figure 116. Cost map with energy consumption rate for determining control signals for CO2 injection and ventilation. ... 187 Figure 117. Temperature change (top), window and curtain signals (middle), on/off actuators’ signals (bottom) operated by the P-band logic-based environment control system ... 189 Figure 118. Relative humidity, carbon dioxide change and fogging on/off signal CO2
injector signal graph operated by the P-band logic-based environment control system ... 190 Figure 119. Temperature change (top), window and curtain signals (middle), on/off actuators signals (bottom) operated by the AI logic-based environment control system ... 191 Figure 120. Relative humidity, carbon dioxide change and fogging on/off signal CO2
injector signal graph operated by the AI logic-based environment control system ... 192 Figure 121. Comparison graph of energy consumption while operated by the linear algorithm (P-band) and artificial intelligence (AI) logic. ... 193 Figure 122. Comparison chart of operating time for actuator during 3 days (winter season) ... 196 Figure 123. Comparison chart of operating costs for actuator during 3 days (winter season) ... 196 Figure 124.Comparison of simulated control performance with artificial intelligence and actual controlled (P-band) temperature, humidity, and CO2 in winter climate ... 197 Figure 125. Control history of actual controlled (P-band) actuators for climate control inside greenhouses in winter climate. ... 198
Figure 127. Comparison chart of operating time for actuator during 3 days (spring season) ... 202 Figure 128. Comparison chart of operating costs for actuator during 3 days (spring season) ... 202 Figure 129.Comparison of simulated control performance with artificial intelligence and actual controlled (P-band) temperature, humidity, and CO2 in spring climate. ... 202 Figure 130. Control history of actual controlled (P-band) actuators for climate control inside greenhouses in spring climate. ... 203 Figure 131. Control history of simulated (AI logic) actuators for climate control inside greenhouses in spring climate. ... 204 Figure 132. Comparison chart of operating time for actuator during 3 days (summer season) ... 205 Figure 133. Comparison chart of operating costs for actuator during 3 days (summer season). ... 206 Figure 134.Comparison of simulated control performance with AI logic and actual controlled (P-band) temperature, humidity, and CO2 in summer climate... 207 Figure 135. Control history of actual controlled (P-band) actuators for climate control inside greenhouses in spring climate. ... 208 Figure 136. Control history of simulated (AI logic) actuators for climate control inside greenhouses in summer climate. ... 209 Figure 137. Tomato greenhouse used in the verification experiment ... 211 Figure 138 Test results of AI Logic and commercial controller for temperature control.
... 213 Figure 139. Test results of AI Logic and commercial controller for humidity control. ... 214 Figure 140 Test results of AI Logic and commercial controller for CO2 control ... 215 Figure 141. AI Logic and commercial controller window and curtain control history ... 216 Figure 142. Fogging, CO2 injection, and fan control history of commercial controller ... 217 Figure 143. Fogging, CO2 injection, and fan control history of AI controller ... 218 Figure 144. Basic components of supervised reinforcement learning ... 240 Figure 145. Network architecture of the RL agent consists of multi-independent deep neural networks. ... 242 Figure 146. Concept of RL control of irrigation for greenhouse rootzone environmental control. ... 242 Figure 147. Control nodes based on RL and generator neural network control ... 243 Figure 148. Example of a reward scoreline for ET input rate during a day. ... 244 Figure 149. Example of a reward scoreline for the evapotranspiration rate of crop. ... Error! Bookmark not defined. Figure 150. Example of a reward scoreline for energy input rate during a day. ... 245 Figure 151. Reward simulation obtained through reinforced learning-based environmental control. ... 246
L
IST OF TABLES
Table 1. Government strategic classification of Korean 3rd Generation Smart Farms 15 Table 2. Comparison of smart farm control technique between South Korea and an
overseas country ... 19
Table 3 Comparison of specific control element between South Korea and an overseas country ... 19
Table 4. The specification of Raspberry Pi 3.0 model B ... 40
Table 5. Sensor specifications for inside climate of the greenhouse ... 44
Table 6. Control operations for the environment control program used in this study . 47 Table 7. The specifications of gear motor installed for opening and closing windows in greenhouse. ... 50
Table 10. The influence coefficients per time slot for CO2 control. ... 55
Table 8 The specifications of fogging actuators installed in greenhouse. ... 56
Table 9 The specifications of gear motor installed for opening and closing curtains in greenhouse. ... 59
Table 10. The influence coefficients per time slot for Heat retention curtain control. 61 Table 11. The influence coefficients per time slot for shade curtain control. ... 62
Table 12. The influence coefficients per time slot for heating control. ... 66
Table 13 The specifications of boiler installed for heating water. ... 66
Table 14 Experimental design using central composite model of 32 trials ... 67
Table 15 Time slots for the greenhouse climate control operation and the target temperature through ventilation for each time slot ... 68
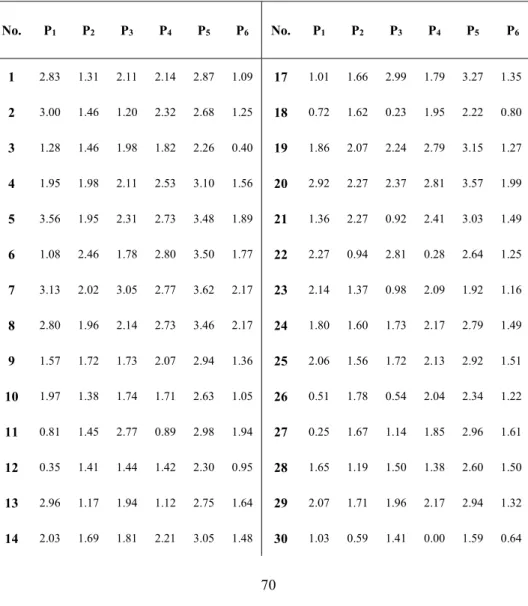
Table 16. P1~P6 coefficients of the regression model of second order obtained through the response surface analysis method ... 70
Table 17 Optimal influence coefficients per time slot obtained through the surface response analysis method for optimizing ventilation control ... 74
Table 18. Ranges of input data used for building a prediction models ... 95
Table 19 Comparison of ANN prediction accuracy at time steps of 5, 10, 15, 20, 25, and 30 min for greenhouse temperature (°C), humidity (%), and CO2 (ppm) change ... 98
Table 20 Comparison of NARX prediction accuracy at time steps of 5, 10, 15, 20, 25, and 30 min for greenhouse temperature (°C), humidity (%), and CO2 (ppm) change ... 99
Table 21 Comparison of RNN-LSTM prediction accuracy at time steps of 5, 10, 15, 20, 25, and 30 min for greenhouse temperature (°C), humidity (%), and CO2 (ppm) change ... 99
Table 22 Comparison of accuracy changes for each training set when external weather conditions or actuator control history, was used. Values in parentheses are the difference from results when using all datasets. ... 103
Table 23.Performance comparison of predictive models of climate change after 30 minutes in greenhouse ... 116
Table 24 Performance comparison of predictive models of substrate status change after 30 minutes in greenhouse ... 116
Table 25. Ranges of input data used for building a prediction model of temperature. ... 120 Table 26. Time comparison result of training CNN-LSTM and RNN-LSTM
Table 27. Predicted values of temperature model by opening position of windows (corresponding cost) ... 155 Table 28. Functions used in the artificial neural network hidden nodes. ... 162 Table 29. Sensor specifications for inside climate of the greenhouse ... 168 Table 30 Three case environmental conditions to confirm the simulation of the
optimization algorithm. ... 170 Table 31. Energy consumption table for actuators in the experiment (Agricultural
electricity rates : 49.09 KRW/kWh, CO2 price 300 KRW/kg, Kerosene: 1,000 KRW/L, Water: 360 KRW /1ton) ... 185
A
BSTRACT
Greenhouses are widely used to create an artificial environment that is favorable for the growth of plants. Maintaining a suitable temperature, humidity, and carbon dioxide concentration is essential for environmental control within a greenhouse because these factors affect plant development, quality, and production levels. Plants exposed to unusually low or high temperatures or humidity may experience stress, disease, and/or death, causing significant financial losses for growers. Greenhouse climate control must consider a complex and nonlinear system in which variables are highly dependent on external climatic conditions and greenhouse design. Therefore, establishing a method for the precise control of the internal greenhouse climate is vital for responding to these dynamic changes and achieving efficient climate management. Therefore, the objective of this study was to develop an improved artificial intelligence-based climate control system using big data from a smart farm.
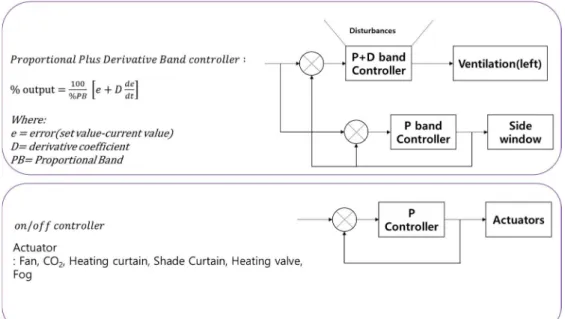
In this study, a model employing PD-band- and P-band-based linear algorithms was proposed for the control of greenhouse actuators in the management of temperature, humidity, and CO2 concentrations, and the
performance of this model was verified. To optimize the settings for the PD-band model, response surface analysis and experimental analysis were conducted. Based on the results, the conditions required for optimal ventilation control were established, and the optimal values for each factor were applied to a real greenhouse temperature control system; the resulting root mean square error of 1.25 ℃ confirmed that the optimized coefficients improved climate management performance.
The deep-learning-based prediction model developed in this study was designed to respond to changes in the climatic conditions of the greenhouse due to operational changes. Artificial neural network, neural network
architecture (RNN-LSTM) models were developed to determine the best approach to predicting changes in temperature, humidity, and CO2,
concentration. The RNN-LSTM exhibited the highest overall accuracy for temperature and CO2 prediction (5% standard error of prediction and 0.81–0.96
R2, respectively). Various training conditions were also analyzed, and the 5–30
min prediction performance was evaluated. Using a convolutional neural network (CNN) with LSTM, it was possible to predict environmental changes within actual greenhouses, and it exhibited a slightly stronger performance than did the RNN-LSTM. These results clearly demonstrate the potential for the use of deep-learning-based prediction models in greenhouse control.
A method of determining the optimal actuator signal using backtracking was also introduced to the structure of an output feedback neural network (OFNN). This was employed in calculating the costs derived from the target climate settings, the current climate values, and the predicted change in the climate values after 30 min, and an optimization method to reduce these costs was devised. Gradient descent, which is commonly employed in machine learning and deep learning research, was employed in the form of an OFNN. Using a multiwindow ventilation control experiment in the field, it was verified that the actuator signal was more sensitive to environmental changes than the existing linear algorithm. For energy conservation, the driving energy for the actuators was used as a function in the cost gate to consider the energy consumption when determining the control signal. The actual energy savings were subsequently confirmed in a field application.
The developed artificial intelligence-based climate control system was designed to minimize the input energy and errors associated with the set values for more efficient control decisions. This reduces the input energy and thus has positive economic implications that should encourage its adoption in smart farms in the near future. In addition, the increasing need for intelligent environmental control technology in other industries suggests that the system
general.
Keywords: Smart farm, Climate control, Climate predictive model, Intelligence control, Model predictive control,
1 I
NTRODUCTION
1.1
S
TUDYB
ACKGROUNDSouth Korea's agricultural industry continued to grow until the early 2000s. However, in recent years, the average farm income has stagnated, the self-sufficiency rate for grain has decreased, the size of the rural population has shrunk and aged, and climate change has made it more difficult to attain target crop yields, which has resulted in a lower growth rate for agriculture (Yoo et al., 2016). As the crop yield and production has become more erratic, and the price of agricultural products has fluctuated dramatically, and food security for the nation has become a concern. Total agricultural production drastically increased from KRW 32 trillion in 2001 to KRW 44 trillion in 2012 before leveling off until 2016. Despite this increase in overall production, the average yearly income per farm has remained relatively unchanged at around KRW 11.30 million between 2001 and 2015, while the size of the rural population significantly decreased from 4.0 million in 2000 to 2.6 million in 2015. In order to overcome these challenges, the South Korean government has implemented a new industrialization policy that promotes agriculture in connection with the primary, secondary, and tertiary industries (Shin et al., 2015).
Based on this new industrialization policy, the number of entrepreneurs launching startups increased from 752 in 2014 to 1,530 in 2016. In addition, governmentally operated industrialization service centers support the production and marketing of agricultural products in collaboration with related organizations, including agricultural product processing centers. As a result, tangible results in terms of an increase in sales have been attained. However, to more meaningfully advance Korean agriculture, it is necessary to actively embrace scientific technology, especially techniques associated with the 4th Industrial Revolution (e.g., the Internet of Things [IoT], big data, drones, robots, and artificial intelligence [AI]), for use in production, distribution, consumption, and upstream and downstream sectors. Indeed, smart agriculture systems have emerged in several developed countries, such as the U.S., the U.K., and Germany, based on advanced information technology and full agricultural mechanization. In terms of revenue, the North American region
dominated the market in 2016 and is expected to remain dominant in the near future.
Prospects for Smart Farming Technology
Smart farming involves the use of autonomous agricultural machines, intelligent robots, and autonomous farm control applications based on IoT, big data, and AI. Smart farms can solve current problems within the agricultural industry, such as labor shortages, decreasing productivity, and the stagnation of farm income. The global smart agriculture market was valued at USD 5.79 billion in 2016 and is expected to reach USD 18.22 billion by 2025, growing at a compound annual growth rate (CAGR) of 13.5% over the forecasted period (Figure 1). Despite this, South Korea's agricultural industry still operates according to the standards of the 3rd Industrial Revolution, where data are collected in field surveys, from statistics, or in a specific way, the information derived from modeling using the collected data is provided to farms, and then each farm manually adjusts its operations based on the information. Smart farming technology cannot be truly implemented until the technologies associated with the 4th Industrial Revolution are employed in downstream industries as well as in agricultural production, distribution, and consumption.
In addition, automatic management systems need to be more fully embraced. For example, when structured data obtained from IoT devices and unstructured data collected from SNS are analyzed using deep learning, AI, and semantic web technologies, the analysis results can be uploaded to a cloud system and used for autonomous agricultural machines, robots, and drones. The Netherlands, one of the most advanced countries in terms of smart farming, focuses on software development, including big data analysis, on the grounds that there is no significant difference in hardware technology such as greenhouse construction and sensors in less advanced countries (Lee et al., 2016).
Precision agriculture or satellite farming is a farming management concept based on measuring, observing, and responding to intra- and inter-field variability in crops (Ding et al., 2018; Roy et al., 2002). The goal is to provide a decision support system for farm management while preserving resources and optimizing the return on inputs. In precision agriculture, farmers collect real-time data on soil, weather, air quality,
crop maturity, and labor costs, which helps them to make informed decisions. In order to implement such systems in Korea and enhance the production of food, the agricultural industry requires a technology infusion. In particular, smart agriculture includes software and hardware components, with equipment requiring application software to be embedded and hardware requiring a connection to network services.
Figure 1. Smart agriculture market size and growth prospects (revenue in million USD) 2014–2025 (Sources: Agfunder, EPA, World Bank Reports, Drone Blog, ICT Update, company annual reports, primary interviews, and Grand View Research)
Artificial Intelligence (AI) in Agriculture
AI involves the development of computer systems that are capable of performing tasks that usually require human intelligence. Applications of AI in the agricultural industry include precision farming, livestock monitoring, drone analytics, agricultural robots, labor management, smart greenhouse management, soil management, and fish farming management. The increasing strain on the global food supply due to the growing population and government support for the adoption of modern agricultural techniques have been the key growth drivers for AI in agriculture. As such, the adoption of AI in agriculture adds significant value to a farm as a whole as well as to the consumer supply chain (Lee et al., 2016; Muangprathub et al., 2019). In fact, the overall use of AI in agriculture was valued at USD 835 million in 2019 and is expected to reach USD 4.0 billion by 2026, at a CAGR of 25.5% between 2020 and 2026.
AI in agriculture provides intelligent farming solutions for farmers that allow them to grow crops more efficiently through the analysis of real-time data for weather conditions, temperature, soil moisture, weed detection, crop health monitoring, and crop prices (Wolfert et al., 2017). Machine learning, computer vision, and predictive analytics technologies have thus been increasingly adopted in the agricultural industry, mainly for forecasting crop yields (Figure 2). Other major factors that have contributed to the growth of AI in the agricultural market are the rising use of robots and drones on farms, increasing demand for enhanced crop yields, and the growing adoption of AI technologies such as machine learning, computer vision, and predictive analytics by farmers and agribusinesses (King, 2017).
Figure 2. Global artificial intelligence (AI) market in agriculture, 2017–2026 (million USD) (top) and growth of AI in the agricultural market between 2020 and 2026 (bottom). (Sources: Annual reports, press releases, investor presentations, expert interviews, Association for the Advancement of Artificial Intelligence, Artificial Intelligence Association of India, Chinese Association for Artificial
Intelligence, Pattern Recognition and Machine Intelligence Association, and market analysis).
Machine-learning-enabled solutions are being increasingly adopted by agricultural organizations and farmers worldwide to enhance farm productivity and to gain a competitive edge in business operations (Park et al., 2016). In the coming years, the use of machine learning in various agricultural activities is expected to rise further. Technological advancements and the proliferation of machine-learning technology for farm data generation are some of the major driving factors for the use of AI in the agricultural market. The increasing use of deep learning algorithms in a variety of applications in agriculture is also a major driving force for the increasing demand for AI in agriculture (Kamilaris and Prenafeta-Boldú, 2018). Deep learning is a machine-learning technology based on multiple algorithms that explore relationships among data points. Deep learning typically uses artificial neural networks (ANNs) to learn patterns within multiple levels of unstructured data, including text, images, and sound.
Predictive analytics uses various techniques based on algorithms to analyze currently available data and predict crop yields, crop nutrient deficiencies, and plant health. Predictive analytics technology uses data from satellites and drones to virtually scout the area of a farm and to detect and classify specific anomalies. Farmers can then use this information to manage crop inputs and make agronomic decisions in order to improve overall productivity and crop efficiency (Morota et al., 2018; Wolfert et al., 2017).
The Future of Greenhouse Control system
Unlike outdoor cultivation, greenhouse-based cultivation has the advantage of allowing the specific control of the growing conditions. As a result, productivity and product quality can be improved by analyzing the growing conditions, including climate and crop cultivation parameters. For this reason, the number of greenhouses in a certain area tends to increase when precision control and air conditioning techniques are made available. The early form of cultivation under a structure was limited to the supply of water. However, technological development now allows the automation of the entire crop cultivation process.
The primary issues in greenhouse horticulture are increasing productivity, reducing costs, and increasing crop quality. Productivity can be improved using hybrid environmental control and management, spatial cultivation techniques, growth diagnosis and forecasting techniques, and remote expert services. Hybrid environmental control includes temperature and humidity control and carbon dioxide (CO2) fertilization. Productivity can be greatly improved if relevant data are
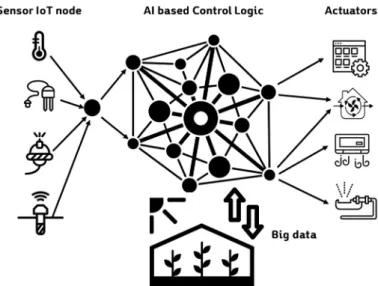
collected by IoT devices and analyzed using AI so that the environment can be automatically controlled. As such, a number of smart farms have installed a sensing system to monitor the growth of crops and an ICT system that transfers the information about crop growth and the internal climate and external weather collected from various sensors to a central server (Figure 3). As traditional agriculture focusing on the simple production of in-season crops is replaced by smart farming technology focusing on sophisticated control, crops can be produced irrespective of the season. Accordingly, more farms can adopt smart farming technology to increase their income, competitiveness, efficiency, and crop quality.
Figure 3. Overview of ICT-based smart farm
1.2. P
ROBLEM STATEMENTA greenhouse artificially manipulates the environment so that it is suitable for the target crop. Of the indoor environmental conditions that need to be monitored, maintaining an optimal climate is of great importance because it has a significant
effect on the development, quality, and quantity of plants produced (Qian et al., 2015; Takahata and Miura, 2017). Over time, greenhouses have developed from very simple structures with crude control options to modern industrial structures that offer various ways to manipulate the environmental conditions. However, the automatic control of the greenhouse climate still requires further development. A greenhouse is a highly nonlinear and strongly coupled system that is heavily influenced by the external weather and the behavior of the actuators installed in the system (Zeng et al., 2012). In recent years, many studies have investigated greenhouse environmental control (Coelho et al., 2005; Fitz-Rodríguez et al., 2010; Piñón et al., 2005), but the systems proposed in these studies have not entered the commercialization stage. At present, the performance of commercially available controllers for greenhouses is very limited. For example, there are numerous problems with precise temperature control, as shown in Figure 4. It is common for the air to become overheated because of the delay in releasing heat from the greenhouse, while frequent operation causes fluctuations in the temperature. In order to improve environmental control, experience-based linear algorithms can be used, but they often make the system less convenient to use. This section will summarize some of the key issues that need to be resolved in greenhouse environment management.
Figure 4. Example of temperature changes in a typical greenhouse using a commercial controller.
Nonlinear and coupled operation of environmental controllers
A greenhouse is a very complex nonlinear system that requires a meticulous approach to controlling the environment. Figure 5 presents the relationship between the physiological and growth phenomena observable in a greenhouse and the system elements that can be controlled. For example, ventilation is associated with both the external and internal environment of the greenhouse, affecting the temperature, relative humidity, and CO2 concentration within the greenhouse, which in turn
affects the atmospheric pressure and ultimately evapotranspiration, sap flow, and crop respiration. In addition, the amount of light inside a greenhouse can be adjusted by installing artificial lights and/or shading curtains. Light intensity is a very important environmental factor because it directly affects thermal radiation and photosynthesis within the greenhouse. CO2 enrichment also has a very complex
impact on crop physiology, being used as the main raw material for the photosynthesis and anabolism of crops. Typically, CO2 from the external
environment is used, but CO2 levels can be controlled by injecting more during the
day when photosynthesis is highly active. However, CO2 concentration is very
difficult to model because it is related to crop respiration. Nutrition and irrigation are control elements that affect the root zone of crops, which is involved in evapotranspiration and CO2/O2 exchange and affects nutrient uptake and crop growth.
In addition, fogging and heating systems control the temperature and humidity inside the greenhouse.
Currently, commercialized controllers operate using set values for each influential factor based on a certain linear band as selected by the user. The difference in the performance of different environmental controllers depends on how precisely the empirical equation based on these coefficients can be calculated. This set-up has led farmers to prefer foreign-manufactured controllers in a domestic environment where commercial environmental controller technology and products are relatively insufficient.
Figure 5. The relationship between various environmental control elements and the corresponding environmental factors within a greenhouse.
Complexity of environmental controller setting factors
The performance of an environment controller depends on the set values, which are often complex and sophisticated. Figure 6 displays the complex configuration screen for a commercial product. It is necessary to present each reference value when inputting the coefficients into the settings for the greenhouse, and it is necessary to tune it according to the structure of the greenhouse and the growth of the target crop. However, in most cases, this function is not used effectively on Korean smart farms. Countries with advanced agricultural industries, particularly those in Europe, employ their own systems to produce various crops, thus increasing the quality and productivity and reducing costs. On the other hand, South Korean farms depend on imported equipment and lack appropriate cultivation and environmental management techniques. As a result, the crop production per unit area in South Korea is only half that of the Netherlands, which is a leading country for smart farms in Europe. Due to the costs involved, the majority of farms consider affordability rather than performance when purchasing smart farm equipment. However, because the core components of these systems are imported, when a failure occurs, immediate servicing is often impossible, thus damaging the farm’s operations. Thus, the development of high-performance controllers that utilize domestic components is
urgently required, as is the establishment of Korean smart farm techniques that are suitable for the local agricultural environment.
Currently, domestic technology in this area is limited to IoT-based data collection and analysis, while temperature/humidity and heating/cooling systems continue to be manually operated. Thus, the majority of advanced domestic smart farms use imported multivariable environmental control systems that directly influence crop yield and quality. However, these imported control systems consider neither the weather conditions nor the growing conditions for crops in South Korea. For this reason, farmers have difficulty setting the controls (Figure 6). Although farmers need to be trained in the use of the control software, their control efficiency has not improved as much as expected because of the lack of knowledge from the farmer. Because linear control models have some limitations in terms of environmental control, precise control technology that utilizes environmental big data from farms is required.
Figure 6. Examples of the setting screen for a greenhouse environmental controller: (a) the setting of influential parameters and (b) the setting screen for greenhouse ventilation control.
Uncertainty and lack of standardization in the use of AI
With the emergence of the 4th Industrial Revolution, various industries have harnessed AI to promote innovative productivity and increase efficiency. Smart farms are a noticeable example of this trend. In South Korea, many studies have actively sought to combine smart farm and AI technologies. In fact, deep-learning-based image analysis technology has been so actively developed that it has spilled over from agriculture into other industrial areas. In terms of automatic environmental
control systems for smart greenhouses, various attempts have been made to apply AI-based algorithms, but significant success has yet to be achieved.
Excessive energy use for environmental control
The high energy costs associated with the use of the actuators required for the ventilation, heating, humidification, and cooling systems within a smart greenhouse increase the overall cost of production for a farm (Maher et al., 2016). It is thus necessary to maintain an environment that optimizes crop growth while still considering the economic efficiency of the farm.
1.3. O
BJECTIVES ANDA
IMS1.3.1.
O
VERALLO
BJECTIVEThis study aims to develop an AI-based climate control system that harnesses big data from a smart farm. This system will include various algorithms for the automatic control of the greenhouse climate. The results of this study are expected to facilitate the production of high-quality agricultural goods by minimizing labor costs and providing an optimal environment for the growth of crops in smart greenhouses.
1.3.2.
S
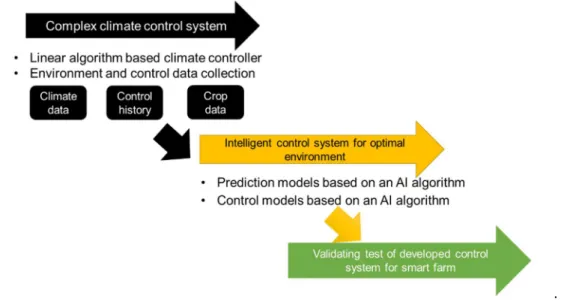
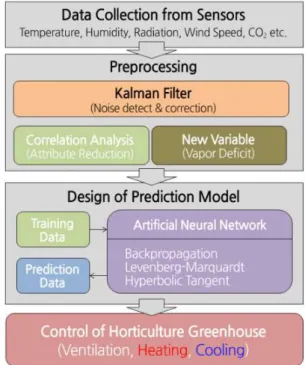
PECIFIC OBJECTIVESThe specific AI-based environmental control concept proposed in this study is shown in Figure 7 and Figure 8. In the first step, a set-point controller configuration based on a conventional linear algorithm is installed and tested. The second step is carried out based on the big data obtained from the linear controller, with various AI-based prediction models for environmental changes and control methods developed and tests. Finally, in the third step, an intelligent controller and a model that optimizes the control signals are proposed. These steps all focus on the control of rhizosphere nutrients and the environmental temperature and humidity. The overall goal is to develop a model that controls both factors using a sophisticated environmental controller.
that employs various AI algorithms. The specific objectives are to
Establish linear-based control logic for use in the actuators that maintain the climatic conditions of a greenhouse
Develop machine-learning- and deep-learning-based algorithms for climate prediction modeling of various IoT/ICT-based environmental monitoring systems
Create an AI optimization algorithm that sets the control signals based on the developed predictive model, and
Assess the AI optimization algorithm based on the energy efficiency of the actuators during operation.
Figure 7. Development of a smart farm climate control system for greenhouses based on an AI prediction model.
Figure 8. The specific AI-based environmental control concept proposed in this study.
Chapter 3 presents the development of the improved linear algorithms and explains the construction of a smart greenhouse, while Chapter 4 describes the construction of a climate prediction model using AI and proposes a prediction algorithm. Chapter 5 establishes a control optimization method that moderates the climatic conditions of a greenhouse based on the developed predictive model. Chapter 6 creates a modified algorithm that makes optimal control decisions and considers the energy efficiency of the actuators. The technologies discussed in Chapters 3–6 are then combined and the expected results for on-site scenarios are investigated. The expected contributions of this study are as shown in Figure.9.
.
Figure 9. Step-by-step research outline for the present study in the development of second-generation smart farm technology.
2. L
ITERATURER
EVIEW2.1. O
VERVIEW OF RESEARCH TRENDSmart farms have recently emerged as the future of agriculture and have started to receive active governmental support. In particular, technical development has been concentrated in the smart farm system. For example, smart farm technologies have been introduced to hobby- and leisure-based urban agriculture to create added value, meaning that ordinary citizens have become more interested in smart farms. There is a diverse range of smart farms depending on the farm size and design, crop, and cultivation method. Because various techniques need to be developed for different farm types, a variety of studies in many areas have been carried out (Yeo et al., 2016).
Table 1 presents the policy roadmap for smart farms established by the South Korean government. Government-initiated smart farms are now in a transition from second-generation to third-generation smart farms (Cha et al., 2016). AI technology is regarded as a key element in this phase. In second-generation smart farms, big data research has focused on platform development with governmental support. This groundwork intended to integrate data from various sensors and to standardize protocols. However, analysis engines that can optimally control the environment and enhance productivity have yet to be developed to an acceptable standard.
Table 1. Government strategic classification of Korean smart farms (Cha et al., 2016). 1st generation smart farm 2 nd generation smart farm 3 rd generation smart farm Data
collection Climate data
Climate and crop data
Climate and crop data Distribution and market
data Data
analysis
Experience-based
knowledge AI algorithm AI algorithm
Decision making Decision making Crop growth management Control
system Installed farm unit Control Cloud control Strategic crop harvest control by region
Currently, South Korean smart farms are restricted to importing main components (sensors, controllers, etc.) in order to install a control system. These farms face a large financial burden when purchasing, operating, and maintaining these systems. Moreover, because many system components lack compatibility, maintenance is very difficult and even minor failures often cannot be fixed. This lack of customer service forces some farms to abandon the use of these systems. In addition, the import-dependent structure of the South Korean smart farm market continues to release cultivation data from farms to the other conturies, where many system manufacturers and installers are located. Accordingly, these companies utilize the data for systems on domestic farms used to cultivate crops in greenhouses.
The technical development of environmental control systems in South Korea has not yet reached a stage where a farmer can understand how to apply the data (e.g., outdoor atmospheric temperature, wind speed, humidity, rainfall, etc.) collected by the minute by multivariable environmental control sensors in greenhouses to agricultural fields (Jeong et al., 2019). In addition, many farmers are not aware of the importance of growth data, which has to be manually recorded. Accordingly, it is difficult to recognize how the growth of crops is affected by the environmental control system in a smart farm facility. Finally, because multivariable climate control systems have unsatisfactory operability, precise control is difficult, and the efficiency and economic outcomes for the farm tend to be dependent on the grower’s individual ability.
AI and big data technologies for agricultural use have been most actively developed in the US. Since 2014, an open-data policy has promoted the development of agricultural services. Recently, robotics has started to be applied to agriculture in conjunction with IoT. For example, Google utilizes AI and big data technologies in a system that monitors the moisture and growth of crops and assists in decision-making regarding the application of fertilizer and pesticide. In this system,
ICT-based sensors are installed in agricultural machines and fields to collect as much data as possible, the data are analyzed using big data methods, and optimal farming methods are proposed for each region. This system enables farmers to monitor soil conditions and weather forecasts and to control the growth of their crops.
In the Netherlands, 99% of greenhouses are glasshouses that are equipped with complex, precision environmental control systems, thus it is the leading country for smart farm technology. As a global leader in agricultural technology, it has already established the most efficient technology for crop production, developing various sensors and control solutions using the data that have been accumulated for decades and local know-how regarding the optimization of growing conditions. Based on agricultural ICT technology, production and quality have thus been optimized. Priva, a Dutch company, produces and exports the world’s best control system for greenhouses.
The Netherlands is actively pursuing improvements in AI greenhouse control with Wageningen University & Research (WUR) as a leader in technology in agriculture (Hemming et al., 2019). The goal of a recent challenge along these lines was to remotely produce a cucumber crop within four months inside a greenhouse. The experimental greenhouse space and controls are provided by WUR, and the challenger teams were allowed to set up their own sensors and cameras. Each team extracted necessary data from the greenhouse and established their own ICT, model, and machine-learning algorithms (Figure 10) in order to decide on the control settings for the next day or period.
Figure 10. Concept art for AI-based control logic proposed for the autonomous greenhouse challenge hosted by Wageningen University & Research.
The world’s leading countries in agriculture are actively introducing and utilizing smart farms in order to effectively solve labor shortages and other socio-structural problems faced by conventional agriculture. South Korea has also established active measures to develop and realize smart farms using ICT and AI technology. However, there is a gap in technology between South Korea and the leading countries, including the US and the Netherlands. Although Japan has undergone similar socio-structural changes to South Korea in some respects, it also belongs to the leading group. In Japan, many companies provide various ICT-based services, including tracking the management of crops, monitoring the growing environment, and hosting cloud-based agricultural management systems. For example, Fujitsu offers a system that measures the air temperature, soil temperature, moisture, solar radiation, and fertilizer levels in the soil using IoT sensors, transfers measurements to a cloud server at specified intervals and proposes optimal quantities of water and fertilizer for each farm based on data analysis and prediction. The farms using this system have experienced a small increase in yield. Because the production and yield can be predicted, the data collected by this system are also used to establish a procurement plan for agricultural products. A system for predicting vegetable yields is a representative system that is applicable to crops cultivated in open fields.
commercial environmental control systems that have been developed for smart farms to date in South Korea. Currently, environmental control systems based on the monitoring of crop growth have been developed as a domestic technology but have not been fully commercialized. On the other hand, other countries have already developed techniques for the active control of environmental conditions using crop growth monitoring systems. This technical gap is because growth and environmental data have been analyzed in depth for decades in leading countries, and these data have been successfully transferred to control systems using empirical formula-based modeling. AI technology is thus required for domestic Korean control systems in order to close the technical gap. This would enable the optimal use of the data collected from domestic crops, farms, and the environment.
Table 2. Comparison of smart farm control technology offered by a Korean company and an international company.
Functions of the climate
controller Korean company International company
Environmental monitoring Remote control
Crop monitoring X
Type of control algorithm P-band-based linear control algorithm
Nonlinear algorithm based on an environmental index (developed by Priva), development and application of a model based on an empirical formula Precision of growth
environmental control Intermediate Advanced
AI application X X
Energy efficiency X Partly
Table 3. Comparison of specific control functions between a domestic conpany and an international company.
Details Korean Company International Company Control logic Temperature change management ○ ○ Six-phase control ○ ○
Windows step control ○ ○
Curtain gap control Ⅹ ○
Temperature control for heat retention curtain with
artificial light
X ○
Curtain functional step X ○
Begin morning nautical twilight (BMNT) and end
evening nautical twilight (EMNT) setting
○ ○
Delay setting ○ ○
Accumulated radiation
consideration ○ ○
User settings for
customization X X
The present study also conducted a literature review on the progress that has been made on control systems for greenhouses. The greenhouse environment can be divided into the atmospheric and the root zone environment. Based on this classification, relevant studies were reviewed, and the development trends for the prediction models and control systems were analyzed. The ultimate goal of the literature review was to consider the specific role of AI algorithms.
2.2. C
ONTROL MODELS FOR INSIDE CLIMATE IN GREENHOUSE Kim et al., (2017) compares data-based models and physical energy equation-based models for greenhouse control systems. The authors also performed an experiment through P-Band control for field application. The data-based modeling turned out to be a possible alternative to the existing modeling method (Figure 11). However, since P-Band based control was necessary for real control operation, parameters had to be optimized, which seemed to be problematic. This problem could be solved by determining optimal Band coefficients in an iterative experiment.Figure 11. Frame of management system for greenhouse: Data collection, preprocessing, design of prediction model using ANN (proposed by Kim et al., (2017)).
Van Straten et al., (2000) argued that the environmental control of greenhouse requires an economic optimization strategy. The author also pointed out that the current P-band control had some limitations. According to them, it is necessary to develop models that can predict various environmental changes and be applied to various matters like crop modeling, photosynthesis and evapotranspiration. The development of a control and operation system, which could actively apply such
models, turned out to be important.
Coelho et al., (2005) introduced an optimal temperature control method for greenhouse under the concept of model-based prediction and control algorithm. The authors designed a prediction model by identifying outputs of a controller via the time series autoregressive method and proposed a method of determining control signals through a particle swarm optimization algorithm. They finally confirmed the better optimization performance of the particle swarm algorithm in comparison with genetic algorithms.
Kim (2018) considered agriculture in South Korea as an industrial sector where new values can be created by innovative AI technology based on machine learning like deep learning, IoT and big data. Accordng to Kim, as South Korea has entered into developing the second generation smart farm technolgoy, those who are not much experienced in agriculture will benefit from IoT, big data and AI technology, which would support decision making and automate environmental control. These technologies will advance South Korea’s agriculture one step further.
Gouadria et al., (2017) developed a solution for greenhouse climate control employing an online PI tuned with PSO algorithm. They indicate that the greenhouse model has high strong coupling and non-linearity, a feedback-feedforward linearization and decoupling method employing measured disturbances was used. The present controller is made in terms of several performance criteria like settling time, peak overshoot, rise time. In addition to the responses due to step input. Results show that the tuning PSO-PI using in this work has a good performance.
Xu et al., (2018) defined a structural characteristic of Chinese type greenhouse system and proposed an optimal greenhouse energy control technique. The authors presented a two-time-scale receding horizon optimal control system that utilized the north wall structure of Chinese greenhouse to facilitate heat storage and discharge during the day and at night respectively (Figure 12). This model was developed by considering the climatic difference between the Netherlands and China. This case indicates the necessity of developing a greenhouse modeling and control system that is optimized to each country’s environmental conditions.
Figure 12. Two time-scale horizon optimal control system(TTRHOC) proposed by Xu et al., (2018)
Ding et al., (2018) survey on the development of MPC during the last forty years and describe the potential future application of MPC in agriculture. This study argues that the application of intelligent algorithms to modern agricultural production requires the support of a database, which can be complex and difficult to use in practice and requires a large amount of computing. Moreover, model predictive control (MPC) methods can achieve highly accurate control operations with moderate complexity and can also allow for rolling optimization in a limited time domain, which improves precision. MPC is highly suited for application in agriculture because it can effectively address nonlinear and large time-delay systems.
Muangprathub et al., (2019) proposed the wireless sensor networks’ development for watering crops to optimize agriculture to design and develop the control system between node sensors in the field of crops and the data management via smartphone and web application. According to the results, the moisture content of the soil was maintained appropriately for vegetable growth, reducing costs and increasing agricultural productivity. Moreover, the data mining technique was applied to analyze the obtained data for predicting the suitable temperature, humidity, and soil moisture of crops in the future plan.
Yano et al., (2007) reported that a strategic ventilation strategy has an advantage in reducing energy consumption of greenhouse. Frequent control of vent openings according to the greenhouse temperature is difficult for common greenhouses where farmers operate vents by hand. Control of vent openings engenders advantages in greenhouse physical environment and energy consumption for the operation of vent openings is minimal.
Maher et al., (2016) presented for energy management by involving the photovoltaic energy in order to minimize the use of conventional electrical grid and to lower costs of agriculture production. The validation of the physical model showed a high agreement with the experimental measurement. The simulation results showed the effectiveness of the fuzzy controller as well as the PV generator for saving the energy and lowering the costs of crop production into greenhouses.
Figure 13. Schematic of the fuzzy-based control system (Maher et al., 2016).
2.3. D
EEP LEARNING-
BASED ENVIRONMENTAL MODELINGAs a means of forecasting for a diversified society, the phrase ‘‘big data’’ has become widespread. Since such big data provides more insight than existing limited data, it has received greater attention in diverse research fields (Kim et al., 2017; Wolfert et al., 2017), including science, engineering, defense, management, medicine, and politics. Data modeling is a method in which a model represents correlation relationships between one set of data and the other set of data. On the other hand, physics-based simulation modeling is a more classical, but more powerful, method in which a model represents causal relationships between a set of controlled inputs and corresponding outputs (Kim et al., 2017).(Figure 14). However, the physical model has several limitations. For instance, there might exist situations in which we are able to know little or nothing about the system. Simulation requires extensive physical and operational knowledge of a target system in order to be accurate. In this condition, for prediction, we should adopt the approach of data