© 2013 The Korean Academy of Medical Sciences.
This is an Open Access article distributed under the terms of the Creative Commons Attribution Non-Commercial License (http://creativecommons.org/licenses/by-nc/3.0) pISSN 1011-8934
Factors Associated with Diabetic Retinopathy and Nephropathy
Screening in Korea: The Third and Fourth Korea National Health
and Nutrition Examination Survey (KNHANES III and IV)
This cross-sectional study was done to identify and determine the socio-demographic and health-related factors associated with diabetic retinopathy and nephropathy screening in Korea. Participants included 2,660 adults, aged 40 or older, with diabetes. Of the 2,660 adults, 998 (37%) and 1,226 (46.1%) had received a diabetic retinopathy and a
nephropathy screening within one year, respectively. Regarding retinopathy, subjects older than 65, living in urban areas, with high educational levels, and with self-reported “unhealthy” status were likely to receive annual screening. Subjects living in urban areas, with higher educational levels, with self-reported “fair” or “unhealthy” status, and with 1 to 2 co-morbidities were likely to receive annual nephropathy screening. The Korea Composite Stock Price Index (KOSPI) continued to rise until 2007 when it started to decline over the subsequent years, following the same curve as the diabetic retinopathy and nephropathy screening rates during that time. Together with the financial matter, lack of patient education proved to be a hindrance to diabetes-related screening. The relatively low screening rates in Korea compared to the Western countries are likely to be due to the difference in the health system, economic situations and national demographics.
Key Words: Diabetes Complications; Diabetic Nephropathy; Diabetic Retinopathy; Economic Crisis; Diabetes Care; KNHANES
Tyler Hyung Taek Rim,1* Il Hwan Byun,2* Han Sang Kim,3 Sang Yeul Lee,1 and Jin Sook Yoon1
1Institute of Vision Research, Department of
Ophthalmology, 2Department of Medicine, 3Department of Internal Medicine, Yonsei University
College of Medicine, Seoul, Korea *Tyler Hyung Taek Rim and Il Hwan Byun contributed equally to this work. Received: 4 November 2012 Accepted: 18 February 2013 Address for Correspondence: Jin Sook Yoon, MD
Institute of Vision Research, Department of Ophthalmology, Yonsei University College of Medicine, 50 Yonsei-ro, Seodaemun-gu, Seoul 120-752, Korea
Tel: +82.10-9745-7015, Fax: +82.-2-312-0541 E-mail: [email protected]
http://dx.doi.org/10.3346/jkms.2013.28.6.814 • J Korean Med Sci 2013; 28: 814-820 Occupation & Environmental Medicine, Epidemiology
INTRODUCTION
Diabetic retinopathy and nephropathy are two complications of diabetes that substantially affect patient quality of life. Dia-betic retinopathy, a main complication of diabetes, often results in loss of vision and is also a leading cause of blindness in de-veloped countries throughout the world (1). The Wisconsin Ep-idemiologic Study of Diabetic Retinopathy (WESDR) states that within five years after diagnosis, 14% of diabetes type I patients and 33% of diabetes type II patients develop diabetic retinopa-thy (2). Screening for diabetic retinoparetinopa-thy is intended to detect early sight-threatening lesions, diabetic retinopathy treatable with laser photocoagulation (3), and the clinical impact of screening for retinopathy has been well established (4, 5). Dia-betic nephropathy is a frequent cause of chronic renal failure resulting from arteriolar disease or glomerulosclerosis. Diabetic retinopathy almost always precedes nephropathy, and there-fore early detection of diabetic retinopathy can be crucial for treating both complications (6).
A health disparity is defined as a difference, between socio-economic classes, in the chance of preventing certain health outcomes (7). Regarding diabetes, studies in the United States
show that health disparities still exist to this day. Yet, similar sufficient data are not available in Asian countries, particularly data based on a nationally representative data.
In this study, we investigated how socio-demographic fac-tors, health behavioral risk facfac-tors, and health status correlate with screening rates of diabetic retinopathy and nephropathy. We analyzed the trends of associated factors based on a nation-al henation-alth survey in Korea, the Third and Fourth Korea Nationnation-al Health and Nutrition Examination Survey 2005 and 2007-2009 (KNHANES III and IV, respectively). Each is a nationally repre-sentative survey conducted by the Ministry of Health and Wel-fare that provides data on vision status, health care use, and other socio-demographic factors of more than 50,000 adults.
MATERIALS AND METHODS
Study design and population
Our study evaluated data collected from KNHANES III and IV, a cross-sectional nationwide health survey in Korea, in order to identify various factors associated with diabetic retinopathy and nephropathy screening in Korea. A population-based ran-dom sampling covering 39,060 people across 600 national
dis-tricts was selected. KNHANES IV used a population-based ran-dom sampling of 24,871 individuals in households across 500 national districts. KNHANES III was a compilation of data from 2005, but KNAHNES IV included data compiled from the years 2007 to 2009. Consequently, the third survey is named 2005 KNHANES, and the fourth, 2007-2009 KNHANES. KNHANES III and IV were each divided into three parts: the Health Inter-view Survey, the Health Examination Survey, and the Nutrition Survey. For the Health Interview Survey, a trained interviewer asked questions directly to individuals aged 12 yr or older. Of the 27,422 subjects aged 40 yr older in both national health sur-veys, 2,660 were diagnosed with diabetes (1,413 from KNHANES III and 1,247 from KNHANES IV). Our study includes 2,660 adults aged 40 or older who completed questionnaires about relevant independent factors and diabetic retinopathy and nephropathy screening. KNHANES III also included several health behavior-al risk factors such as lifetime smoking and binge behavior-alcohol use in a separate health interview survey called Health Promotion Knowledge, Attitude, and Practice, but fewer people have com-pleted this survey. Of the 2,660 subjects, 1,671 have comcom-pleted the survey including health behavioral risk factors, and our study is based on these 1,671 subjects when analyzing the asso-ciations between screening and health behavioral risk factors (Fig. 1).
Outcome variables
Subjects were asked two questions: 1) “Within the past year, have you ever received an eye examination (fundus photogra-phy) to screen for diabetic retinopathy?” with possible respons-es of “yrespons-es” or “no”; 2) “Within the past year, have you ever re-ceived a urine examination (microalbuminuria) to screen for diabetic nephropathy?” with possible responses of “yes” or “no”. Independent variables
From the KNHANES III and IV dataset, we collected data re-garding various socio-demographic factors, which were ob-tained through direct interviews using structured
question-naires. The socio-demographic variables included: current age (40-49/50-64/65 yr or older), sex (male/female), residential area (urban/rural), monthly household income (lowest quin-tile/2nd-4th quintile/highest quintile), and highest educational level achieved (elementary school or lower/middle school/high school /university or higher). The health status questionnaire included self-reported health status (healthy/fair/unhealthy) and the number of co-morbidities (0/1-2/ ≥ 3). The health be-havioral risk variables included obesity (no/yes), lifetime smok-ing (no/yes), bsmok-inge alcohol use (no/yes), physical activity of moderate intensity (never/more than once in a week), sleep duration (< 6/6-8/ > 8 hr), and stress (minimally stressful/mod-erately stressful/extremely stressful).
“Residence” was classified as living in an urban area or not (e.g., living in a town or in the countryside). The per capita in-come was calculated using the following formula: household income/square root of the number of people in the household (8). To determine co-morbidities, subjects were asked the ques-tion: “Have you ever been diagnosed with diseases by a doctor before?” with possible responses of “yes” or “no”. The trained interviewer emphasized “by a doctor” to minimize potential bias in the results. Co-morbidities included hypertension, dys-lipidemia, osteoarthritis, rheumatoid arthritis, osteoporosis, atopic dermatitis, asthma, thyroid disease, and liver cirrhosis. Body mass index (BMI) was calculated using the following equa-tion: body weight in kg/height in meters squared. We used the World Health Organization’s BMI-defined obesity standard (≥ 25 kg/m2) for adults (9). All respondents were asked if they
had smoked a total of 100 cigarettes in their life (10). Those who answered “yes” and who still smoke were classified as lifetime smokers, and those who reported that they have not smoked 100 cigarettes or those who do not currently smoke were classi-fied as “non-smokers.” Binge alcohol users were defined as those who consume more than 7 drinks on a single occasion for men, and 5 drinks on a single occasion for women, on one or more occasions in a month (11). We defined moderate-intensity phys-ical activities as those lasting at least 30 min in duration and which increased heart rate slightly. Examples include volley-ball, table tennis, swimming, yoga, and badminton, but not walking (12). Regarding stress, the following question was asked: “How much stress do you feel on a daily basis?” The potential responses were “minimal, moderate, or an extreme amount”. Statistical analysis
The basic characteristics of the study population are included by descriptive statistics: population number and percentage are mentioned for each variable. A two-step, multi-dimensional approach was used to identify the predictive factors for diabetic retinopathy screening. First, to identify the predictive factors as-sociated with screening, the odds ratios and 95% confidence interval (CI) were calculated by univariate logistic regression Fig. 1. Flow diagrams showing selection of the study population.
KNHANES III (n = 24,871) + IV (n = 27,422)
DM & age ≥ 40 yr (n = 2,660) (1,413 in III/1,247 in IV)
Completed the survey including smoking and alcohol consumption
(n = 1,671)
Completed the survey except on smoking and alcohol
(n = 989) Not DM nor age < 40 yr
analysis. Second, multivariate logistic regression analysis was used to determine independent predictive factors. All of the predictive factors that were identified as affecting diabetic reti-nopathy and nephropathy screening by univariate analysis were included in the multivariate analysis. For the multivariate analysis, we used the data of 1,671 subjects who completed the heal th survey including health behavioral factors. Furthermore, to evaluate temporal trends of predictive factors of diabetic reti-nopathy and nephropathy screening, multivariate logistic anal-ysis was performed using all the socio-demographic factors in KNHANES III and IV, separately. Since this does not include health behavioral risk factors, we used the data of 2,660 subjects to evaluate the temporal trends. All statistical tests were two-sided at 95% CI and were performed using the Stata/SE soft-ware version 12.1 (StataCorp, College Station, TX, USA). Ethics statement
This study was approved by the institutional review board of Severance Hospital, Yonsei University College of Medicine in Seoul, Korea (IRB number: 4-2013-0172). Informed consent was waived by the board.
RESULTS
Baseline characteristics of the study population
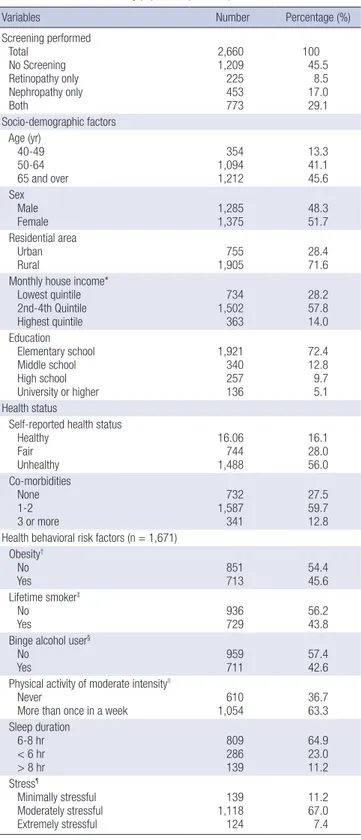
The participant characteristics at baseline are described in Ta-ble 1. The mean age of the 2,660 participants aged more than 40 yr was 62.6 yr (standard deviation; 10.4). Of the 2,660 adults, 225 (8.5%) had received a diabetic retinopathy screening only, 453 (17.0%) had received a diabetic nephropathy screening only, and 773 (29.1%) had received screening for both within the pre-vious year.
Screening rates and trends by year
The screening rate for diabetic retinopathy was 38.1% in KNHA-NES III and 36.9% in KNHAKNHA-NES IV and the rate for diabetic ne-phropathy was 50.4% in KNHANES III and 41.2% in KNHANES IV (Fig. 2A). To evaluate the relationship between socio-econo-mic status and screening rates, we compared the Korea Com-posite Stock Price Index (KOSPI) to the screening rates. The KOSPI slowly increased until 2007 and then decreased over the next few years (reflecting the global economic crisis), which is the exact same pattern seen in the diabetic retinopathy screen-ing rates (Fig. 2B). In contrast, in the United States, the Dow Jones Industrial Average (DJIA) decreased after 2007 but both diabetic retinopathy and nephropathy screening rates gradual-ly increased (Fig. 2C).
Factors associated with diabetic retinopathy and nephropathy screening
The statistically significant factors associated with diabetic
reti-Table 1. Characteristics of study population (n=2,660)
Variables Number Percentage (%)
Screening performed Total No Screening Retinopathy only Nephropathy only Both 2,660 1,209 225 453 773 100 45.5 8.5 17.0 29.1 Socio-demographic factors Age (yr) 40-49 50-64 65 and over 354 1,094 1,212 13.3 41.1 45.6 Sex Male Female 1,2851,375 48.3 51.7 Residential area Urban Rural 1,905 755 28.4 71.6
Monthly house income* Lowest quintile 2nd-4th Quintile Highest quintile 734 1,502 363 28.2 57.8 14.0 Education Elementary school Middle school High school University or higher 1,921 340 257 136 72.4 12.8 9.7 5.1 Health status
Self-reported health status Healthy Fair Unhealthy 16.06 744 1,488 16.1 28.0 56.0 Co-morbidities None 1-2 3 or more 732 1,587 341 27.5 59.7 12.8 Health behavioral risk factors (n = 1,671)
Obesity† No Yes 851 713 45.654.4 Lifetime smoker‡ No Yes 936 729 56.2 43.8
Binge alcohol user§
No
Yes 959 711 57.4 42.6
Physical activity of moderate intensity||
Never
More than once in a week 1,054 610 36.7 63.3 Sleep duration 6-8 hr < 6 hr > 8 hr 809 286 139 64.9 23.0 11.2 Stress¶ Minimally stressful Moderately stressful Extremely stressful 139 1,118 124 11.2 67.0 7.4 *To derive income per adult, we used the following formula: income/square root of the number of persons in the household; †We used the World Health Organization’s
BMI-defined obesity standard (≥ 25 kg/m2) for adults; ‡Lifetime smokers included
sub-jects who reported that they have smoked at least 100 cigarettes in their lifetime and now smoke; §Binge alcohol users were defined as those who consume more than 7
drinks on a single occasion for men, and 5 drinks on a single occasion for women, on one or more occasions in a month; ||Moderate-intensity activities were defined as
lasting at least 30 min and increasing the heart rate slightly, as compared with sed-entary activities; ¶Stress was assessed with the question: “How much stress do you
nopathy screening in the univariate analysis were all socio-de-mographic factors with the exception of age (Table 2). All other variables of health status, including lifetime smoking and binge alcohol use, were statistically significant. In terms of nephropa-thy screening, factors including residential area, monthly in-come, education, self-reported health status, co-morbidities, and lifetime smoker status were statistically significant in the univariate analysis.
When the statistically significant variables in the univariate analysis were combined in a multivariate analysis, four factors continued to be statistically significant in each screening (Table 2). Subjects who were 65 or older (adjusted Odds Ratio [aOR], 1.6; 95% CI, 1.1-2.4) were more likely to receive diabetic retino-pathy screening than those who were 40 to 49. Also, subjects living in urban areas (aOR, 1.7; 95% CI, 1.3-2.2) were more likely to receive diabetic retinopathy screening than those living in rural areas. Subjects who graduated from middle school (aOR, 1.6; 95% CI, 1.1-2.2), high school (aOR, 1.5; 95% CI, 1.1-2.1), or from a higher education institute (aOR, 2.7; 95% CI, 1.8-4.2) were more likely to receive diabetic retinopathy screening com-pared to subjects who graduated from elementary school or lower. In terms of health status, subjects with a self-reported “unhealthy” health status (aOR, 1.7; 95% CI, 1.3-2.3) were more likely to receive diabetic retinopathy screening than those who did not self-report this status.
Subjects living in urban areas (aOR, 1.5; 95% CI, 1.2-1.9) were more likely to have received diabetic nephropathy screening than those living in rural areas. Subjects who graduated from middle school (aOR, 1.5; 95% CI, 1.1-2.0), high school (aOR, 1.9; 95% CI, 1.4-2.5), or a higher education institute (aOR, 1.8; 95% CI, 1.2-2.7) were more likely to receive diabetic nephropathy screening compared to subjects who graduated from elemen-tary school or lower. In terms of health status, subjects with a self-reported “fair” health status (aOR, 1.4, 95% CI, 1.0-1.9) or “unhealthy” health status (aOR, 1.8; 95% CI, 1.2-2.7) were more likely to receive diabetic nephropathy screening than those who did not self-report this status. Subjects with one or two co-mor-bidities were more likely to receive diabetic nephropathy screen-ing than those with no co-morbidities (aOR, 1.4; 95% CI, 1.1-1.8).
DISCUSSION
In this study, we analyzed various factors associated with the screening rates of diabetic retinopathy and nephropathy using nationally representative datasets. Many interesting results ap-peared, including various risk factors as well as a trend of dia-betic retinopathy and nephropathy screening rates from 2005 to recent years. Our study presents two possibilities: the rela-tively low screening rates of Korea compared to Western coun-tries may be due to the differences of economic development of those countries, or they may be due to the unique health care Fig. 2. Screening rates of diabetic retinopathy and nephropathy. (A) Diabetic
retinop-athy screening rates are 38.1% (SE 5.5) in Korea National Health and Nutrition Ex-amination Survey 2005 (KNHANES III) and 36.9% (SE 5.8) in KNHANES IV. Diabetic nephropathy screening rates are 50.4% (SE 5.3) in KNHANES III and 41.2% (SE 5.8) in KNHANES IV. (B) The averages of diabetic retinopathy screening rates were 38.1% (SE 5.5) in 2005, 41.7% (SE 14.2) in 2007, 35.2% (SE 9.4) in 2008, and 36.7% (SE 8.8) in 2009. In terms of diabetic nephropathy screening, the rates were 42.9% (SE 14.4) in 2007, 38.3% (SE 9.3), and 43.2% (SE 8.6) in 2009. The Korea Composite Stock Price Index (KOSPI) goes parallel with the diabetic retinopathy and nephropathy screening rates. (C) The averages of diabetic retinopathy screening rates in the United States were 54.8 in 2005, 54.6 in 2006, 55.0 in 2007, 56.5 in 2008, and 56.5 in 2009. The averages of diabetic nephropathy screening rates were 55.1 in 2005, 79.7 in 2006, 80.6 in 2007, 82.4 in 2008, and 82.9 in 2009. The Dow Jones Industrial Average (DJIA) decreased after 2007, but both diabetic retinopathy and nephropathy screening rates gradually increased.
Diabetic retinopathy and nephropathy screening rate in KNHANES III and IV
KNHANES III KNHANES IV KNHANES III KNHANES IV Diabetic retinopathy screening Diabetic nephropathy screening
38.1 36.9 50.4 41.2
A
Diabetic retinopathy screening rate from 2002 to 2009 and KOSPI
KOSPI
KNHANES III (2005) 2007 2008 2009
38.1 41.7 35.2 36.7
Diabetic nephropathy screening rate from 2002 to 2009 and KOSPI
KOSPI
KNHANES III (2005) 2007 2008 2009
50.4 42.9 38.3 43.2
B
C
Diabetic retinopathy screening rate in U.S. from 2005 to 2009 and Dow Jones Industrial Average
DJIA
2005 2006 2007 2008 2009
54.8 54.6 55.0 56.5 56.5
Diabetic nephropathy screening rate in U.S. from 2005 to 2009 and Dow Jones Industrial Average
DJIA
2005 2006 2007 2008 2009
system of Korea and the people’s specific situations such as in-come and education.
In the United States, The State of Health Care Quality publish-ed by The National Committee for Quality Assurance in 2009 states that diabetic retinopathy screening rates were 56.5% for a commercial group with a Health Maintenance Organization. In a study in London published in 1980, the screening rate was re-ported to be 59% (13). For diabetic nephropathy screening, the Committee reported screening rates of 82.9% for the commer-cial group, 88.6% for the Medicare group, and 76.9% for the Me-dicaid group in 2009. We could see that the diabetic retinopathy and nephropathy screening rates in Korea are still lower than those reported in other advanced countries.
Several barriers to screening have been suggested. First, a
short supply of ophthalmologists and primary physicians could negatively affect screening rates, especially in low-income and rural regions (14). Second, even with easy access to eye care, patients are reluctant to undergo re-examination the following year after an examination ranging from 16% to 49% (15-17). To solve the shortage of ophthalmologists, teleophthalmology could be a cost-effective method of decreasing disparities be-tween higher-educated, urban patients and under-educated, rural patients (18, 19). The lack of patient education, rather than financial shortage, led to low compliance with screening rec-ommendations and lack of follow up re-examinations among patients (14). Therefore, while decreasing cost is important, it should be combined with multi-dimensional patient education using a booklet or video (20). Ultimately, the establishment of a Table 2. Factors associated with screening for diabetes complications and trends-multivariate analysis
Variables
Diabetic retinopathy screening Diabetic nephropathy screening
% KNHANES III and IV P value KNHANES III KNHANES IV % KNHANES III and IV P value KNHANES III KNHANES IV n = 1,671 n = 1,413 n = 1,247 n = 1,671 n = 1,413 n = 1,247
aOR 95%CI aOR aOR aOR 95%CI aOR aOR
Sociodemographic factors Age (yr) 40-49 50-64 65 or older 35.6 35.6 39.9 1.0 (ref) 1.3 1.6 (0.9-1.9) (1.1-2.4) 0.12 0.01 1.0 (ref) 1.2 1.5 1.0 (ref) 1.3 2.0 45.5 48.0 44.6 1.0 (ref) 1.3 1.2 (0.9-1.9) (0.8-1.8) 0.11 0.31 1.0 (ref) 1.5 1.4 1.0 (ref) 1.1 1.1 Sex Male Female 35.2 39.8 1.0 (ref) 1.4 (1.0-1.9) 0.07 1.0 (ref) 1.5 1.0(ref) 1.5 45.5 46.7 1.0 (ref) 1.0 (0.8-1.4) 0.85 1.0 (ref) 1.2 1.0 (ref) 1.4 Residential area Rural Urban 31.1 40.1 1.0 (ref) 1.7 (1.3-2.1) < 0.01 1.0 (ref) 1.2 1.0 (ref) 1.5 40.8 48.2 1.0 (ref) 1.5 (1.2-1.9) < 0.01 1.0 (ref) 1.0 1.0 (ref) 1.5 Monthly house income*
Lowest quintile 2nd-4th quintile Highest quintile 34.4 37.8 42.7 1.0 (ref) 1.1 1.3 (0.9-1.4)(0.9-1.8) 0.38 0.19 1.0 (ref) 1.3 1.7 1.0 (ref) 1.0 1.0 41.1 46.8 51.8 1.0 (ref) 1.0 1.1 (0.8-1.3)(0.8-1.6) 0.93 0.45 1.0 (ref) 1.3 1.6 1.0 (ref) 1.0 1.0 Education
Elementary school or lower Middle school
High school or higher University or higher 34.6 40.5 40.3 46.9 1.0 (ref) 1.5 1.5 2.8 (1.1-2.1) (1.1-2.1) (1.9-4.2) 0.01 < 0.01 < 0.01 1.0 (ref) 1.4 1.6 2.0 1.0(ref) 1.4 1.5 2.6 42.0 49.1 53.1 51.2 1.0 (ref) 1.4 1.9 2.0 (1.0-1.9) (1.4-2.6) (1.3-2.9) 0.03 < 0.01 < 0.01 1.0 (ref) 1.2 1.4 1.7 1.0 (ref) 1.4 2.0 1.8 Health status NA NA
Self-reported health status Healthy Fair Unhealthy 30.6 34.5 41.0 1.0 (ref) 1.0 1.7 (0.8-1.5) (1.3-2.3) 0.80 < 0.01 34.2 47.1 49.0 1.0 (ref) 1.4 1.7 (1.0-2.0) (1.3-2.3) 0.02 < 0.01 Co-morbidities None 1-2 3 or more 32.8 38.9 41.6 1.0 (ref) 1.2 1.1 (0.9-1.5 )(0.8-1.7) 0.21 0.49 39.9 48.0 50.6 1.0 (ref) 1.3 1.3 (1.0-1.7)(0.9-2.0) 0.02 0.12 Health behavioral risk factors (n = 1,665)
Lifetime smoker† No Yes 38.3 33.3 1.0 (ref) 0.9 (0.7-1.2) 0.58 42.6 39.1 1.0 (ref) 0.8 (0.6-1.1) 0.17 Binge alcohol user‡
No Yes 38.3 33.2 1.0 (ref) 0.9 (0.7-1.1) 0.19 42.1 39.6 1.0 (ref) 0.9 (0.7-1.1) 0.40
*To derive income per adult, we used the following formula: income/square root of the number of persons in the household; †Lifetime smokers included subjects who reported
that they have smoked at least 100 cigarettes in their lifetime and now smoke; ‡Binge alcohol users were defined as those who consume more than 7 drinks on a single
diabetic registry would be the best way to offer comprehensive diabetic care, because it would enable identification of high-risk groups and patient-targeted programs.
Regarding age, diabetes patients aged 65 or older had a sig-nificantly higher rate of diabetic retinopathy screening. These figures could be explained by the fact that patients who are younger may have less time to visit a doctor and be screened. Regarding sex, females had a higher screening rate than males with a marginal statistical significance, which may be due to the fact that in Korea fewer women have occupations compared to men and therefore have more spare time in which to be screen-ed. In terms of nephropathy screening, no definite difference was found in relation to age or sex. Regarding co-morbidities, however, patients with one or more co-morbidities were more likely to receive screening for microalbuminuria. This could be explained by the fact that internists often run tests for nephrop-athy along with tests for diabetes screening, but tests for retino-pathy require additional consultations with ophthalmologists. In our multivariate analysis, subjects with higher educational levels had significantly higher diabetic retinopathy and nephro-pathy screening rates than those with lower educational levels, in both time periods of KNHANES III and IV. Regarding month-ly income, however, there was a significant disparity in the KN-HANES III survey period, but such difference disappeared in the KNHANES IV survey period in both diabetic retinopathy and nephropathy screening. We presume that the decreased screening rates in years 2008 and 2009 are influenced mostly by education levels rather than monthly incomes. In Korea, the cost of fundus photography is about U$6 equivalent, which is significantly inexpensive compared to a cost of about U$30-60 in the United States. The cost of the test for microalbuminuria is similarly low in Korea, about U$13 equivalent, in comparison to a cost of about U$59-79 in the United States.
There are several earlier studies on the relationship between economic conditions and health care status, and interestingly, the theories behind these studies can be applied to our study of Korea’s diabetic screening rates. The global financial crisis a few years ago has had a profound impact on the healthcare spend-ing plans of national governments as well as individuals (21). The global economic trend over the last several years has been very similar to that of the KOSPI and this trend has a deep asso-ciation with diabetic retinopathy and nephropathy screening rates. In Fig. 2B, KOSPI slowly increased until 2007 and then decreased over the next few years, which is exactly the same pattern seen in diabetic retinopathy and nephropathy screen-ing rates. Fig. 2C shows the diabetic retinopathy and nephropa-thy screening rates of commercial groups in the United States from 2005 to 2009 and DJIA. The screening rate gradually in-creased while the DJIA dein-creased after 2008. In the United States there was no association between diabetic retinopathy and ne-phropathy screening rates and the DJIA. Whereas healthcare
utilization has decreased in developing countries such as Korea and Indonesia, healthcare in some countries, such as Germany, appeared to improve during the economic crisis because of an increase in unemployment and the resulting additional time to receive medical care (22). Recently in the United States, an over-all reduction in usage of non-emergency medical care after the economic crisis was reported, and the reductions were more noticeable among the unemployed, people with lower incomes, and younger people (23). This is consistent with previous re-ports in Korea that people with higher incomes were only slight-ly affected, while the poor were highslight-ly influenced by the eco-nomic crisis in 1998 (24).
Our study has several limitations. Since this is a cross-section study, a temporal cause and effect relationship cannot be es-tablished, as with all cross-section studies. Secondly, this study only involves Asians, so circumstances may be different in West-ern countries, leading to different results. But this limitation can also be a strength because not many studies involve Asian pop-ulation. Regarding subjects, some bias may exist because there are more subjects living in rural areas than urban areas. Simi-larly, there are more subjects of low educational levels than high-er levels in this study. Finally, this study does not include the re-lationship between subjects’ specific glucose levels and the fre-quency of receiving examinations. It is possible that patients with higher glucose levels may receive more frequent tests, and further study should be done about this matter in the future. Despite the limitations, our study is significant as an analysis of predictive factors associated with diabetic retinopathy and nephropathy screening rates on a nationally representative ba-sis. As an economically developing nation, Korea has a low screening rate, and this has close ties to the economic condi-tions and socio-economic discrepancies among the popula-tion. Education especially, rather than monthly income, proved to be a critical factor that affects both diabetic retinopathy and nephropathy screening rates. This conclusion may be correct for other nations throughout the world and, consequently, give doctors a new focus on education when treating diabetes pa-tients. We therefore conclude that doctors of ophthalmology, internal medicine, family medicine, and any other field that in-volves diabetes patients should keep this fact in mind and edu-cate diabetes patients who have lower educational levels about the importance of retinopathy and nephropathy screening. These efforts should be supported on a national scale as well.
DISCLOSURE
The authors have no conflicts of interest to disclose.
REFERENCES
im-pairment in the world today. JAMA 2003; 290: 2057-60.
2. Varma R. From a population to patients: the Wisconsin epidemiologic study of diabetic retinopathy. Ophthalmology 2008; 115: 1857-8. 3. Photocoagulation for diabetic macular edema: Early Treatment
Dia-betic Retinopathy Study report number 1: Early Treatment DiaDia-betic Retinopathy Study research group. Arch Ophthalmol 1985; 103: 1796-806.
4. Javitt JC, Aiello LP, Chiang Y, Ferris FL 3rd, Canner JK, Greenfield S. Preventive eye care in people with diabetes is cost-saving to the federal government: implications for health-care reform. Diabetes Care 1994; 17: 909-17.
5. Javitt JC, Canner JK, Frank RG, Steinwachs DM, Sommer A. Detecting and treating retinopathy in patients with type I diabetes mellitus: a health policy model. Ophthalmology 1990; 97: 483-94.
6. Talley NJ, O’Connor S. Examination medicine: a guide to physician train-ing. 6th ed. Sydney: Churchill Livingston, Elsevier, 2010.
7. Braveman P. Health disparities and health equity: concepts and mea-surement. Annu Rev Public Health 2006; 27: 167-94.
8. Deaton A, Lubotsky D. Mortality, inequality and race in American cities and states. Soc Sci Med 2003; 56: 1139-53.
9. Defining an international standard for overweight and obesity in child-hood. BMJ 2000; 320: 0.
10. Centers for Disease Control and Prevention (CDC). Cigarette smoking among adults: United States, 1992, and changes in the definition of cur-rent cigarette smoking. MMWR Morb Mortal Wkly Rep 1994; 43: 342-6. 11. World Health Organization, Department of Mental Health Substance
Dependence, Noncommunicable Diseases Mental Health Cluster. In-ternational guide for monitoring alcohol consumption and related harm. Geneva: World Health Organization, 2000.
12. Ainsworth BE, Haskell WL, Whitt MC, Irwin ML, Swartz AM, Strath SJ, O’Brien WL, Bassett DR Jr, Schmitz KH, Emplaincourt PO, et al. Com-pendium of physical activities: an update of activity codes and MET in-tensities. Med Sci Sports Exerc 2000; 32: S498-504.
13. Yudkin JS, Boucher BJ, Schopflin KE, Harris BT, Claff HR, Whyte NJ, Taylor B, Mellins DH, Wootliff AB, Safir JG, et al. The quality of diabetic
care in a London health district. J Epidemiol Community Health 1980; 34: 277-80.
14. Hartnett ME, Key IJ, Loyacano NM, Horswell RL, Desalvo KB. Perceived barriers to diabetic eye care: qualitative study of patients and physicians. Arch Ophthalmol 2005; 123: 387-91.
15. Brechner RJ, Cowie CC, Howie LJ, Herman WH, Will JC, Harris MI. Oph-thalmic examination among adults with diagnosed diabetes mellitus. JAMA 1993; 270: 1714-8.
16. Saaddine JB, Engelgau MM, Beckles GL, Gregg EW, Thompson TJ, Na-rayan KM. A diabetes report card for the United States: quality of care in the 1990s. Ann Intern Med 2002; 136: 565-74.
17. Mukamel DB, Bresnick GH, Wang Q, Dickey CF. Barriers to compliance with screening guidelines for diabetic retinopathy. Ophthalmic Epide-miol 1999; 6: 61-72.
18. Aoki N, Dunn K, Fukui T, Beck JR, Schull WJ, Li HK. Cost-effectiveness analysis of telemedicine to evaluate diabetic retinopathy in a prison po-pulation. Diabetes Care 2004; 27: 1095-101.
19. Whited JD, Datta SK, Aiello LM, Aiello LP, Cavallerano JD, Conlin PR, Horton MB, Vigersky RA, Poropatich RK, Challa P, et al. A modeled eco-nomic analysis of a digital tele-ophthalmology system as used by three federal health care agencies for detecting proliferative diabetic retinopa-thy. Telemed J E Health 2005; 11: 641-51.
20. Legorreta AP, Hasan MM, Peters AL, Pelletier KR, Leung KM. An inter-vention for enhancing compliance with screening recommendations for diabetic retinopathy: a bicoastal experience. Diabetes Care 1997; 20: 520-3.
21. Parry J, Humphreys G. Health amid a financial crisis: a complex diag-nosis. Bull World Health Organ 2009; 87: 4-5.
22. Neumayer E. Recessions lower (some) mortality rates: evidence from Germany. Soc Sci Med 2004; 58: 1037-47.
23. Lusardi A, Schneider DJ, Tufano P. The economic crisis and medical care usage: NBER Working Paper. No. 15843. Cambridge: National Bureau of Economic Research, 2010, p1-24.
24. Yang BM, Prescott N, Bae EY. The impact of economic crisis on health-care consumption in Korea. Health Policy Plan 2001; 16: 372-85.
Appendix 1. The factors associated with screening for diabetes complications-univariate analysis (n = 2,660)
Variables Diabetic retinopathy screening Diabetic nephropathy screening
OR 95% CI P value OR 95% CI P value Socio-demographic factors Age (yr) 40-49 50-64 65 or older 1.0 (ref) 1.0 1.2 (0.8-1.3)(0.9-1.5) 0.99 0.15 1.0 (ref) 1.1 1.0 (0.9-1.4)(0.8-1.2) 0.41 0.76 Sex Male
Female 1.0 (ref)1.2 (1.0-1.4) 0.02 1.0 (ref)1.1 (0.9-1.2) 0.52
Residential area Rural
Urban
1.0 (ref)
1.5 (1.2-1.8) < 0.01
1.0 (ref)
1.3 (1.1-1.6) < 0.01 Monthly house income* Lowest quintile
2nd-4th quintile Highest quintile 1.0 (ref) 1.2 1.4 (1.0-1.4) (1.1-1.8) 0.12 < 0.01 1.0 (ref) 1.3 1.5 (1.1-1.5) (1.2-2.0) 0.01 < 0.01 Education Elementary school or lower
Middle school High school university or higher 1.0 (ref) 1.3 1.3 1.7 (1.0-1.6) (1.0-1.6) (1.3-2.2) 0.03 0.02 < 0.01 1.0 (ref) 1.3 1.6 1.4 (1.1-1.7) (1.3-1.9) (1.1-1.9) 0.01 < 0.01 < 0.01 Health status
Self-reported health status Healthy Fair Unhealthy 1.0 (ref) 1.2 1.6 (0.9-1.5)(1.3-2.0) < 0.010.17 1.0 (ref) 1.7 1.8 (1.3-2.2)(1.5-2.3) < 0.01< 0.01 Co-morbidities None 1-2 3 or more 1.0 (ref) 1.3 1.5 (1.1-1.6)(1.2-2.0) < 0.01< 0.01 1.0 (ref) 1.4 1.5 (1.2-1.7)(1.2-2.0) < 0.01< 0.01 Health behavioral risk factors (n = 1,665)
Obesity† No
Yes 1.0 (ref)1.0 (0.8-1.2) 0.74 1.0 (ref)1.1 (0.9-1.3) 0.59
Lifetime smoker‡ No
Yes 1.0 (ref)0.8 (0.7-1.0) 0.03 1.0 (ref)0.9 (0.7-1.1) 0.15 Binge alcohol user§ No
Yes
1.0 (ref)
0.8 (0.7-1.0) 0.03
1.0 (ref)
0.9 (0.7-1.1) 0.30 Physical activity of moderate intensityII Never
More than once in a week 1.0 (ref)0.9 (0.7-1.1) 0.15 1.0 (ref)0.9 (0.7-1.1) 0.28
Sleep duration 6-8 hr < 6 hr > 8 hr 1.0 (ref) 1.3 1.2 (1.0-1.7)(0.8-1.7) 0.06 0.35 1.0 (ref) 1.1 1.0 (0.8-1.4)(0.7-1.5) 0.70 0.94
Stress¶ Minimally stressful
Moderately stressful Extremely stressful 1.0 (ref) 1.1 1.0 (0.8-1.4)(0.7-1.6) 0.56 0.88 1.0 (ref) 1.1 0.9 (0.8-1.3)(0.6-1.4) 0.58 0.78 *To derive income per adult, we used the following formula: income/square root of the number of persons in the household; †We used the World Health Organization’s
BMI-de-fined obesity standard (≥ 25 kg/m2) for adults; ‡Lifetime smokers included subjects who reported that they have smoked at least 100 cigarettes in their lifetime and now smoke; §Binge alcohol users were defined as those who consume more than 7 drinks on a single occasion for men, and 5 drinks on a single occasion for women, on one or more
oc-casions in a month; IIModerate-intensity activities were defined as lasting at least 10 min and increasing the heart rate slightly, as compared with sedentary activities; ¶Stress was