저작자표시-비영리-변경금지 2.0 대한민국 이용자는 아래의 조건을 따르는 경우에 한하여 자유롭게 l 이 저작물을 복제, 배포, 전송, 전시, 공연 및 방송할 수 있습니다. 다음과 같은 조건을 따라야 합니다: l 귀하는, 이 저작물의 재이용이나 배포의 경우, 이 저작물에 적용된 이용허락조건 을 명확하게 나타내어야 합니다. l 저작권자로부터 별도의 허가를 받으면 이러한 조건들은 적용되지 않습니다. 저작권법에 따른 이용자의 권리는 위의 내용에 의하여 영향을 받지 않습니다. 이것은 이용허락규약(Legal Code)을 이해하기 쉽게 요약한 것입니다. Disclaimer 저작자표시. 귀하는 원저작자를 표시하여야 합니다. 비영리. 귀하는 이 저작물을 영리 목적으로 이용할 수 없습니다. 변경금지. 귀하는 이 저작물을 개작, 변형 또는 가공할 수 없습니다.
A DISSERTATION FOR THE DEGREE OF DOCTOR OF PHILOSOPHY
Construction of Pepper Core Collection
and GWAS for Various Agronomic Traits
in Capsicum
고추의 핵심집단 구축과 다양한 농업적 형질에
대한 전장유전체연관분석
AUGUST 2018
HEA-YOUNG LEE
MAJOR IN HORTICULTURAL SCIENCE AND BIOTECHNOLOGY DEPARTMENT OF PLANT SCIENCE
i
Construction of Pepper Core Collection and GWAS
for Various Agronomic Traits in Capsicum
HEA-YOUNG LEE
Department of Plant Science
Seoul National University
ABSTRACT
Genome-wide association study (GWAS) is an effective approach for identifying genetic variants associated with major agronomic traits. To identify the corresponding genomic regions governing complex traits, a core collection of pepper was constructed for GWAS of agronomic traits.
Core collection is a group of plant accessions that consists of a minimum number of germplasm accessions represtinting maximum genetic diversity of the whole collection. A total of 240 accessions were selected from 3,821 Capsicum accessions based on transcriptome-based 48 single nucleotide polymorphic (SNP) markers with genome-wide distribution and 32 traits using a systematic approach. In addition, 111 of additional accessions were supplemented to the core collection
ii
in order to construct a GWAS population. Using a genotype-by-sequencing (GBS) method, a total of 507,713 genome-wide high quality SNP markers across 351 accessions were developed. Linkage disequlibrium (LD) analysis revealed an average length of LD block estimated as 81.2 kb. The GWAS population was phenotypically characterized for three years for four oligogenic traits (fruit orientation, fruit surface wrinkle, stem pubescence density, stem color), nine quantitative traits related with fruit morpholgy (length, width, weight of fruit, pericarp thickness, and fruit number) and four vegetative growth (main stem length, stem thickness, length and width of leaf). GWAS was performed to identify genomic regions controlling the 13 agronomic traits. As a result, a total of 620 common SNPs were identified of which 573 SNPs were included in 343 haplotype blocks. QTL regions identified by GWAS were validated by comparative analyses between previously reported QTLs.
To gain insight into functional relevance, the candidate genes were predicted for the 343 haplotype regions. In addition, the genetic area of 81.2kb spanned 47 significant SNPs not included in any LD blocks also predicted the candidate genes. Therefore, a total of 679 annotated genes for 13 agronomic traits were discovered within the haplotype blocks. These genomic regions contained the genes encoding ATP-binding such as ABC transporters and growth response factors (GRFs) appear to be associated with the fruit morphological traits, and genes predicted to encode glucose transferase, glutathione transferase, and sucrose synthase appear to be
iii associated with the vegetative traits.
Collectively, the significant haplotypes identified in this study provide the unique molecular footprints to develop markers for pre-breeding and genomic selection. Future functional validation for the candidate genes identified in this study will augment the genomic landscape of major agronomic traits in pepper breeding.
Keywords: Genome-wide association study (GWAS), pepper core collection, quantitative trait locus (QTL), Genotype-by-sequencing (GBS), Linkage disequilibrium (LD), haplotype
iv
CONTENTS
ABSTRACT………..…i CONTENTS………... iv LIST OF TABLES………..vii LIST OF FIGURES……….... ix LIST OF ABBREVIATIONS………... xi GENERAL INTRODUCTION………...1CHAPTER I. Genetic diversity and population structure analysis to construct a core collection from a large Capsicum germplasm ABSTRACT……….………..…15
INTRODUCTION………..17
MATERIALS AND METHODS……….………...20
Plant materials………...……..20
DNA extraction and SNP genotyping……….….……20
Population structure analysis………...25
Phylogenetic and principal coordinate analyses………….……….……25
Statistical analysis of genetic diversity………..……….……….……25
Establishment of the core collection……….………….…..………26
v
RESULTS………...………32
Genetic diversity of the Capsicum germplasm……….……..………..32
Population structure of the germplasm collection……….….…..37
Molecular phylogenetic analysis of the germplasm collection……….….…..43
Optimization of core set selection methods and construction of the core collection………..45
Evaluation of the core set using markers with multiple alleles………….…..51
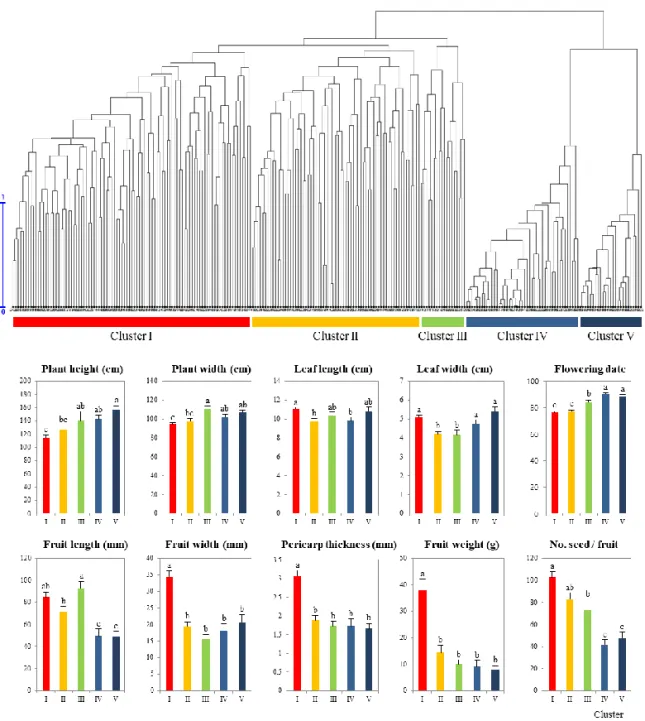
Morphological variations of CC240………..…..54
DISCUSSION………..…...….. 58
REFERENCES………..……….………66
CHAPTER II. Genome-wide association study of 13 agronomic traits in Capsicum ABSTRACT………...74
INTRODUCTION………..76
MATERIALS AND METHODS………79
Plant materials….………..…….…….79
Phenotype evaluation ………..…………...….80
gDNA extraction and genotyping-by-sequencing……….……...81
Reference based SNP calling and construction of the SNP set………...…….81
vi
Genome-wide association study (GWAS) and candidate gene identification
………..82
RESULTS………...84
Phenotypic variation and correlation among 13 agronomic traits in GWAS population ………84
Interspecific and intraspecific variation in GWAS population ………91
Population stratification and LD analysis ...95
GWAS for four oligogenic traits ……….……….. 100
Significant SNPs and haplotypes correlate with nine quantitative agronomic traits based on GWAS ………..………..105
Overview of the candidate genes accounting for the nine quantitative agronomic traits ...108
Candidate genes controlling the traits with strong phenotypic correlations...110
Examination of structural bias in GWAS analysis ………....….115
DISCUSSION………..………123
REFERENCES………...………..127
vii
LIST OF TABLES
CHAPTER I
Table I-1. Summary of SNP marker analyses for germplasm collections used in this study ………23 Table I-2. Description of various traits used in this study ………….………27 Table I-3. Genetic diversity analysis of the 4,652 pepper accessions ………...….34 Table I-4. Genetic diversity analysis of the 3,821 pepper accessions …………....36 Table I-5. Diversity-related summary statistics for all clusters inferred by STRUCTURE analysis ……….40 Table I-6. Distribution of Capsicum species in STRUCTURE clusters within 3,821 germplasm accessions according to species ………....41 Table I-7. Comparisons of distribution frequency and representativeness among five different core collections constructed based on diverse sampling strategies ………...48 Table I-8. Multiple allelic markers used to evaluate the core collection in
Capsicum ...52
Table I-9. Comparison of genetic diversity between the 3,821 accession collection and different core collections using an additional set of multiplex markers ...53 Table I-10. Analysis of melocular variance (AMOVA) among various subpopulations based on different clustering methods within 3,821 Capsicum accessions ………...64
viii
Table I-11. Comparison among different core collections established by diverse genetic clustering methods ………...65
CHAPTER II
Table II-1. Phenotypic variation of nine quantitative agronomic traits for GWAS population based on three year evaluations ..………...………87
Table II-2.Pearson correlation and p-value among the 13 investigated traits …….90
Table II-3.Descriptive statistics for 13 agronomic traits across the species based on
one-way ANOVA with Scheffe multiple comparison post-hoc test …...…….93
Table II-4.Number of SNP in each step of filtering process among pepper genome
……….96 Table II-5. Haplotype block estimation among 12 chromosomes ……….99 Table II-6. Significant SNPs, haplotypes, and candidate genes commonly discovered between GWAS using the whole GWAS population and the population consisting of only C. annuum for seven agronomic traits …...….119
ix
LIST OF FIGURES
CHAPTER I
Figure I-1. Distribution of 4,652 Capsicum germplasm accessions based on HO
(observed heterozygosity)………....…35 Figure I-2. Population structure of the Capsicum germplasm collection …….….39 Figure I-3. Distribution of 3,821 germplasm accessions in population structure clusters according to their origin and geographic location ……….…….42 Figure I-4. Unrooted phylogenetic tree of the Capsicum germplasm ……….…...44 Figure I-5. Principal coordinate analysis of distributions of diverse core entries selected from different sampling strategies ………...………...49 Figure I-6. Comparison of phenotypic measurements among five clusters in CC240 ……….57
CHAPTER II
Figure II-1. Phenotypic variation of four oligogenic agronomic traits for GWAS population based on three year evaluations …...………...………88 Figure II-2. Correlations among three years replications of 12 traits in GWAS population ………...………89 Figure II-3. Interspecific and intraspecific comparison of nine quantitative trait distribution ………...………...………92
x
Figure II-4. Genetic distributions of GWAS population and its sub-clusters based on principal component analysis (PCA) ………..………... 98 Figure II-5. Manhattan plots for four oligogenic agronomic traits among three year investigations ………... 103 Figure II-6. Comparison between QTLs and significant haplotypes identified in GWAS linked to fruit orientation ……….………..104 Figure II-7. Manhattan plots for nine quantitative agronomic traits among three year investigations ……….…….……...106 Figure II-8. Integrative GWAS identifies candidate genes linked to FWd, FWg, and
PT ………....………...112 Figure II-9. Integrative GWAS identifies candidate genes linked to LL and LW...114 Figure II-10. GWAS for 13 agronomic traits using a population consisting of only
xi
LIST OF ABBREVIATIONS
CR Coincidence rate of range
CTAB Cetyl trimethylammonium bromide
CV Coefficient of variation
F Inbreeding coefficient
FL Fruit length
FnP Fruit number per a plant
FP Fruit orientation
FST Genetic differentiation
FsW Fruit surface wrinkle
FWd Fruit width
FWg Fruit weight
GAPIT Genome Association and Prediction Integrated Tool
GBS Genotyping-by-sequencing
G+Pcc Core entries based on the combination of genotype and phenotype data
Gcc Core entries based on SNP genotype data only
Gg+Pcc Core entries based on the combination of genotype and phenotype data
Ggcc Core entries in each cluster were selected based on genotype data only
GRF Growth response factor
GWAS Genome wide accosiation study
xii
HE Expected heterozygosity
HO Observed heterozygosity
I Shannon’s information index of diversity
J’ Genetic evenness
LD Linkage disequilibrium
LL Leaf length
LW Leaf width
MAF Minor allele frequency
MD Mean difference percentage
MSL Main stem length
M strategy Maximization strategy
PCA Principal component analysis
Pcc Core entries based on phenotype data only
PIC Polymorphic information content
PT Pericarp thickness
QTL Quantitative trait locus
SC Stem color
SNP Single nucleotide polymorphism
SP Stem pubescence density
ST Stem thickness
xiii
VD Variance difference percentage
1
GENERAL INTRODUCTION
Capsicum spp. including hot and sweet peppers is an economically important
vegetable cultivated and consumed worldwide. Peppers and its extracts are being used as spices and medicine contributing to the improvement of human health [1, 2].
The genus of Capsicum consists of 35 species, which generally are described as shrubs, stellate to rotate corollas with diverse pigmentation patterns, fleshy and globose berries with different sizes and colors. The unique characteristic of this genus in the Solanaceae is the cup-shaped calyx with five to ten teeth as nerve prolongations [3]. The molecular phylogenetic analysis has been performed with diverse species and groupings have been made into some clades such as C. annuum complex, C. baccatum complex, C. pubescens complex, and C. chacoense complex [4, 5, 6]. Although many of interspecific relationships were studied and interpreted intraspecific relationships are largely unresolved and the uncertainties still remain due to insufficient species sampling [7, 8].
Conservation and sustainable utilization of genetic resources are keys to improvement of agricultural productivity and sustainability. Moreover, expansion of variations in the resources and their accessibility to breeders are of particular importance. To make efficient use of the large germplasm collection, the concept of a core collection has been proposed. A core collection is a subset of a germplasm collection of a species that represents the genetic diversity of the entire collection
2
[11]. A good core collection is one that has no redundant accessions, is small enough to be easily managed, and represents the total genetic diversity [12].
Various types of information including passport data, geographic origins [13, 14], agronomic traits [15, 16, 17], and molecular markers [18] can be used for selecting a core set. Although the major reason for establishing a core set is to reduce the number of representative accessions up to 10% while maintaining the diversity of the entire collection, there are a number of possible methods for the selection of a core set depending on the research goals. In the early 2000s, most researchers performed random sampling using various assignment methods [13, 15]. Later, the M (maximization) strategy was proposed as a more effective method to select a core set representing the maximum genetic diversity without redundancy [16, 19].
Several research institutions have collected and conserved thousands of
Capsicum accessions, ranging from 1,000 in the Centre for Genetic Resources
(CGN), the Netherlands [9] to almost 8,000 in the Asian Vegetable Research and Development Center (AVRDC), Taiwan [10]. Several research groups have established core collections to reveal phenotypic and genetic variation [16, 17, 18]. Some of them had specific purpose to construct core collections for disease resistance against northern root-knot nematode and Potato virus Y (PVY), and for the analysis of antioxidant activities [13, 14, 15]. However, these studies involved a relatively small number of accessions, using fewer than 1,000 accessions with
3
limited numbers of morphological traits and molecular markers [15, 16, 18]. The limited number of morphological traits and markers allow one to survey only a small portion of the genetic diversity of the entire germplasm, and the resulting data cannot be used for genome-wide variation studies.
To understand the genetic basis of variation in complex traits and to improve these traits, use of quantitative trait locus (QTL) analysis for diverse agronomic traits has increased. In pepper, most of the traditional QTL analyses were focused on fruit related traits, especially for the fruit weight and shape. Previous studies revealed that major QTLs for fruit weight such as fw3.2, fw2.1, fw2.1, FW-1, and
FW-6.1 were detected especially on chromosomes 1 to 4 and 6 [20, 21, 22, 23, 24]
while major QTLs for fruit shape such as fs3.1, fs2.1 FrSHP2.1 were detected in chromosomes 2 and 3. Other fruit related QTLs such as fs10.1and Frs10.1 were identified in chromosome 10 [20-23, 25-28]. Of note is that the fruit shape controlling genes reported in tomato such as ovate, sun, fas, lc, POS1 were also expected to share similar genetic basis in pepper [29, 30]. Nonetheless, few studies has focus on vegetative traits, such as plant height, stem thickness, and leaf length [24, 28, 31, 32].
Despite several QTL studies, genetic and molecular basis of the genes governing important agronomic traits remain insufficient. Furthermore, the estimated QTL intervals range few to several cM comprising of large genomic regions with numerous candidate genes [33]. The results of QTL analysiswith a
4
low-resolution appear to have derived from a small number of recombination events that occurred over a few generations during the development of biparental mapping populations [34].
The inherent limitation of the biparental QTL mapping analysis can be overcome with the use of genetic association panels that contain a wide range of genetic variation and increased numbers of crossover events [35]. A GWAS approach and subsequent candidate gene identifications have been found to be effective in several plant species including Arabidopsis [36, 37], rice [38, 39] and maize [40]. In pepper, only two association studies have been reported for fruit weight, capsaicinoid contents and peduncle length using diverse pepper germplasms, which included 94 C. annuum accessions and 283 C. baccatum accessions [41, 42]. Of the 7,331 SNPs determined by GBS method, 16 common SNPs predicted ten candidate genes for capsaicinoid contents in the target regions [41]. For the peduncle length in C. baccatum, of the 13,129 SNPs 36 effective SNPs identified 17 candidate genes [42].
Although GWAS approach can efficiently detect multiple QTLs, the association panels in the same population with unrelated genotypes may limit the linkage disequilibrium between pairs of neighbouring marker loci [43, 44]. Therefore, for extensive coverage of the pepper genome, tens of thousands of markers generated by proper genotyping techniques such as GBS, resequencing with imputation of missing data, and consideration of LD are required [33, 45].
5
In chapter I, I performed population structure analysis in a large Capsicum germplasm collection consisting of 3,821 accessions by applying 48 genome-wide SNPs, and selected a core set using the SNP data together with data for 32 morphological traits. This allowed me to 1) examine the level of genetic diversity and the population structure within the worldwide Capsicum germplasm collection, 2) optimize selection methods by comparing different core sets, which were selected using a stepwise selection strategy based on various combinations of data and clustering methods, and 3) ultimately construct a Capsicum core collection that represents the entire germplasm collection without redundancy. Finally, I validated the core collection by evaluating the diversity of a range of traits and genotyping additional molecular markers. This core collection will be a valuable data set for both pepper breeding and genome-wide association studies.
In chapter II, I identified the high quality SNP set from the pepper core collection and assigned the significant genic regions for 13 agronomic traits that included four oligogenic traits of fruit and stem (fruit orientation, fruit surface wrinkle, stem pubescence density, stem color) and nine quantitative traits involved in fruit morphology (length, width, and weight of fruit, pericarp thickness, total fruit number per a plant) and vegetative growth (length and width of leaf, main stem length, stem thickness) using GWAS. This allowed me to identify 1) phenotypic variation and correlation among 13 agronomic traits, 2) linkage disequilibrium (LD) of pepper, and 3) significant haplotypes and candidate genes associated with 13
6 agronomic traits.
7
REFERENCES
1. Wahyuni Y, Ballester AR, Sudarmonowati E, Bino RJ, Bovy AG. Metabolite biodiversity in pepper (Capsicum) fruits of thirty-two diverse accessions: Variation in health-related compounds and implications for breeding. Phytochemistry. 2011;72:1358–70.
2. McCormack PL. Capsaicin Dermal Patch: In Non-Diabetic Peripheral Neuropathic Pain. Drugs. 2010;70:1831–42.
3. Carrizo García C, Barfuss MHJ, Sehr EM, Barboza GE, Samuel R, Moscone EA, et al. Phylogenetic relationships, diversification and expansion of chili peppers (Capsicum, Solanaceae). Ann Bot. 2016;118(1):35–51.
4. Walsh BM, Hoot SB. Phylogenetic Relationships of Capsicum (Solanaceae) Using DNA Sequences from Two Noncoding Regions: The Chloroplast atpB ‐ rbcL Spacer Region and Nuclear waxy Introns. Int J Plant Sci. 2001;162(6):1409–18.
5. Jarret RL, Dang P. Revisiting the waxy locus and the Capsicum annuum L. complex. Georg J Sci. 2004;62(3):118.
6. Ince AG, Karaca M, Onus AN. Genetic relationships within and between
Capsicum species. Biochem Genet. 2010;48(1–2):83–95.
7. Naegele RP, Mitchell J, Hausbeck MK. Genetic diversity, population structure, and heritability of fruit traits in Capsicum annuum. PLoS ONE. 2016;11(7):1– 17.
8
8. Taranto F, D’Agostino N, Greco B, Cardi T, Tripodi P. Genome-wide SNP discovery and population structure analysis in pepper (Capsicum annuum) using genotyping by sequencing. BMC Genomics. 2016;17(1):1–13.
9. CGN downloadable data for pepper.
http://cgn.websites.wur.nl/Website/downloads/DownloadCnr38.htm 10. AVGRIS (AVRDC Vegetable Genetic Resources Information System).
http://203.64.245.173/search.asp
11. Frankel OH. Genetic perspectives of germplasm conservation. In Genetic manipulation: impact on man and society. Edited by Arber W, Llimensee K, Peacock WJ, Starlinger P. Cambridge: Cambridge University Press; 1984. p.161–70.
12. Odong TL, Jansen J, van Eeuwijk FA, van Hintum TJL. Quality of core collections for effective utilisation of genetic resources review, discussion and interpretation. Theor Appl Genet. 2013;126:289–305.
13. Thies JA, Fery RL. Evaluation of a core of the U.S. Capsicum germplasm collection for reaction to the Northern root-knot nematode. HortScience. 2002;37:805–10.
14. Quenouille J, Saint-Felix L, Moury B, Palloix A. Diversity of genetic backgrounds modulating the durability of a major resistance gene. Analysis of a core collection of pepper landraces resistant to Potato virus Y. Mol Plant Pathol. 2016;17:296–302.
9
15. Hanson PM, Hanson PM, Yang R, Lin S, Tsou SCS, Lee TC, et al. Variation for antioxidant activity and antioxidants in a subset of AVRDC-the World Vegetable Center Capsicum core collection. Plant Genet Resour. 2004;2:153–66.
16. Zewdie Y, Tong N, Bosland P. Establishing a core collection of Capsicum using a cluster analysis with enlightened selection of accessions. Genet Resour Crop Evol. 2004;51:147–51.
17. Fan M, Chen S, Engle LM. The study on genetic diversity of the core collection for Capsicum using random amplified. J Agric Res China. 2004;53:165–78. 18. Nicolaï M, Cantet M, Lefebvre V, Sage-Palloix AM, Palloix A. Genotyping a
large collection of pepper (Capsicum spp.) with SSR loci brings new evidence for the wild origin of cultivated C. annuum and the structuring of genetic diversity by human selection of cultivar types. Genet Resour Crop Evol. 2013;60:2375–90.
19. Franco J, Crossa J, Taba S, Shands H. A sampling strategy for conserving genetic diversity when forming core subsets. Crop Sci. 2005;45:1035–44. 20. Chaim A Ben, Paran I, Grube RC, Jahn M, Van Wijk R, Peleman J. QTL
mapping of fruit-related traits in pepper (Capsicum annuum). Theor Appl Genet. 2001;102(6–7):1016–28.
21. Rao GU, Ben Chaim A, Borovsky Y, Paran I. Mapping of yield-related QTLs in pepper in an interspecific cross of Capsicum annuum and C. frutescens. Theor Appl Genet. 2003;106(8):1457–66.
10
22. Zygier S, Chaim AB, Efrati A, Kaluzky G, Borovsky Y, Paran I. QTLs mapping for fruit size and shape in chromosomes 2 and 4 in pepper and a comparison of the pepper QTL map with that of tomato. Theor Appl Genet. 2005;111(3):437– 45.
23. Palloix A, Barchi L, Lefebvre V, Sage-Palloix AM, Lanteri S. QTL analysis of plant development and fruit traits in pepper and performance of selective phenotyping. Theor Appl Genet. 2009;118(6):1157–71.
24. Han K, Jeong HJ, Yang HB, Kang SM, Kwon JK, Kim S, et al. An ultra-high-density bin map facilitates high-throughput QTL mapping of horticultural traits in pepper (Capsicum annuum). DNA Res. 2016;23(2):81–91.
25. Chaim AB, Borovsky Y, De Jong W, Paran I. Linkage of the A locus for the presence of anthocyanin and fs10.1, a major fruit-shape QTL in pepper. Theor Appl Genet. 2003;106(5):889–94.
26. Chaim AB, Borovsky Y, De Jong W, Paran I. Linkage of the A locus for the presence of anthocyanin and fs10.1, a major fruit-shape QTL in pepper. Theor Appl Genet. 2003;106(5):889–94.
27. Borovsky Y, Paran I. Characterization of fs10.1, a major QTL controlling fruit elongation in Capsicum. Theor Appl Genet. 2011;123(4):657–65.
28. Chunthawodtiporn J, Hill T, Stoffel K, Van Deynze A. Quantitative Trait Loci Controlling Fruit Size and Other Horticultural Traits in Bell Pepper (Capsicum
11
29. Ramchiary N, Kehie M, Brahma V, Kumaria S, Tandon P. Application of genetics and genomics towards Capsicum translational research. Plant Biotechnol Rep. 2014;8(2):101–23.
30. Wang L, Li J, Zhao J, He C. Evolutionary developmental genetics of fruit
morphological variation within the Solanaceae. Front Plant Sci.
2015;6(April):1–10.
31. Yarnes SC, Ashrafi H, Reyes-Chin-Wo S, Hill T a, Stoffel KM, Van Deynze a. Identification of QTLs for capsaicinoids, fruit quality, and plant architecture-related traits in an interspecific Capsicum RIL population. Genome. 2013;56(1):61–74.
32. Moulin MM, Rodrigues R, Bento CS, Gonçalves L, Santos JO, Sudré CP, et al. Genetic dissection of agronomic traits in Capsicum baccatum var. Pendulum. Genet Mol Res. 2015;14(1):2122–32.
33. Korte A, Farlow A. The advantages and limitations of trait analysis with GWAS: A review. Plant Methods. 2013;9(1):1.
34. Balasubramanian S, Schwartz C, Singh A, Warthmann N, Kim MC, Maloof JN, et al. QTL mapping in new Arabidopsis thaliana advanced intercross-recombinant inbred lines. PLoS ONE. 2009;4(2):1–8.
35. Braulio J. Soto-Cerda and Sylvie Cloutier. Association Mapping in Plant Genomes, Genetic Diversity in Plants. Edited by Mahmut Caliskan. ISBN: 978-953-51-0185-7. InTech; 2012; p.29-48.
12
36. Togninalli M, Seren Ü , Meng D, Fitz J, Nordborg M, Weigel D, et al. The AraGWAS Catalog: A curated and standardized Arabidopsis thaliana GWAS catalog. Nucleic Acids Res. 2018;46(D1):D1150–6.
37. Atanasov KE, Barboza-Barquero L, Tiburcio AF, Alcázar R. Genome Wide Association Mapping for the Tolerance to the Polyamine Oxidase Inhibitor Guazatine in Arabidopsis thaliana. Front Plant Sci. 2016;7(April):1–11.
38. Pantaliao GF, Narciso M, Guimaraes C, Castro A, Colombari JM, Breseghello F, et al. Genome wide association study (GWAS) for grain yield in rice cultivated under water deficit. Genetica. 2016;144(6):651–64.
39. Wang X, Pang Y, Zhang J, Wu Z, Chen K, Ali J, et al. Genome-wide and gene-based association mapping for rice eating and cooking characteristics and protein content. Sci Rep. 2017;7(1):1–10.
40. Xiao Y, Liu H, Wu L, Warburton M, Yan J. Genome-wide Association Studies in Maize: Praise and Stargaze. Mol Plant. 2017;10(3):359–74.
41. Nimmakayala P, Abburi VL, Saminathan T, Alaparthi SB, Almeida A, Davenport B, et al. Genome-wide Diversity and Association Mapping for Capsaicinoids and Fruit Weight in Capsicum annuum L. Sci Rep. 2016;6(July):1–14.
42. Nimmakayala P, Abburi VL, Saminathan T, Almeida A, Davenport B, Davidson J, et al. Genome-Wide Divergence and Linkage Disequilibrium Analyses for
13
Polymorphisms. Front Plant Sci. 2016;7(November):1–12.
43. Hyten DL, Choi IY, Song Q, Shoemaker RC, Nelson RL, Costa JM, et al. Highly variable patterns of linkage disequilibrium in multiple soybean populations. Genetics. 2007;175(4):1937–44.
44. Li D, Zhao X, Han Y, Li W, Xie F. Genome-wide association mapping for seed protein and oil contents using a large panel of soybean accessions. Genomics. 2018;(September 2017):1–6.
45. Sonah H, O’Donoughue L, Cober E, Rajcan I, Belzile F. Identification of loci governing eight agronomic traits using a GBS-GWAS approach and validation by QTL mapping in soya bean. Plant Biotechnol J. 2015;13(2):211–21.
14
CHAPTER I
Genetic diversity and population structure analysis to
construct a core collection from a large Capsicum
germplasm
The research described in this chapter has been published in BMC genetics DOI: 10.1186/s12863-016-0452-8
15
ABSTRACT
Conservation of genetic diversity is an essential prerequisite for developing
new cultivars with desirable agronomic traits. Although a large number of
germplasm collections have been established worldwide, many of them face major difficulties due to large size and a lack of adequate information about population structure and genetic diversity. Core collection with a minimum number of accessions and maximum genetic diversity of pepper species and its wild relatives will facilitate easy access to genetic material as well as the use of hidden genetic diversity in Capsicum.
To explore genetic diversity and population structure, we investigated patterns of molecular diversity using a transcriptome-based 48 single nucleotide polymorphisms (SNPs) in a large germplasm collection comprising 3,821 accessions. Among the 11 species examined, Capsicum annuum showed the highest
genetic diversity (HE=0.44, I=0.69), whereas the wild species C. galapagoense
showed the lowest genetic diversity (HE=0.06, I=0.07). The Capsicum germplasm
collection was divided into 10 clusters (cluster 1 to 10) based on population structure analysis, and five groups (group A to E) based on phylogenetic analysis.
Capsicum accessions from the five distinct groups in an unrooted phylogenetic tree
showed taxonomic distinctness and reflected their geographic origins. Most of the accessions from European countries are distributed in the A and B groups, whereas
16
the accessions from Asian countries are mainly distributed in C and D groups. Five different sampling strategies with diverse genetic clustering methods were used to select the optimal method for constructing the core collection. Using a number of
allelic variations based on 48 SNP markers and 32 different
phenotypic/morphological traits, a core collection 'CC240' with a total of 240 accessions (5.2 %) was selected from within the entire Capsicum germplasm. Compared to the other core collections, CC240 displayed higher genetic diversity (I=0.95) and genetic evenness (J’=0.80), and represented a wider range of phenotypic variation (MD = 9.45%, CR = 98.40%).
A total of 240 accessions were selected from 3,821 Capsicum accessions based on transcriptome-based 48 SNP markers with genome-wide distribution and 32 traits using a systematic approach. This core collection will be a primary resource for pepper breeders and researchers for further genetic association and functional analyses.
17
INTRODUCTION
Pepper (Capsicum spp.) is one of the major vegetable and spice crops grown worldwide, and is rich in bioactive compounds, such as capsaicinoids and carotenoids, which contribute to the improvement of human health [1,2]. Because of its economic and nutritional importance, breeders have improved quality traits of pepper, such as pungency, fruit shape, abiotic stress tolerance, and disease resistance. Meanwhile, genetic diversity of breeding lines has become smaller and some useful genes in the landraces are lost due to the breeding activities [3,4]. Therefore, conservation and sustainable utilization of genetic resources are keys to continuous improvement of peppers [5].
During the last several decades, there has been remarkable progress in germplasm collection and conservation of various plants. Although a large number of germplasms have been collected, their management has become more and more complicated due to their huge sizes. Furthermore, little is known about the genetic diversity and structure of such collections at the interspecific and intraspecific levels [6]. To make efficient use of large germplasm collections, the concept of core collections has been proposed. A core collection is a subset of a germplasm collection of a species that represents the genetic diversity of the entire collection [7]. A good core collection is one that has no redundant accessions, is small enough to be easily managed, and represents the total genetic diversity [8].
18
agronomic traits [11-13], and molecular markers [14] can be used for selecting a core set. Although the major reason for establishing a core set is to reduce the number of representative accessions up to 10% while maintaining the diversity of the entire collection, there are a number of possible methods for selection of a core set depending on the research goals. In the early 2000s, most researchers performed
random sampling using various assignment methods [9,11]. Later, the M
(maximization) strategy was proposed as a more effective method to select a core set representing the maximum genetic diversity without redundancy [12,15].
Several research institutions have collected and conserved thousands of
Capsicum accessions, ranging from 1,000 in the Centre for Genetic Resources
(CGN), the Netherlands [16] to almost 8,000 in the Asian Vegetable Research and Development Center (AVRDC), Taiwan [17]. Researchers and institutions have attempted to construct core collections of Capscicum spp. for various purposes. Fan et al. [13], Nicolai et al. [14], and Zewdie et al. [12] established core collections to reveal phenotypic and genetic variation. Thies and Fery [9], and Quenouille et al. [10] constructed a core collection for disease resistance against northern root-knot nematode and Potato virus Y (PVY), respectively. Hanson et al. [11] developed a core collection to analyze antioxidant activities. However, most studies involved a relatively small number of accessions, using fewer than 1,000 accessions with limited numbers of morphological traits and molecular markers [11,12,14]. The limited number of morphological traits and markers allow us to survey only a small
19
portion of the genetic diversity of the entire germplasm, and the resulting data cannot be used for genome-wide variation studies.
In this study, we performed population structure analysis in a large Capsicum germplasm collection consisting of 3,821 accessions by applying 48 genome-wide SNPs, and selected a core set using the SNP data together with data for 32 morphological traits. This allowed us to 1) examine the level of genetic diversity and the population structure within the worldwide Capsicum germplasm collection; 2) optimize selection methods by comparing different core sets, which were selected using a stepwise selection strategy based on various combinations of data and clustering methods; and 3) ultimately construct a Capsicum core collection that represents the entire germplasm collection without redundancy. Finally, we validated the core collection by evaluating the diversity of a range of traits and genotyping additional molecular markers. This core collection will be a valuable data set for both pepper breeding and genome-wide association studies.
20
MATERIALS AND METHODS
Plant materials
A total of 4,652 Capsicum accessions used in this study originated from 97 countries and included 11 species: C. annuum, C. baccatum, C. cardenasii, C.
chacoense, C. chinense, C. eximium, C. frutescens, C. galapagoense, C. praetermissum, C. pubescens, and C. tovarii. The geographic origin and passport
data of the germplasm accessions were obtained from the Rural Development Administration (RDA, Jeonju, Korea) and Seoul National University (SNU, Seoul, Korea). Among the germplasm accessions, 3,599 were obtained from the RDA, and 1,053 were obtained from SNU. Most of the accessions were C. annuum, accounting for 4,163 accessions. Four other domesticated species, C. baccatum, C.
chinense, C. frutescens, and C. pubescens accounted for 163, 122, 152, and 11
accessions, respectively. Among the wild Capsicum species, C. cardenasii, C.
chacoense, C. eximium, C. galapagoense, C. praetermissum and C. tovarii
accounted for 1, 28, 4, 2, 5, and 1 accessions, respectively
DNA extraction and SNP genotyping
Two young leaves from each accession were used for DNA extraction. DNA was extracted using the cetyl trimethylammonium bromide (CTAB) method as described previously [18]. The concentration and purity of DNA samples were determined with a NanoDrop 1000 spectrophotometer (NanoDrop Technologies,
21
Wilmington, DE, USA). DNA samples showing absorbance ratios above 1.8 at 260/280 nm were used for marker analysis.
A set of 48 SNP markers evenly distributed in 12 pepper chromosomes were used in this study [19] (Table I-1). In a preliminary study a total of 282 accessions were randomly selected from entire germplasm collection for genetic diversity study with 412 SNP markers developed by Kang et al. [19]. Based on this analysis, highly polymorphic SNP markers (PIC > 0.45) were selected. Genotyping was performed using the BioMark™ HD system (Fluidigm, San Francisco, CA, USA), EP1™ system (Fluidigm, San Francisco, CA, USA), and 48×48 Dynamic Array IFCs (Fluidigm, San Francisco, CA, USA) according to the manufacturer’s protocol [20]. Specific target amplification (STA) was performed prior to SNP genotyping analysis. PCR was performed in a 5-μL reaction containing 60 ng of the DNA sample according to the manufacturer’s protocol. Thermal cycling conditions were 15 min at 95°C, followed by 14 cycles of a 2-step amplification profile of 15 s at 95°C and 2 min at 60°C. For genotyping, SNPtype assays were performed using STA products following manufacturer’s protocol. Thermal cycling was carried out at 95°C for 15 s, 64°C for 45 s and 72°C for 15 s with a touchdown of -1°C per cycle from 64 to 61°C, followed by 34 cycles of 95°C for 15 s, 60°C for 45 s and 72°C for 15 s. For the species verification and/or identification of pepper accessions with missing species information, SNP markers C2_At5g04590, C2_At1g50020, and C2_At2g19560 were used based on high resolution melting (HRM) analysis
22
[21]. Genotyping analysis was performed using a Rotor Gene 6000 (Qiagen, Valencia, CA, USA).
23
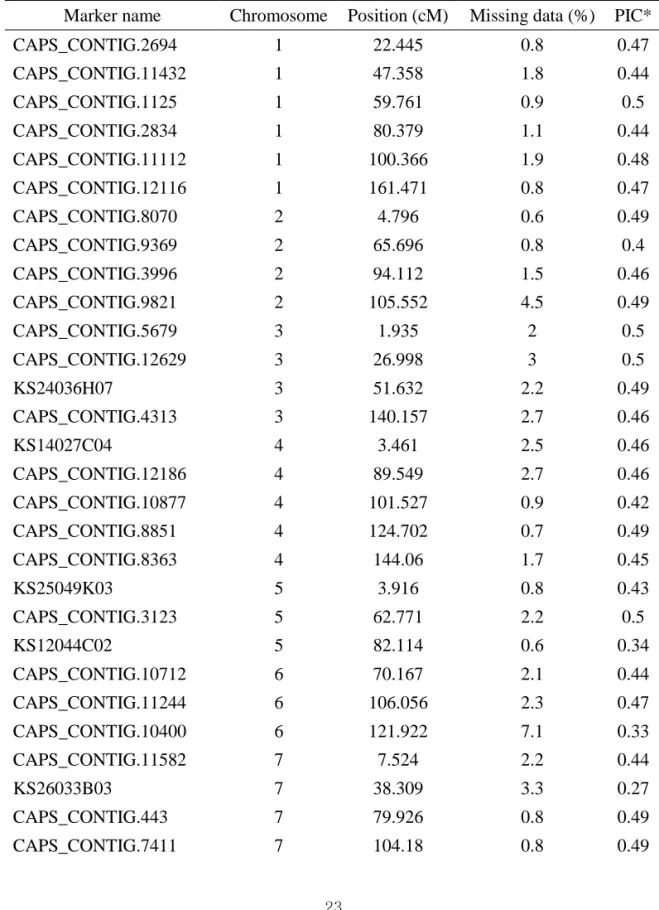
Table I-1. Summary of 48 SNP marker analyses for germplasm collections used in this study
Marker name Chromosome Position (cM) Missing data (%) PIC* CAPS_CONTIG.2694 1 22.445 0.8 0.47 CAPS_CONTIG.11432 1 47.358 1.8 0.44 CAPS_CONTIG.1125 1 59.761 0.9 0.5 CAPS_CONTIG.2834 1 80.379 1.1 0.44 CAPS_CONTIG.11112 1 100.366 1.9 0.48 CAPS_CONTIG.12116 1 161.471 0.8 0.47 CAPS_CONTIG.8070 2 4.796 0.6 0.49 CAPS_CONTIG.9369 2 65.696 0.8 0.4 CAPS_CONTIG.3996 2 94.112 1.5 0.46 CAPS_CONTIG.9821 2 105.552 4.5 0.49 CAPS_CONTIG.5679 3 1.935 2 0.5 CAPS_CONTIG.12629 3 26.998 3 0.5 KS24036H07 3 51.632 2.2 0.49 CAPS_CONTIG.4313 3 140.157 2.7 0.46 KS14027C04 4 3.461 2.5 0.46 CAPS_CONTIG.12186 4 89.549 2.7 0.46 CAPS_CONTIG.10877 4 101.527 0.9 0.42 CAPS_CONTIG.8851 4 124.702 0.7 0.49 CAPS_CONTIG.8363 4 144.06 1.7 0.45 KS25049K03 5 3.916 0.8 0.43 CAPS_CONTIG.3123 5 62.771 2.2 0.5 KS12044C02 5 82.114 0.6 0.34 CAPS_CONTIG.10712 6 70.167 2.1 0.44 CAPS_CONTIG.11244 6 106.056 2.3 0.47 CAPS_CONTIG.10400 6 121.922 7.1 0.33 CAPS_CONTIG.11582 7 7.524 2.2 0.44 KS26033B03 7 38.309 3.3 0.27 CAPS_CONTIG.443 7 79.926 0.8 0.49 CAPS_CONTIG.7411 7 104.18 0.8 0.49
24 ANOK.CO907546 8 10.686 0.6 0.5 KS15049B04 8 41.179 1.8 0.49 CAPS_CONTIG.12056 9 33.107 1.2 0.5 CAPS_CONTIG.9017 9 58.533 1.1 0.35 CAPS_CONTIG.4367 9 70.713 0.7 0.5 CAPS_CONTIG.7156 9 100.715 2 0.38 CAPS_CONTIG.3147 10 2.08 0.6 0.43 CAPS_CONTIG.6621 10 12.222 2.8 0.42 KS11062F02 10 59.859 0.8 0.5 CAPS_CONTIG.2972 10 92.679 2.7 0.5 CAPS_CONTIG.8503 11 10.194 0.9 0.42 CAPS_CONTIG.10012 11 40.275 1.5 0.42 KS12026E02 11 60.04 0.9 0.48 CAPS_CONTIG.8372 11 84.206 1.9 0.43 CAPS_CONTIG.12518 12 4.303 1.7 0.49 CAPS_CONTIG.8629 12 19.498 0.6 0.5 CAPS_CONTIG.12402 12 59.33 0.9 0.49 CAPS_CONTIG.12230 12 76.415 2.2 0.5 CAPS_CONTIG.9030 12 99.119 0.6 0.5
25 Population structure analysis
To analyze the population structure of the entire germplasm collection used in this study, we used a model based genetic clustering algorithm [22] as implemented in the STRUCTURE program ver. 2.3.4 [23]. The number of sub-populations (ΔK) was determined using the ad hoc statistical method, based on the rate change in the log probability of data between successive K values [24]. Fifty independent runs for K values ranging from 1 to 20 were performed with a burn-in length of 50,000 followed by 1,000,000 iterations.
Phylogenetic and principal coordinate analyses
Phylogenetic trees were produced using genotyping data with 48 SNP markers using both the unweighted neighbor-joining method and the hierarchical clustering method based on the dissimilarity matrix calculated with Manhattan index, as implemented in the DARwin software (version 6.0.9). Principal coordinate analyses were also performed with DARwin 6.0.9 [25].
Statistical analysis of genetic diversity
Different indices were used for analysis and comparison of diversity among the
Capsicum collections. These include levels of observed heterozygosity (HO),
expected heterozygosity (HE), polymorphic information content (PIC), genetic
26
evenness (J’). Indices Ho, HE, PIC, and FST were calculated using Power Marker
3.25 [26]. For analysis of genetic diversity of core collections, I and J’ were calculated following Hennink and Zeven [27] and Pielou [28], respectively. Analysis of molecular variance (AMOVA) was conducted to detect the genetic variance within and among population using GenAlEx ver 6.502 [29].
Establishment of the core collection
To establish a core collection, five different methods were used. Specifically, core sets were selected based on 1) genotype analysis of the whole collection, 2) genotype analysis of each cluster after grouping based on genotype dissimilarity, 3) phenotype analysis of the whole collection, 4) a combination of genotype and phenotype analysis of whole collection, and 5) a combination of phenotype and genotype analysis of each cluster after grouping based on genotype dissimilarity.
Representative accessions were selected based on the advanced M strategy using a modified heuristic algorithm implemented in PowerCore software [30]. Categorical variables, such as genotype and qualitative phenotype were applied in several classes (3 to 12 classes) based on distinct characters. Continuous variables (quantitative phenotypes, 7 to 12 classes) were automatically classified into
different categories in the software based on Sturges’ rule [31].Therefore, a total of
27 T able I -2. D es cri p ti on o f v ari ou s t rai ts us ed i n thi s s tud y T y pe C at eg or y T rai t D es cr ipt ion s† N um ber of c las se s Q ual it at iv e Pla n t hab it ( 3 ) Pla n t hab it 1 = s p rea d ing , 2 = int er m edi at e, 3 = st ra ig ht , 4 = fas ci cl e 4 (15 i tem s) Ste m col or 1 = g ree n, 2 = pu rpl e s tr ipe, 3 = pu rpl e pi eba ld, 4 = pur pl e 4 Pubesc ens 1 = g labr o us, 2 = i n te rm edi at e, 3 = ex ce ssi v e 3 Leaf ( 2) Leaf col or 1 = l ig ht g ree n, 2 = g ree n, 3 = dar k g ree n, 4 = g ree n+pu rpl e, 5 = pur pl e 5 Leaf si ze 1 = ex tr em el y sm al l, 2 = sm al l, 3 = m edi um , 4 = bi g 4 Flower ( 4) Flower co lor 1 = w hi te, 2 = l ig ht g ree n, 3 = w hi te wi th y el low spo ts, 4 = w hi te + pur p le, 5 = pu rpl e, 6 = ot her s 6 Flower si ze 1 = s m al l, 2 = m edi um , 3 = bi g 3 Flower pos it ion 1 = er ec t, 2 = m edi um , 3 = penda n t, 4 = m ixed 4 Sta m en c ol o r 1 = w hi te, 2 = y el low , 3 = b lue 3 Frui t ( 5 ) Frui t po si ti o n 1 = er ec t, 2 = penda nt , 3 = m ixed 3 R ec ep tac le 1 = cup sha p e, 2 = in ter m ed iat e, 3 = tr ay sha pe, 4 = si nk t y pe 4
28 Frui t sh ape 1 = bl o ck y , 2 = l am uy o, 3 = pum p k in, 4 = co ni cal (r oug h, sm al l) , 5 = con ica l (sm oot h) , 6 = k apy a, 7 = jal ape no , 8 = jo lok ia (bum py ), 9 = ca y enne peppe r, 10 = cu rl y bum p y peppe r, 11 = t aba sc o, 12 = b er ry 12 Im m at ur e c o lor 1 = l ig ht g ree n, 2 = g ree n, 3 = dar k g ree n, 4 = y el low , 5 = br ow n, 6 = pu rp le, 7 = w hi te 7 Ma tur e co lor 1 = or ang e, 2 = r ed, 3 = da rk r ed, 4 = y el low , 5 = br ow n, 6 = pur pl e, 7 = b la ck , 8 = o rang e r ed 8 Seed ( 1) Seed c ol o r 1 = y el low , 2 = b row n, 3 = bl ac k , 4 = o the rs 4 Q uant it at iv e Pla n t hab it s ( 6 ) H ei g ht ( cm ) R ang e: 17~20 9, I nt er v al s: 1 6 12 (17 i tem s) Wi d th (cm ) R ang e: 5.6~1 85, I nt er v al s: 14.95 12 Ma in s tem l eng th (cm ) R ang e: 0.5~9 3, I nt er v al s: 9. 25 10 Ste m t hi ck nes s( m m ) R ang e: 0.3~5 8.2, I nt er v al s: 4.82 12 N ode l eng th ( cm ) R ang e: 0.1~1 8, I nt er v al s: 1. 63 11 N o br an ch R ang e: 1~28, I nt er v al s: 2.2 5 12 Leaf ( 2) Leaf l eng th (cm ) R ang e: 1.1~2 7, I nt er v al s: 2. 16 12 Leaf w idt h ( cm ) R ang e: 1.1~1 3.4, I nt er v al s: 1.12 11 Flower ( 2) A v er ag e num ber of ant he rs R ang e: 1~7, I nt er v al s: 0. 55 11 Flower ing dat e R ang e: 12~17 3, I nt er v al s: 1 3.42 12 Frui t ( 5 ) Frui t l eng th ( m m ) R ang e: 0.34~ 56.2, I nt er v al s: 4.66 12
29 Frui t w id th (m m ) R ang e: 0.1~1 07, I nt er v al s: 8.91 12 Frui t w ei g ht ( g ) R ang e: 0.2~1 96.2, I nt er v al s: 17.82 11 N um ber of f rui ts p er node R ang e: 1~8, I nt er v al s: 0. 64 11 Per ica rp t h ick nes s (m m ) R ang e: 0.9~7. 2, I nt er v al s: 0 .9 7 Seed ( 2) N um ber of se eds R ang e: 1~271 , I nt er v al s: 24 .55 11 1,000 se eds w ei g ht ( g ) R ang e: 1~11. 5, I nt er v al s: 0. 95 11 T ot al cl a ss es = 264 †Descr ip tio ns f or q uan titat iv e tr aits ar e ab ou t r an ge of m ea su re m en t p he no ty pe am on g en tir e ger m plas m ac ce ss io ns an d th e in te rv al s to class if ied in to d if fer e n t c laas ses th at d en a te th e co n tin u o u s v ar iab les to n o m in al ize b ased o n Stu rg es ' r u le
30 Evaluation of the core collections
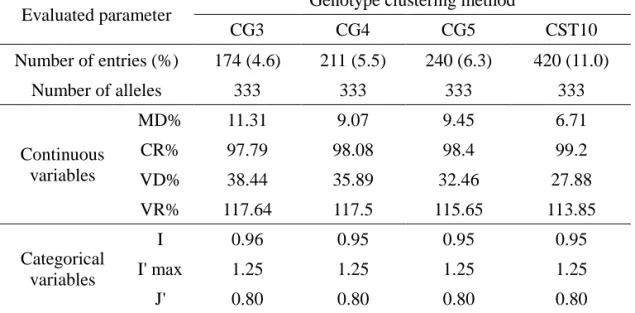
To evaluate each core collection, diverse statistical indicators were calculated for two types of variables, continuous and categorical variables. For continuous variables, the percentage of significant difference between core collections and the entire germplasm collection was calculated based on the mean difference (MD) percentage, the coincidence rate (CR) of range, the variance difference (VD) percentage, and variable rate (VR) of coefficient of variation. Among the candidate core sets selected from each different data set, a core set with MD less than 20% and CR more than 80% was considered as a representative collection. In addition, a lower value in VD and higher value in VR was considered to indicate a more effective core collection [32]. For categorical variables, the I and J’ values were calculated and compared between the five core collections and the entire germplasm collection. The maximum value of I (I max) is calculated based on the log of the number of classes used in the entire collection; the value for a core collection should be comparable to that of the entire collection [8].
Three additional markers having multiple alleles, COS643, COS111, and L4RP-3F, which were selected from the Sol Genomics Network [33] and Yang et al. [34], were used for validation of the core set. Melting curve patterns were identified by HRM analysis using a Rotor Gene 6000 (Qiagen, Valencia, CA, USA). Thermal cycling conditions were 10 min at 95°C, 50 cycles of 3-step amplification profile of 20 s at 94°C, 20 s at 55°C, and 40 s at 72°C, followed by final extension
31
60 s at 95°C and 60 s at 40°C. HRM analysis was performed increasing 0.1°C for every two seconds from 70°C to 90°C.
Finally, the core collection (CC240) with the highest genetic diversity and evenness was planted in 2014 in a research farm (Suwon, Korea) to monitor the variation of the diverse traits. Morphological data were obtained for the same accessions that were genotyped. Thirty-two different traits related to plant habit (9), leaf (4), flower (6), fruit (10), and seed (3) were analyzed. Phenotype data were presented as the mean ± SE. The differences between the mean values of individual clusters were assessed using one-way ANOVA and Duncan’s multiple range tests. P < 0.05 was considered to indicate a statistically significant difference. The IBM SPSS Statistics v23 software (IBM Corp., Armonk, NY, USA) was used for analysis.
32
RESULTS
Genetic diversity of the Capsicum germplasm
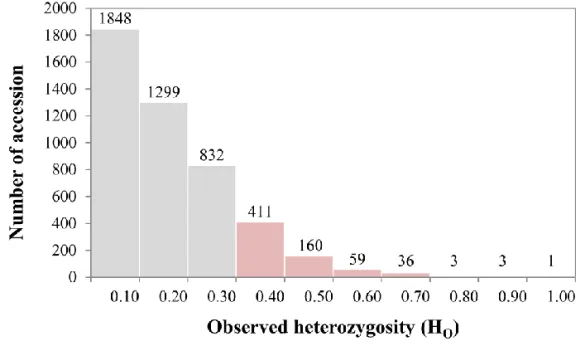
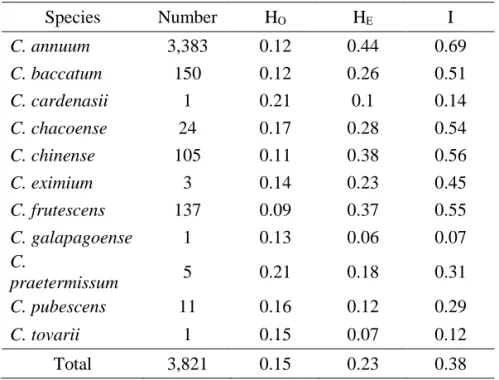
In our preliminary studies, a total of 4,652 non-redundant accessions from 11 species were screened using SNP markers to reveal the genetic diversity (Table
I-3). Based on the HO values, 673 accessions mostly from C. annuum with Ho value
more than 0.3 were considered as F1 hybrids (Figure I-1) and excluded from analysis. In addition, 158 accessions with more than seven missing genotype data points were also excluded. Ultimately, a total of 3,821 accessions were used for further experiments (Table I-4).
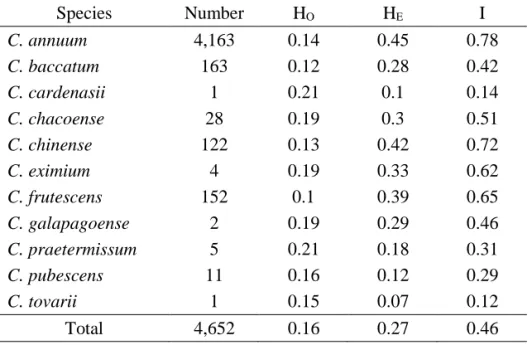
Using the SNP genotyping results, the HE, HO, and I were calculated for 3,821
pepper accessions (Table I-4). The HE values ranged from 0.10 to 0.44, and I values
ranged from 0.07 to a maximum of 0.69. The highest diversity values in C. annuum
accessions (HE=0.44, I=0.69) suggests that there is extensive genetic variation
within this species. With the exceptions of C. baccatum and C. pubescens, the other
domesticated species showed relatively high HE values, above 0.37. The HO value
of C. annuum was 0.12, whereas those of the other species varied from 0.09 to 0.21. Four domesticated species C. annuum, C. baccatum, C. chinense, and C. frutescens
and three wild species C. chacoense, and C. eximium had lower values for HO
compared to HE, (Table I-4) whereas C. cardenasii, C. galapagoense, C.
pratermissum, C. pubescens, and C. tovarii had relatively higher values of HO
33
inbreeding for a long time which could be attributed to the interplay of many
factors such as artificial selection, non-random mating between individuals,
population structure and size, and Wahlund effect (mixing of individuals from
different genetic sources) [35,36]. By contrast, accessions of the latter five species
were collected in different isolated locations where each accession had evolved
34
Table I-3. Genetic diversity analysis of the 4,652 pepper accessions
Species Number HO HE I C. annuum 4,163 0.14 0.45 0.78 C. baccatum 163 0.12 0.28 0.42 C. cardenasii 1 0.21 0.1 0.14 C. chacoense 28 0.19 0.3 0.51 C. chinense 122 0.13 0.42 0.72 C. eximium 4 0.19 0.33 0.62 C. frutescens 152 0.1 0.39 0.65 C. galapagoense 2 0.19 0.29 0.46 C. praetermissum 5 0.21 0.18 0.31 C. pubescens 11 0.16 0.12 0.29 C. tovarii 1 0.15 0.07 0.12 Total 4,652 0.16 0.27 0.46
HO: observed heterozygosity, HE: expected heterozygosity, I: Shannon's information index of
35
Figure I-1. Distribution of 4,652 Capsicum germplasm accessions based on HO
(observed heterozygosity). Accessions with an HO value of more than 0.3 were considered
as F1 hybrids. A total of 673 accessions were excluded from the fundamental germplasm collection to construct a core collection.
36
Table I-4. Genetic diversity analysis of the 3,821 pepper accessions
Species Number HO HE I C. annuum 3,383 0.12 0.44 0.69 C. baccatum 150 0.12 0.26 0.51 C. cardenasii 1 0.21 0.1 0.14 C. chacoense 24 0.17 0.28 0.54 C. chinense 105 0.11 0.38 0.56 C. eximium 3 0.14 0.23 0.45 C. frutescens 137 0.09 0.37 0.55 C. galapagoense 1 0.13 0.06 0.07 C. praetermissum 5 0.21 0.18 0.31 C. pubescens 11 0.16 0.12 0.29 C. tovarii 1 0.15 0.07 0.12 Total 3,821 0.15 0.23 0.38
HO: observed heterozygosity, HE: expected heterozygosity,
37
Population structure of the germplasm collection
The SNP genotyping results were used to perform population structure analysis for the 3,821 accessions under an admixed model using the STRUCTURE program [23]. Estimated likelihood (LnP (D)) was found to be greatest when K=10, suggesting that the population used in this study can be divided into ten clusters (Figure I-2). The clusters 3, 8, 9, and 10 were rather well separated from others whereas the cluster 1, 2, 4, 5, 6, and 7 were admixtures. Each of the 10 clusters included different numbers of accessions, ranging from 85 to 806 (Table I-5). The
average distance (HE) between individuals in each cluster was 0.30. The highest HE
value of 0.43 was observed in clusters 1 and 5, indicating greater genetic diversity
within these clusters, whereas cluster 9 showed the lowest HE value of 0.11. Genetic
differentiation (FST) values varied from 0.30 to 0.80 with an average of 0.54. The
smallest FST value (0.3) was observed in cluster 5, whereas cluster 9 had the highest
FST value (0.80), indicating that accessions in this cluster have several different
genotype patterns.
Most of the C. annuum accessions were found in clusters 1, 2, 3, 6, and 7. C.
chinense was mostly distributed in clusters 8 and 9, whereas C. frutescens was
mostly found in clusters 4, 9, and 10. By contrast, C. baccatum was distributed in clusters 8, 9, and 10. C. pubescens was placed in cluster 10. Wild species C.
chacoense, C. cardenasii, C. eximium, C. praetermissum, and C. tovarii were
38
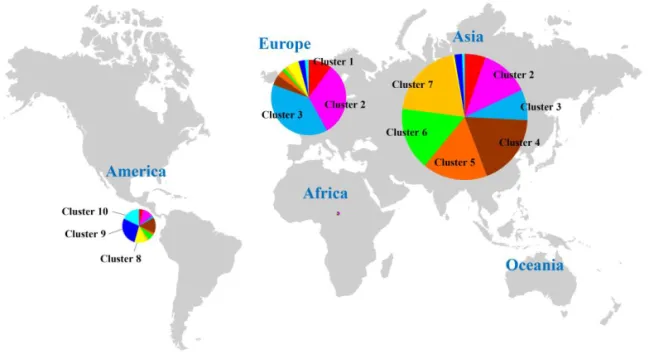
not fully distinct, the ten clusters were roughly separated according to geographic distribution. Clusters 1 to 3 were composed of an admixture of accessions from East Europe countries (Figure I-3). Cluster 4 and clusters 5 to 7 were mostly composed of collections from East Asia. Interestingly, the Korean landraces belonged to clusters 6 and 7. The accessions of clusters 8 to 10 were mostly from South America.
39
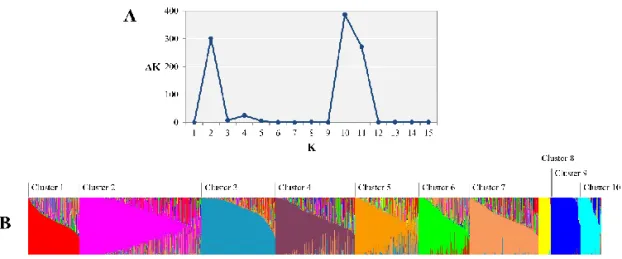
Figure I-2. Population structure of the Capsicum germplasm collection. A: ΔK reached its maximum value when K=10 following the ad-hoc method. B: Ten subpopulations inferred by STRUCTURE are represented by different colors.
40
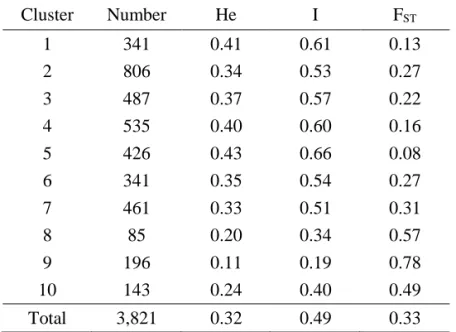
Table I-5. Diversity-related summary statistics for all clusters inferred by STRUCTURE analysis Cluster Number He I FST 1 341 0.41 0.61 0.13 2 806 0.34 0.53 0.27 3 487 0.37 0.57 0.22 4 535 0.40 0.60 0.16 5 426 0.43 0.66 0.08 6 341 0.35 0.54 0.27 7 461 0.33 0.51 0.31 8 85 0.20 0.34 0.57 9 196 0.11 0.19 0.78 10 143 0.24 0.40 0.49 Total 3,821 0.32 0.49 0.33
HE: expected heterozygosity; I: Shannon’s information index of diversity,
41 T able I -6. D is tri b ut ion o f C apsi cu m spe ci es in ST R U C T U R E cl ust er s w it hin 3, 821 ger m pla sm ac ce ssi on s acc ordi n g to spec ie s G ro u p Clu ste r C . annuum C . bac catum C . car de nas ii C . chac oe ns e C . chinens e C . ex imium C . fr utes ce ns C . galapagoens e C . pr ae ter mis sum C . pube sc ens C . tovar ii 1 1 337 1 1 2 2 788 4 1 7 6 3 483 2 2 4 499 5 8 23 2 5 413 1 5 6 1 6 337 1 3 7 448 1 2 2 8 3 8 5 24 44 1 11 9 42 66 1 31 55 1 10 31 48 1 19 5 2 21 4 11 1 T ot al 3383 150 1 24 105 3 137 1 5 11 1
42
Figure I-3. Distribution of 3,821 germplasm accessions in population structure clusters according to their origin and geographic location. The colors of pie graph
correspond to the clusters from STRUCTURE analysis as in Figure I-2. The area of each pie graph indicates the proportion of included accessions.
43
Molecular phylogenetic analysis of the germplasm collection
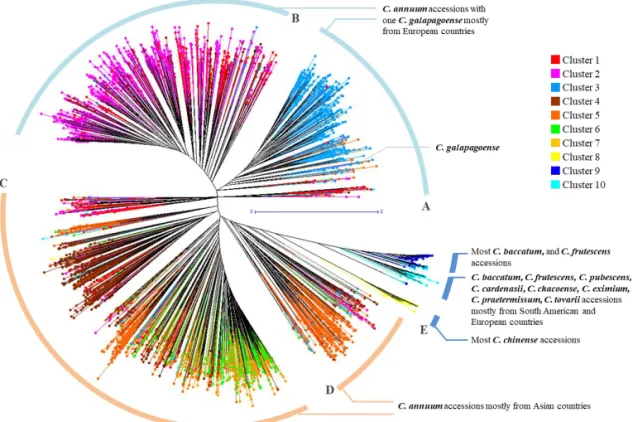
Using the genotyping data, an unrooted phylogenetic tree of the 3,821 pepper accessions was generated using the unweighted neighbor joining method based on genetic dissimilarity calculated with the Manhattan index. The tree showed five large clades (A-E) in which accessions of C. annuum were grouped separately from the other species (Figure I-4). The C. annuum accessions were found in four large clades. C. annuum accessions collected (or originated) in European countries were distributed among upper branches including the clades A and B. C. annuum accessions from Asian countries were distributed among lower branches (clades C and D). The accessions belonging to other species were clustered together in clade E. Within clade E, most of C. chinense accessions were clearly distinguished from those of other species and were placed next to clade D. When the unrooted phylogenetic tree was compared with the clusters obtained from the STRUCTURE analysis, the phylogenic tree matched well with the cluster separation in the STRUCTURE analysis. Accessions in cluster 3 belonged to clade A, accessions in clusters 1 and 2 to clade B, and accessions in clusters 4 to 7 to clade C; some of the accessions in cluster 5 and admixtures belonged to clade D and the accessions in clusters 8 to 10 were in clade E (Figure I-2, 4). The unrooted phylogenetic tree more clearly differentiated groups according to their geographic origin.
44
Figure I-4. Unrooted phylogenetic tree of the Capsicum germplasm. The dendrogram
was produced using the unweighted neighbor-joining method based on genetic dissimilarity among the 3,821 germplasm accessions. The colors of branches indicate accessions corresponding to the clusters (cluster 1 to 10) from population structure analysis as in Figure I-2. Five clades (A-E) were distinguished by distance between branches; A and B included C. annuum species mostly from Europe; C and D included C. annuum species mostly from Asia; E comprised other Capsicum species except C. annuum. A to E were used for a clustering range to select entries to construct the core collection.
45
Optimization of core set selection methods and construction of the core collection
To determine the best possible method for selection of a core collection, five different sampling strategies were tested (Table I-7). The first three methods were carried out using the entire collection without considering clustering analysis. These methods included selection of core entries based on SNP genotype data only (Gcc), phenotype data only (Pcc), or the combination of genotype and phenotype data (G+Pcc). In the other two methods, core entries were selected from each cluster of the unrooted phylogenetic tree. In these methods, after analysis of the entire collection, core entries in each cluster were selected based on genotype data only (Ggcc), or the combination of genotype and phenotype data (Gg+Pcc).
When only genotype data were used, 7 and 53 core entries were selected for Gcc and Ggcc, respectively. Ggcc showed a MD of less than 20%, which is close to the mean value of the entire collection, whereas Gcc showed a MD of more than 20%, poorly representing the entire collection. Both of them showed a CR of less than 80%, demonstrating insufficient coverage of the phenotype variation of the whole collection. However, Ggcc exhibited a smaller percentage of VD and larger percentage of VR, which indicated that selection of a core set after clustering analysis (Ggcc) better represented the whole collection. Furthermore, the comparison of categorical variables including 48 SNPs markers and 15 qualitative traits produced a higher value in I for Ggcc (0.91) than for Gcc (0.88), but a similar
46
value in J’ for Ggcc (0.79) and Gcc (0.77). Therefore, selecting the core entries after clustering analysis is more effective to represent the whole collection in terms of both phenotype and genotype data even using same number of alleles.
Since the core sets selected using only genotype data could not represent the diversity of the entire collection presumably due to limitations of number of SNP markers used, the available phenotype data for 32 traits were included for selection of core sets. Each trait included 3 to 12 phenotype classes providing at least 264 variations (Table I-2). A total of 76 entries were selected based on only phenotype data (Pcc) and produced 15.85% in MD, 96.99% in CR, 0.94 in I and 0.78 in J’, which reflects slightly better representation of the entire collection than that of Gcc. When both genotype and phenotype data were used (G+Pcc), the same number of entries (76), but slightly better representation of the entire collection was achieved compared to that with Pcc. As we found that selection of a core set after clustering analysis more effectively represented the entire collection, the final core collection was built using a combination of genotype and phenotype data after cluster analysis (Gg+Pcc). A total of 240 accessions representing six species, C. annuum (176), C.
baccatum (21), C. chinense (22), C. eximium (2), C. frutescens (18), and C. praetermissum (1) were ultimately selected as a core collection (CC240). Compared
with the entire germplasm collection, CC240 showed 9.45% in MD and 98.40% in CR, which provided good coverage of most of the range of continuous phenotypes in the entire collection. Furthermore, CC240 showed the lowest MD and the highest
47
CR of all tested core collections. In addition, the values of I and J’ were 0.95 and 0.80, respectively, which represents increased genetic diversity compared to the entire germplasm collection.
To validate and confirm the distribution of core entries, core collections selected from five methods PCA was performed. The distribution of the entire germplasm collection and core collection entries on the basis of genotyping was explained by the first two principal components, where the first and second axes explained 8.13% and 6.19% of the total variation among the accessions, respectively, and showed clear separation of C. annuum from other species. PCA analysis based on phenotyping included 589 accessions with no more than 10% of missing data points, whereas 2,006 accessions were plotted in the genotype plus phenotype background with no more than 20% missing data to reach the least condition of unit pairing. In contrast to the phenotype (21.87%, 11.44%), the genotype (8.13%, 6.19%) and genotype plus phenotype (6.44%, 4.91%) revealed lower variation in each axis (Figure I-5). Overall, regardless of the selection method, PCA analysis showed that core entries were distributed evenly without obvious grouping, covering the variation of the entire germplasm collection.