Heat Transfer Experiment with Supercritical CO
2Flowing Upward in a Circular Tube
Hyungrae Kim, Hwan Yeol Kim, Jin Ho Song, Hee Dong Kim, Yoon Yeong BaeKorea Atomic Energy Research Institute, 150 Deokjin, Yuseong, Daejeon
[email protected], [email protected], [email protected], [email protected], [email protected]
1. Introduction
SCWR (SuperCritical Water-cooled Reactor) is one of the six reactor candidates selected in the Gen-IV project, which aims at the development of new reactors with enhanced economy and safety[1]. Heat transfer experiments under supercritical conditions are required in relevant geometries for the proper prediction of thermo-hydraulic phenomena in a reactor core. A heat transfer test loop, named as SPHINX (Supercritical
Pressure Heat Transfer Investigation for NeXt
generation), has been constructed in KAERI[2]. The loop uses carbon dioxide as a surrogate fluid for water since the critical pressure and temperature of CO2 are much lower those of water.
As a first stage of heat transfer experiments, a single tube test is being performed in the test loop. Controlled parameters for the tests are operating pressure, mass flux, and heat flux. Wall temperatures are measured along the tube. Experimental data are compared with existing correlations.
2. Description of the Test 2.1 Test Loop and Test Section
Test facility is designed so that the heat transfer characteristics of supercritical CO2 are investigated with varying heat and mass fluxes at a given pressure.
The critical point of CO2 is 7.38 MPa and 30.98 oC. For
the details of the facility, refer to the previous publication [2].
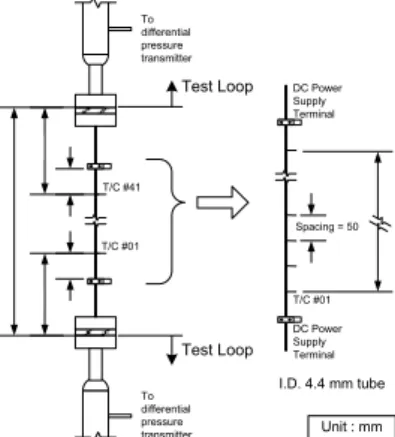
Fig.1 shows the installed test section and the locations of measuring points. The test section is a circular tube with an inside diameter of 4.4 mm and heated by a direct current power supply to impose a uniform heat flux on the tube surface. 41 K-type thermocouples, each apart by 5 cm, are soldered on the external surface of the tube to measure the wall temperatures. The supercritical CO2 flows upward inside the test section and the fluid temperatures are measured in the mixing chambers at the inlet and outlet of the test section.
2.2 Test Conditions
Tests are conducted with the change of mass flux and heat flux at a given pressure. In order to investigate the effect of pressure on the heat transfer, the experiments are performed at three different pressures : 1.05, 1.1 and 1.2 times the critical pressure. The inlet
temperature of the test section is kept at 27 oC and the
outlet temperature of the test section is restricted below
100 oC for safety. For each test, heat flux at given mass
flux and pressure is selected so that the fluid crosses the pseudo-critical point inside the test section for the investigation of hest transfer deteriorations. Table 1 shows the range of test conditions.
Table 1. Range of the test conditions
Condition Unit Value
Inlet pressure MPa 7.75, 8.12, 8.85
(1.05, 1.1, 1.2 Pcr respectively)
Inlet temperature oC 27
Mass flux kg/m2 sec 400, 500, 750, 1000, 1200
Heat flux kW/m2 Up to 150
3. Results 3.1 Heat Transfer Coefficient
Fig. 2 shows the surface temperature and the heat transfer coefficient with the change of mass flux and heat flux in case the inlet pressure of the test section is 7.75 MPa which is 1.05 times the critical pressure of CO2.
The Dittus-Boelter correlation[3] predicts the heat transfer coefficient well in the temperature range far from the pseudo-critical temperature since the fluid has the characteristics of single phase. But, it is shown that the Dittus-Boelter correlation overestimates the heat transfer coefficient near the pseudo-critical temperatures.
Heat transfer deterioration is mainly observed at the mass flux of 400 and 500 kg/m2 sec. and faintly observed at the mass flux of 750 kg/m2 sec. The peak surface temperature of tube becomes larger when the mass flux is lower.
T/C #01 T/C #41 To differential pressure transmitter To differential pressure transmitter I.D. 4.4 mm tube DC Power Supply Terminal DC Power Supply Terminal T/C #01 Spacing = 50 Test Loop Test Loop Unit : mm
Figure 1. The test section and measuring locations Transactions of the Korean Nuclear Society Autumn Meeting
3.2 Comparison with existing correlations
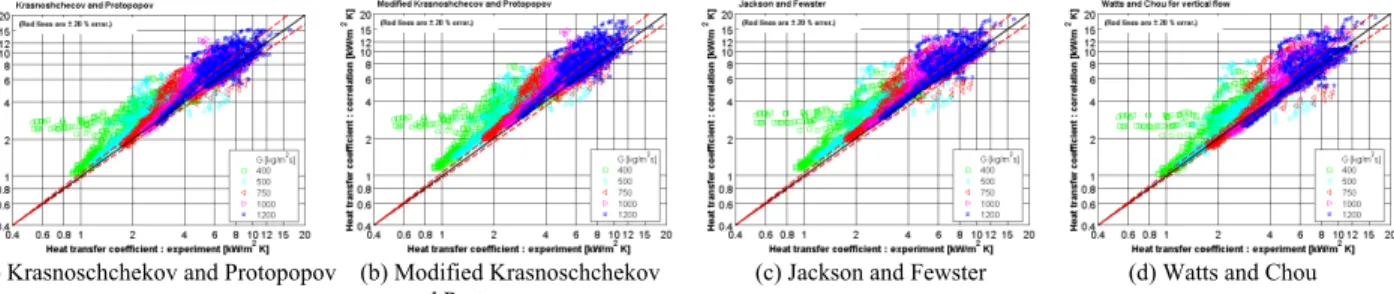
The measured value is compared with 4 correlations for supercritical water - Kransnoshchekov and Protopopov [4], Modified Kransnoshchekov and Protopopov [4], Jackson and Fewster [4], and Watts and Chou [5].
Fig. 3 shows that the data obtained in the tests deviate a lot from the correlated ones and heavily scattered. The large prediction error may come from the uncertainty in estimating bulk fluid enthalpy near the pseudo-critical temperature or from the difference of the working fluid. Near the pseudo-critical temperature, the error in heating power estimation and consequently in heat flux may be as large as 50 %. The plots also give indirect comparison with another supercritical heat transfer test at Kyushu University using Freon(R-22) [6]. They compared their test data with the above 4 correlations and showed a more conforming result.
3. Conclusion
The heat transfer test is performed for a vertical upward flow of supercritical CO2 in a circular tube. The heat transfer deterioration is observed at low mass flux and high heat flux. The data are compared with the correlated ones. The measured value deviates from the
correlations about 20 % in average. Drastic change of specific heat capacity near the pseudo-critical temperature may result in the large discrepancy. Supplementary test is being executed to reduce the uncertainty in the data.
REFERENCES
[1] H.Y. Kim, State of the Art on the Heat Transfer Experiments under Supercritical Pressure Condition, KAERI, AR-681, 2003.
[2] H. Kim, H.Y. Kim, J.H. Song, H.D. Kim, Y.Y. Bae, “Design and Progress of the SPHINX in KAERI”, Trans. KNS Spring Meeting, Jeju, Korea, May 26-27, 2005.
[3] F.P. Incropera and D.P. De Witt, Introduction to Heat Transfer, 2nd Ed., p.456, John Wiley & Sons, 1990.
[4] I.L. Pioro and R.B. Duffey, Literature Survey of Heat Transfer and Hydraulic Resistance of Water, Carbon Dioxide, Helium and Other Fluids at Supercritical and Near-Critical Pressures, AECL-12137, FFC-FCT-409, pp.103- 111. [5] M. J. Watts and C. T. Chou, “Mixed Convection Heat Transfer to Supercritical Pressure Water,” Proc. 7th Int. Heat Transfer Conf. Müchen, Vol.3, 1982, pp.495-500.
[6] T. Yamashita, S. Yoshida, H. Mori, M. Ohno, H. Komita, and K. Nishida, "Heat Transfer to a Supercritical Pressure Fluid Flowing Upward in a Vertical Tube of Small Diameter," TED-AJ03-415, The 6th ASME-JSME Thermal Engineering Joint Conference, March 16-20, 2003.
20 40 60 80 100 120 140 160 W al l Te mpe rat ur e [ oC] 250 300 350 400 450 500 550 0 5 10 15
Bulk Fluid Enthalpy [kJ/kg]
H ea t T ran sf er C o ef fi ec ie n t [ k W /m 2K] pin = 7.75 MPa, G = 400 kg/m 2 sec, q" in [kW/m2K] Tpc = 33.2 oC, h pc = 339.2 kJ/kg q" 10 20 30 40 50 55 60 20 40 60 80 100 120 140 160 W al l Te mp er a tur e [ oC] 250 300 350 400 450 500 550 0 5 10 15
Bulk Fluid Enthalpy [kJ/kg]
H e at Tr an sf e r C o ef fi e ci en t [ k W /m 2K] pin = 7.75 MPa, G = 500 kg/m2 sec, q" in [kW/m2K] Tpc = 33.2 oC, h pc = 339.2 kJ/kg q" 20 30 50 60 70 20 40 60 80 100 120 140 160 W al l Te mper a tu re [ oC] 250 300 350 400 450 500 550 0 5 10 15
Bulk Fluid Enthalpy [kJ/kg]
H e at T rans fer C o ef fi ec ie nt [ k W/ m 2K] pin = 7.75 MPa, G = 750 kg/m2 sec, q" in [kW/m2K] Tpc = 33.2 oC, hpc = 339.2 kJ/kg q" 30 50 70 90 100 20 40 60 80 100 120 140 160 Wa ll Tem p er a tu re [ oC] 2500 300 350 400 450 500 550 5 10 15
Bulk Fluid Enthalpy [kJ/kg]
H eat Tr an sf er C o ef fi ec ie n t [ kW /m 2K] pin = 7.75 MPa, G = 1200 kg/m 2 sec, q" in [kW/m2K] Tpc = 33.2 oC, h pc = 339.2 kJ/kg q" 30 50 70 90 110 130 140 150
(a) Mass flux = 400 kg/m2s (b) Mass flux = 500 kg/m2s (c) Mass flux = 750 kg/m2s (d) Mass flux = 1200 kg/m2s Figure 2. Wall temperature and heat transfer coefficient measured at 7.75 MPa. (solid black line : the bulk temperature of CO2 and the heat transfer coefficient obtained by the Dittus-Boelter [2] correlation, solid blue line : the pseudo-critical temperature and the specific enthalpy)
(a) Krasnoschchekov and Protopopov (b) Modified Krasnoschchekov (c) Jackson and Fewster (d) Watts and Chou and Protopopov
Figure 3. Comparison of heat transfer coefficient from the experiment with that from the published correlations. (red line is ±20 % error bound)