CFD Analysis for a Natural Convection in the Annulus Gap under Post-Blowdown
Hyung Seok Kang, Bo Wook Rhee, Joo Hwan ParkKAERI, P.O Box 105, Yuseong, Taejon, Korea, 305-600, [email protected]
1. INTRODUCTION
A CFD benchmark calculation for a post-blowdown test of the CANDU 28-element fuel bundle has been performed to develop the CFD analysis methodology[1] and support the verification work of the CATHENA code for the post-blowdown event[2]. The comparison of the CFD results with the test data showed that the temperature difference of about 40 oC at the PT(Pressure Tube) was found, where the CFD result is higher than that of test[1]. This difference may be caused by the fact that the CFD analysis could not exactly calculate the fraction of the radiation and the convection heat transfer between the PT and the CT (Calandria Tube). The larger heat transfer by the radiation may give the higher temperature distribution at the PT because the radiation heat transfer is generally proportional to a fourth of the temperature. To understand the heat transfer phenomena and find a more accurate fraction of both the radiation and the convection heat transfer inside the annulus gap, we investigated the previous experimental correlation of a natural circulation in the concentric horizontal cylinder[3] based on the test data and perform a separate CFD calculation for the annulus gap and compared it with the estimation results by the correlation.
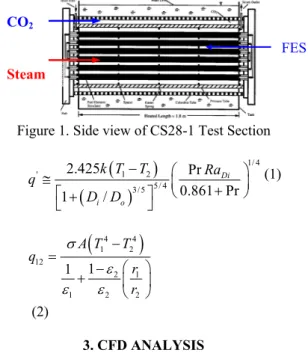
2. NATURAL CONVECTION IN THE TEST [1] The post-blowdown test facility consists of a test section of a 28-element fuel bundle (Fig.1) including the CT, a cooling water tank, etc. A 10 kW power was supplied to the heater inside the FES (Fuel Element Simulator). A CO2 gas flows with 0.19 g/s through the annulus gap between the PT and the CT. The temperature at the inner surface of the CT is almost maintained at about 41 oC because the test section is submerged into the tank water of 40 oC. The PT absorbs the 70~80 % of heat from the FES by a radiation heat transfer [4]. Therefore, a natural circulation may be developed by the large temperature difference between the PT and the CT even though the gap thickness is very small. And the amount of the natural convection heat transfer plays an important role in determining the temperature of the PT. A previous study [3] showed that the heat transfer by a natural circulation in the annulus gap could be estimated by Eq.(1). The calculated value based on the test data is about 1.5kW. The forced convection heat transfer by CO2 gas is close to zero due to a very low mass flow rate through the annulus gap. The radiation heat transfer between the PT and the CT can also be evaluated by Eq.(2), which is valid for an infinite cylinder, using the
test data[4]. The calculated value with T1 of 510oC and T2 of 41oC is estimated to be about 4.8kW. The whole heat transfer is about 6.3kW and the portions of the radiation and the natural convection based on the correlation are about 76.2% and 23.8%, respectively.
Figure 1. Side view of CS28-1 Test Section
(
)
(
)
1/ 4 1 2 ' 5/ 4 3/ 5 2.425 Pr 0.861 Pr 1 / Di i o k T T Ra q D D − ⎛ ⎞ ≅ ⎜ ⎟ + ⎝ ⎠ ⎡ + ⎤ ⎣ ⎦ (1)(
4 4)
1 2 12 2 1 1 2 2 1 1 A T T q r r σ ε ε ε − = ⎛ ⎞ − + ⎜ ⎟ ⎝ ⎠ (2) 3. CFD ANALYSISThe purpose of the CFD analysis is to investigate the heat transfer phenomena between the PT and the CT and the temperature distribution of the PT when a natural convection of the CO2 develops in the gap. The CFX5.7 using the coupled solver algorithm was used for this calculation.
3.1 Grid Model and Boundary Conditions
A full grid model simulating from the PT to the CT in the test section is generated with 378,000 cells. The cooling water tank, of which the bulk temperature is 40 oC, is considered as the boundary condition on the outside surface of the CT. The emissivity values on the outside surface of the PT(ε1) and the inside surface of the CT(ε2) are 0.8 and 0.34 respectively, which are referenced in the input of CATHENA[2]. This emissivity value is the most important value to determine the heat flux in the Eq. (2). The wall boundary condition of the heat flux of 7kW is applied to the inner surface of the PT. The reasons for adopting this value are that the exact heat flux value was not indicated at the inner surface of the PT based on the
CO2
Steam
FES
Transactions of the Korean Nuclear Society Autumn Meeting Busan, Korea, October 27-28, 2005
test data. And we want to qualitatively know the whole heat transfer phenomena including the CO2 natural convection.
3.2 Flow Field Model and Heat Transfer Model
The fluid flow and heat transfer phenomena in the gap region are considered as a compressible laminar flow, a natural convection with the Boussinesq approximation and a radiation heat transfer. The governing equations used in this calculation are the Navier-Stokes and the energy equation with a coupled solver algorithm. The discrete transfer model is used for the radiation heat transfer calculation.
3.3 Discussion on the CFD Results
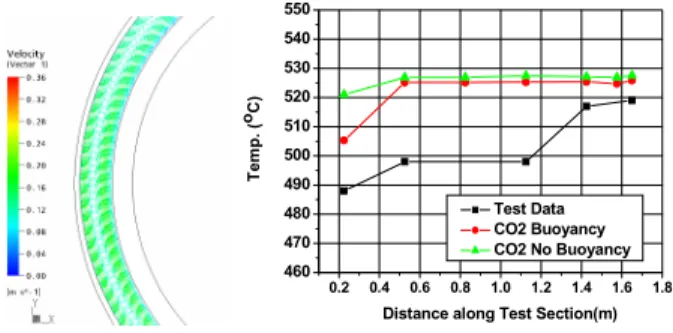
The temperature distributions for the two cases simulating the PT are shown in the Fig. 2, where the CFD calculation uses a buoyancy model for the CO2 natural convection and only uses the convection heat transfer model. In the case of using the buoyancy model, the temperature distribution of the PT (Fig. 2, (a)) is varied from 535 oC to 515 oC by changing the locations from the top to the bottom. It means that the CO2 circulation (Fig. 2, (c)) due to the temperature difference develops in the narrow annulus gap, and it affects the temperature of the PT. When the buoyancy model is not applied, however, the temperature of the PT is almost the same value of about 525 oC in every region. The fractions of the radiation and the convection heat transfer at the inner surface of the CT are about 58% and 42%, respectively. The calculated fraction by a natural convection is about two times larger than the estimated value by the correlation based on the test data. A detailed analysis is required to find the causes for this difference. The comparison of the CFD results with the test data is shown in Fig. 2(c) for the temperature of the PT along the axial distance of the test section. The CFD results with the buoyancy model of CO2 shows about 25 oC higher than those of test data, while its model predicts well the trend of the temperature along the test section.
0.2 0.4 0.6 0.8 1.0 1.2 1.4 1.6 1.8 460 470 480 490 500 510 520 530 540 550 Te m p . ( oC)
Distance along Test Section(m) Test Data CO2 Buoyancy CO2 No Buoyancy
Figure 2. Comparison of Test Data and CFD Results 4. CONCLUSION AND FURTHER STUDY The results of the CFD calculation for the CO2 natural convection in the annulus gap in the test of the post-blowdown do not agreed well with the prediction by the correlation based on the test data contained in both the heat transfer modes. However, the CFD calculation shows that the CO2 natural convection may vary the temperature of the PT from the top to the bottom, and this variation makes the trend of the PT temperature, especially for the entrance region where the temperature of the bottom region is only measured, more close to the test data. Therefore, it is noted that the CO2 natural convection should be considered in the CFD benchmark calculation for the post-blowdown event.
ACKNOWLEDGMENTS
This work was financially supported for the nuclear R&D program from the Ministry of Science and Technology of Korea. The authors are sincerely grateful for the financial support.
REFERENCE
[1] H. S. Kang, B. W. Rhee and B-J Min, “CFD Analysis
for the Experiment of a Single Channel Post-blowdown”,
Proceeding of the ’05 KNS Spring Conf., Yongpyong,
Korea, 2004.
[2] B. W. Rhee, H. S. Kang and B-J Min, “Improvement of Post-blowdown Fuel Channel Analysis Model of CANDU for 35% RIH Breaj LOCA without ECC”, Proceeding of
the ICAPP’04 Conf., Pittsburg, USA, 2004.
[3] G. D. Raithby and K. G. T. Hollands, “A General Method of Obtaining Approximation Solutions to Laminar and Turbulent Free Convection Problem”, Adv.
Heat Transfer, Vol. 11, pp. 265-315, 1975.
[4] Q. M. Lei, D. B. Sanderson, K. A. Haugen and H. E. Rosinger, Post-Test Analysis of the 28-Element High-Temperature Thermal-Chemical Experiment CS28-1,
Proceedings of ICSM in Nuclear Engineering,
Montreal, Canada, 1993. No CO2
Buoyancy CO2
Buoyancy
(a) PT temperature contour