The Role of Bcl-xL and EGFR
in Malignant Progression of
Neurofibromatosis type1
by
Su-Jin Lee
Major in Molecular Medicine
Department of Biomedical Sciences
The Graduate School, Ajou University
The Role of Bcl-xL and EGFR
in Malignant Progression of
Neurofibromatosis type1
by
Su-Jin Lee
A Dissertation Submitted to The Graduate School of
Ajou University in Partial Fulfillment of the Requirements
for the Degree of Ph.D.
of Biomedical Sciences
Supervised by
Seon-Yong Jeong, Ph.D.
Major in Molecular Medicine
Department of Biomedical Sciences
The Graduate School, Ajou University
This certifies that the dissertation of
Su-Jin Lee is approved.
SUPERVISORY COMMITTEE
Yoon-Sok Chung
Seon-Yong Jeong
Young-Ju Jang
Kyongmin Kim
Jung Min Ko
The Graduate School, Ajou University
December, 14th, 2012
- ABSTRACT -
The Role of Bcl-xL and EGFR in the Malignant Progression
of Neurofibromatosis type 1
Neurofibromatosis Type 1 (NF1) is one of the most commonly inherited autosomal dominant human genetic disorders, with an incidence of approximately 1 in 3000~3500 individuals worldwide. NF1 is caused by loss-of-function mutations in the NF1 gene encoding neurofibromin, a GTPase-activating protein that regulates the small GTPase Ras signaling pathway by converting the active GTP-Ras to an inactive GDP-Ras. The transformation of benign plexiform neurofibromas (PNs) to malignant peripheral nerve sheet tumors (MPNSTs) in patients with NF1 is notable and is of far greater concern because MPNSTs are a type of aggressive sarcoma and are a major cause of mortality in patients with NF1. Yet the pathogenesis is poorly understood. In addition to the NF1 mutation, it has been suggested that other genetic or epigenetic changes may participate in the malignant change of benign tumor tissues to MPNSTs. Despite robust histological and molecular analyses that have been conducted to compare PNs and MPNSTs, the exact molecular pathogenesis of the malignant transformation in NF1 patients has not yet been elucidated. Long-term investigations using a multi-model therapeutic strategy revealed that there are still many hurdles to overcome in chemotherapy for the NF1-associated MPNSTs.
In this study, I aimed to clarify the molecular mechanisms of NF1’s malignant progression, which may lead to finding new target molecules and/or drugs for improved chemotherapeutic approaches that treat NF1-associated MPNSTs effectively.
Since hyperexpression of epidermal growth factor receptor (EGFR) in Schwann cells (SCs) is frequently observed in NF1-associated MPNST tissues, I first examined whether the basal EGFR expression levels were different between SCs derived from normal tissues or MPNSTs. By performing a comparison analysis between normal and MPNST SCs, I found that EGFR expression levels were significantly higher in the MPNST SCs. Interestingly, I found that the expression level of the EGFR protein was inversely related to the expression level of neurofibromin in all the SCs tested, suggesting that upregulated EGFR in the NF1-associated MPNSTs may be caused by neurofibromin deficiency. Manipulation of NF1 gene expression by RNA interference (RNAi) and overexpression demonstrated that neurofibromin plays a role in regulating the transcriptional expression of the EGFR. The results of site-specific chromatin immunoprecipitation (ChIP) targeting the phosphorylated Sp1 (pSp1)-binding site of the EGFR gene revealed that the knockdown of NF1 stimulated the binding of pSp1 to the EGFR gene. In addition, inhibition of extracellular signal-regulated kinase 1 and 2 (Erk1/2), a Ras downstream protein signal-regulated by neurofibromin and an upstream regulator of Sp1, resulted in a weak increase in the EGFR level in neurofibromin-depleted cells. These results demonstrated that neurofibromin regulates
EGFR expression by modulating the binding of the Sp1 transcription factor to the EGFR
gene promoter. The results also demonstrate that the Ras/Erk/Sp1-signaling pathway mediates the EGFR upregulation in NF1-deficient MPNST cells.
Crucially, I found that the antiapoptotic Bcl-xL protein was upregulated in MPNST cells and the increased Bcl-xL expression caused an increase in an MPNST cell’s resistance to anticancer drugs. These results suggest that the alteration of the Bcl-xL expression level by somatic expression changes in the NF1 locus may contribute to the development of MPNSTs in otherwise benign tumors. The manipulation of NF1 gene expression levels demonstrated that the decreased transcriptional expression of the NF1 gene, as in the neurofibromin-mediated EGFR expression, caused the high expression of Bcl-xL in MPNST cells. Because Bcl-xL is also one of the downstream proteins of the Ras/Erk/Sp1 pathway, I tested the effect of Erk1/2 in regulation of the neurofibromin-mediated Bcl-xL expression. Treatment with the Erk1/2 inhibitor PD98059 resulted in a weak increase in the Bcl-xL level in the neurofibromin-depleted cells, indicating that Erk1/2 activation caused the Bcl-xL upregulation in MPNST cells. In addition, knockdown of SP1 and NF1 genes demonstrated that the Ras/Erk/Sp1-signaling pathway mediated the Bcl-xL upregulation in the MPNST cells.
I unexpectedly found that Bcl-xL modulated neurofibromin levels in the opposite direction. The knockdown of Bcl-xL caused an increase in the neurofibromin level, whereas Bcl-xL overexpression resulted in a decreased neurofibromin level. I discovered that Bcl-xL regulates neurofibromin levels by modulating the ubiquitin-mediated proteolysis of neurofibromin. In particular, Bcl-xL negatively regulated the neurofibromin level by increasing the binding of ETEA, a ubiquitin-related protein, to neurofibromin. These results suggest that Bcl-xL plays a crucial role in the regulation of EGFR-mediated Ras signaling in a positive feedback manner by modulating cellular neurofibromin levels.
I further demonstrated that either the depletion of Bcl-xL expression by RNAi or the inactivation of Bcl-xL by ABT-737, a mimetic of the BH3-only protein BAD, was very effective in sensitizing the MPNST cells to apoptotic cell death when combined with the tested anticancer drug Doxorubicin. Because immunohistological staining results showed that both EGFR and Bcl-xL proteins were upregulated in MPNST tissues (when compared to that in PN tissues from patients with NF1), I tested the effect of the combined treatment of the EGFR inhibitor Erlotinib, the Bcl-xL inhibitor ABT-737, and the apoptosis inducer Doxorubicin in MPNST cells. A low concentration of Erlotinib, ABT-737, and Doxorubicin could effectively induce synergistic cytotoxicity in the MPNST cells with minimal side effects. These results suggest that pharmacological inhibition of both EGFR and Bcl-xL in combination with anticancer drug-inducing apoptosis may be a potential therapeutic strategy for the treatment of NF1-associated MPNSTs.
Collectively, the results suggest that an NF1 deficiency-mediated elevation in the Ras/Erk/Sp1-signaling pathway may cause the upregulation of EGFR and Bcl-xL in MPNST cells and may provide a new chemotherapeutic target in patients with NF1 and MPNSTs. Key words: Neurofibromatosis Type 1 (NF1), malignant peripheral nerve sheath tumor (MPNST), mailgnant progression, NF1, neurofibromin, EGFR, Bcl-xL, Ras, Erk1/2, Sp1, apoptosis, chemotherapy, Erlotinib, ABT-737, Doxorubicin
TABLE OF CONTENTS
ABSTRACT ··· i
TABLE OF CONTENTS ··· v
LIST OF FIGURES ··· viii
LIST OF TABLES ··· xi
I. INTRODUCTION ··· 1
II. MATERIALS AND METHODS ··· 12
1. Antibodies and reagents ··· 12
2. Patients tissue samples and primary culture ··· 12
3. Cell lines ··· 15
4. Hematoxylin and eosin staining ··· 15
5. Immunohistochemistry ··· 15
6. Cell viability assay ··· 16
7. Plasmids, small interfering RNAs (siRNAs) and transfection ··· 16
8. Real-time reverse transcription-polymerase chain reaction (RT-PCR) ··· 17
9. Chromatin immunoprecipitation (ChIP) assay ··· 18
10. Immunoprecipitation and immunoblotting ··· 19
11. Cytoplasmic and nuclear fractionation ··· 20
12. Ras activation assay ··· 20
13. Immunofluorescence cell staining ··· 21
1. The EGFR expression level was closely related to the neurofibromin expression level in both normal and MPNST cells ··· 22 2. Manipulation of NF1 gene expression caused alterations in the transcriptional
expression of the EGFR gene ··· 25 3. Neurofibromin-regulated EGFR expression occurred by modulating the binding of
the Sp1 transcription factor to the EGFR gene promoter ··· 28 4. Neurofibromin-regulated EGFR expression occurred by modulating the
Erk/Sp1-signaling pathway ··· 35 5. MPNST cells were more resistant than normal cells to anticancer drugs inducing
apoptosis ··· 37 6. The downregulation of NF1 expression reduced the apoptosis sensitivity to
Doxorubicin in normal cells ··· 39 7. The NF1 gene dose mediated the Bcl-xL expression level
in normal and MPNST cells ··· 41 8. The endogenous Bcl-xL was upregulated in MPNST cells ··· 44 9. The Bcl-xL expression level was closely related to the apoptosis sensitivity to
Doxorubicin in both normal and MPNST cells ··· 46 10. NF1 deficiency-induced Bcl-xL expression occurred by activating the Ras/Erk/Sp1
signaling pathway ··· 49 11. Both the phosphorylated EGFR and Bcl-xL were expressed more in MPNST than
in PN tissues form NF1 patients ··· 53 12. Bcl-xL regulated the neurofibromin expression level ··· 56
13. Bcl-xL regulated the ubiquitin-mediated proteolysis of neurofibromin
by modulating the ETEA binding to neurofibromin ··· 58
14. Bcl-xL negatively regulated neurofibromin by enhancing the ubiquitin-mediated proteolysis of neurofibromin in MPNST cells. ··· 62
15. Bcl-xL positively regulated EGFR by reducing the neurofibromin level ··· 64
16. The Bcl-xL inhibitor ABT-737 enhanced chemotherapeutic sensitivity to anticancer drugs in MPNST cells ··· 66
17. The combined treatment of Erlotinib, ABT-737, and Doxorubicin synergistically enhanced apoptotic cell death in NF1-deficient MPNST cells ··· 69
IV. DISCUSSION ··· 72
V. CONCLUSION ··· 83
REFERENCES ··· 84
LIST OF FIGURES
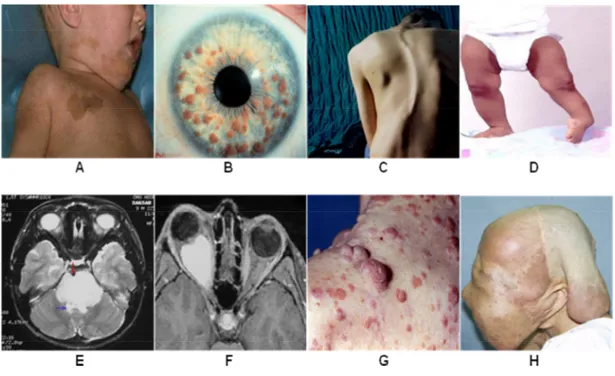
Fig. 1. The various clinical symptoms of neurofibromatosis type 1 ··· 7
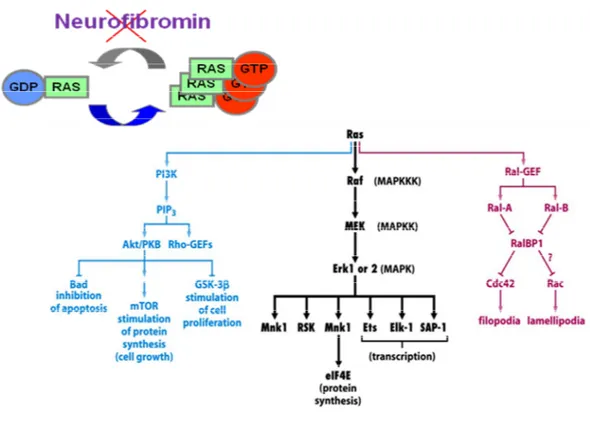
Fig. 2. Accumulation of activated GTP-Ras and the upregulation of the Ras signaling pathway in NF1 ··· 8
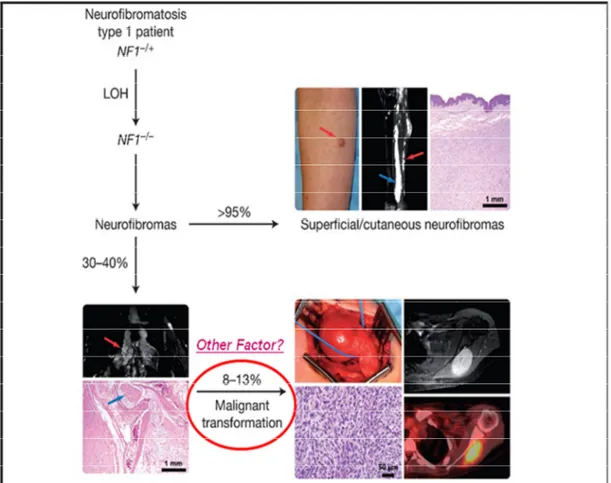
Fig. 3. Pathogenesis of the malignant peripheral nerve sheath tumor ··· 9
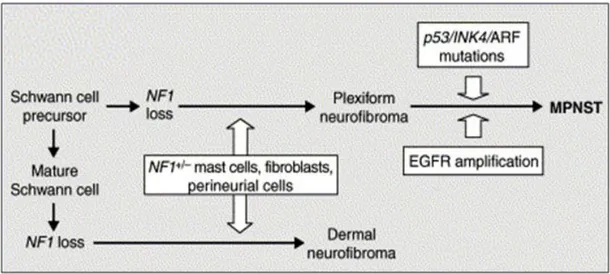
Fig. 4. Models of tumorigenesis and tumor development in NF1 ··· 10
Fig. 5. Model of EGFR-mediated tumorigenesis involving the Nf1-mutated peripheral nervous system progenitors ··· 11
Fig. 6. Characteristics of the NF1-associated primary tissue cultured cells ··· 14
Fig. 7. Upregulation of basal EGFR expression in NF1-associated MPNST cells ··· 24
Fig. 8. Correlation between the expression levels of the EGFR and neurofibromin ··· 26
Fig. 9. Increased transcriptional expression of the EGFR by the downregulation of NF1 expression ··· 27
Fig. 10. The Sp1-mediated expression regulation of the EGFR gene ··· 29
Fig. 11. Alterations in the total Sp1 and phosphorylated Sp1 levels in NF1-manipulated cells ··· 30
Fig. 12. Nuclear localization changes of the phosphorylated Sp1 in NF1-manipulated cells ··· 32
Fig. 13. Neurofibromin-regulated EGFR expression via modulating the binding of the Sp1 transcription factor to the EGFR gene promoter ··· 33
Fig. 14. Knockdown of NF1-induced EGFR expression by activating the Erk1/2 and Sp1 ··· 36 Fig. 15. Comparison of the chemosensitivity to anticancer drugs between normal cells
and MPNST cells ··· 38 Fig. 16. Decreased apoptosis sensitivity to Doxorubicin by the downregulation
of NF1 expression in normal cells ··· 40 Fig. 17. Increase of Bcl-xL expression at the mRNA level in normal cells
by knockdown of NF1 ··· 42 Fig. 18. Reduced Bcl-xL expression and enhanced apoptosis sensitivity to
Doxorubicin in MPNST sNF96.2 cells by NF1-GRD overexpression ··· 43 Fig. 19. Hyperexpression of Bcl-xL in MPNST cells ··· 45 Fig. 20. The Bcl-xL level-dependent alteration of apoptosis sensitivity to
Doxorubicin in normal and MPNST cells ··· 47 Fig. 21. NF1-dependent regulation of Bcl-xL expression via the
Ras/Erk/Sp1-mediated signaling pathway ··· 51 Fig. 22. Immunohistochemical staining (IHC) of phospho-EGFR and Bcl-xL in
the plexiform neurofibroma (benign) and malignant peripheral nerve
sheet tumor tissues from patients with NF1 ··· 54 Fig. 23. Bcl-xL-mediated alterations of the neurofibromin expression level ··· 57 Fig. 24. Bcl-xL-mediated proteolysis of neurofibromin by modulating
Fig. 25. Increased ubiquitination level of neurofibromin in MPNST cells that
overexpressed Bcl-xL ··· 63 Fig. 26. Bcl-xL-mediated positive regulation of the EGFR by modulating the
neurofibromin level ··· 65 Fig. 27. Synergetic effect of ABT-737 on cytotoxicity in MPNST cells in combination
with anticancer drugs ··· 67 Fig. 28. The synergistic effect of the combined treatment of Erlotinib, ABT-737,
LIST OF TABLES
I. INTRODUCTION
Neurofibromatosis Type 1 (NF1) is one of the most commonly inherited autosomal dominant human genetic disorder with an incidence of approximately 1 in 3000~3500 individuals worldwide (McClatchey, 2007; Savar and Cestari, 2008; Jett and Friedman, 2010). NF1 has been reported to be caused by de novo mutations in approximately 30-50% of patients (Savar and Cestari, 2008; Jett and Friedman, 2010). NF1 is characterized by extremely variable phenotypic features including multiple café-au-lait (CAL) spots, lisch nodules, scoliosis, tibial dysplasia, pontine glioma, optic glioma, cutaneous neurofibromas, and soft-tissue tumors and has a very poor prognosis (Savar and Cestari, 2008; Jett and Friedman, 2010) (Fig. 1). NF1 is caused by loss-of-function mutations in the NF1 gene encoding neurofibromin, a GTPase-activating protein (GAP) which is one of the major GAP proteins that regulates the small GTPase Ras signaling pathway by converting the active GTP-Ras to an inactive GDP-Ras (Dasgupta and Gutmann, 2003) (Fig. 2).
The majority of patients with NF1 develop benign dermal neurofibromas (DNs) and/or plexiform neurofibromas (PNs) (Grobmyer et al., 2008; Jett and Friedman, 2010). Neurofibromas are composed of a mixture of cell types including Schwann cells (SCs), fibroblast cells, mast cells, and perineural cells (Gottfried et al., 2006). SCs are believed to be the primary pathogenic cell source in neurofibromas (Carroll and Stonecypher, 2005). As complete loss of the NF1 gene has been identified exclusively in SCs of neurofibromas (Kluwe et al., 1999a; Rutkowski et al., 2000; Serra et al., 2000) and loss of NF1 in the SC lineage is sufficient to generate tumors in mice (Zhu et al., 2002), bi-allelic inactivation of
both NF1 alleles (NF1-/-) in SCs by germline NF1 mutation at one allele and additional
somatic loss of heterozygosity (LOH) at the remaining functional NF1 locus has been suggested to be a major cause of NF1 tumorigenesis. In addition, haploinsufficiency in other types of cells (NF1+/-) in neural crest-derived tissues, including fibroblast cells, mast cells,
and perineurial cells also plays an important role in the pathoetiology of NF1 (Gottfried et al., 2006; Staser et al., 2010; Jouhilahti et al., 2011).
Malignant peripheral nerve sheath tumors (MPNSTs), also called as malignant Schwannomas or neurofibrosarcomas, are the most frequent malignant neoplasm associated with NF1 and represents a major cause of mortality in patients with NF1 because of its particularly aggressive course (Grobmyer et al., 2008; Brems et al., 2009; Katz et al., 2009; Spurlock et al., 2010). Approximately 30-40% (Grobmyer et al., 2008; Jett and Friedman, 2010) of NF1 patients have benign PNs, and MPNSTs was observed in 2-5% (Jett and Friedman, 2010) or 8-13% (Wilkinson and Kelly, 2009) of these patients (Fig. 3). The majority of NF1-associated MPNSTs (about ~85% of cases) are high-grade malignant tumors, and the lifetime risk for developing MPNSTs in patients with NF1 has been estimated at 8–13% (Evans et al., 2002) or 5.9–10.3% (McCaughan et al., 2007).
Malignant transformation of benign PNs to MPNSTs in patients with NF1 is notable (Tucker et al., 2005) and is of far greater concern to patients with NF1 (McQueen et al., 2008), but the pathogenesis is poorly understood. Bi-allelic inactivation of the NF1 gene caused by a germline first-hit mutation and a somatic second-hit LOH in SCs has been identified in DNs (Sawada et al., 1996; Wiest et al., 2003), PNs (Kluwe et al., 1999b; Rasmussen et al., 2000), and MPNSTs (Rasmussen et al., 2000; Upadhyaya et al., 2008) in
patients with NF1, indicating that complete loss of the NF1 gene (NF1-/-) in SCs contributes
to benign neurofibroma formation and progression to MPNSTs. Because bi-allelic inactivation of the NF1 gene is insufficient to explain the pathogenesis of tumor progression in NF1, cooperating genetic or epigenetic changes have been suggested to be involved in MPNST pathogenesis. Hence, robust histological and molecular analyses have been conducted to compare neurofibromas and MPNSTs (Watanabe et al., 2001; Miller et al., 2006; Brems et al., 2009), and recently developed genome-wide DNA copy number change profiling using array comparative genomic hybridization has identified causal genes in MPNST development (Mantripragada et al., 2008; Upadhyaya et al., 2012). To date, genes involved in regulating the cell-cycle and growth signal transduction have been mostly reported to be dysregulated in MPNSTs (Gottfried et al., 2006; Upadhyaya, 2011; Carroll, 2012).
Many studies have focused on genetic alterations in SCs, as most MPNSTs are thought to arise from SCs (Woodruff, 1999; Carroll and Stonecypher, 2005). In particular, down-regulation of the tumor suppressors, p53, p16INK4A, p19ARF, and Rb and up-regulation of
growth factors and their receptors, such as epidermal growth factor receptor (EGFR), ErbB2, c-Met, c-Kit, hepatocyte growth factor, and platelet-derived growth factor subunit A have been revealed in SCs (Carroll and Stonecypher, 2005; Carroll, 2012) (Fig. 4). In the chromosomal level, several comparative genome hybridization (CGH) studies of NF1-associated and sporadic MPNSTs reported the existence of gains and/or losses of genetic materials in chromosomes, 4q, 7, 8q, 15q, 17p, 17q, 19, 22q, and X (Lothe et al., 1996; Schmidt et al., 2000; Koga et al., 2002). Although no previous studies have reported
common patterns of chromosomal aberrations in NF1, the most frequent genomic imbalances in NF-1 associated MPNSTs were detected in chromosome 17q (Koga et al., 2002).
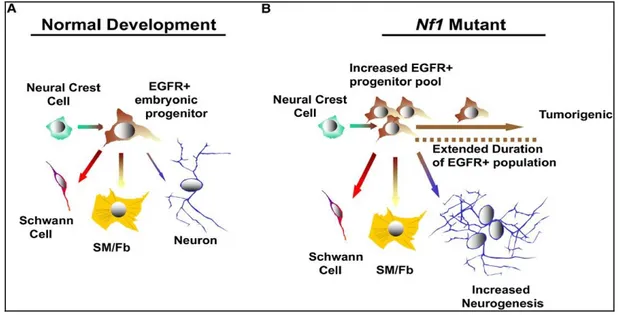
Neurofibromin deficiency by NF1 mutation in neural crest cells results in increased and extended EGFR-dependent peripheral nerve progenitor cells that confer the neurofibroma tumorigenic potential (Dasgupta and Gutmann, 2003; Williams et al., 2008) (Fig. 5). Studies have frequently observed the hyperexpression of EGFR in NF1-associated MPNST tissues and have suggested that upregulation of EGFR in SCs may play a key role in tumorigenesis and tumor progression in NF1 (DeClue et al., 2000; Carroll, 2012). The EGFR is a member of the ErbB family of receptors, a subfamily of four closely related receptor tyrosine kinases (Shaw and Cantley, 2006). The human NF1-associated MPNSTs express the EGFR but not HER2, 3, or 4. Thus, the elevation of EGFR in neural crest cells may contribute to both tumor formation and progression in NF1. However, the molecular mechanisms that explain why the EGFR is upregulated in NF1-assocaited tumors are still unknown.
Although surgical approach is the mainstay of treatment for NF1, because of very low 5- and 10-year survival rates particularly in male patients with severely malignant NF1-associated MPNSTs characterized by invasive growth, higher propensity to metastasize and limited sensitivity to radiation (Evans et al., 2002; Ingham et al., 2011), alternative therapeutic approaches have been developed. Recently, there have been several chemotherapy studies on thalidomide (Gupta et al., 2003), interferon alpha (Citak et al., 2008), pirfenidone (Babovic-Vuksanovic et al., 2006), and farnesyltransferase inhibitors
(FTI) R11577 (Widemann et al., 2006) for PNs. Phase II clinical trial of pirfenidone in patients with NF1 were expected to achieve good results, but the study did not show satisfying results (Babovic-Vuksanovic et al., 2006). A phase I clinical trial of R11577 in patients with NF1-related PNs revealed a limited efficacy of this drug in NF1 (Widemann et al., 2006).
In addition, as a clinical therapy for NF1-associated MPNSTs, combination of chemotherapeutic agents, carboplatin/Etoposide (Kinebuchi et al., 2005), Cisplatin/adriamycin (Landy et al., 2005), and ifosfamide/Doxorubicin (Kroep et al., 2011; Moretti et al., 2011), have been tested in patients with NF1-associated MPNSTs, after surgical resection and radiation treatments. Long-term investigations using a multimodel therapeutic strategy demonstrated that the patients with NF1-associated MPNSTs showed a significantly lower response rate to chemotherapy than that in patients with MPNSTs not associated with NF1 (Ferrari et al., 2011), indicating that there are still many hurdles to overcome in chemotherapy for the NF1-associated MPNSTs. The limited successful results of these clinical studies have led to the discovery of new drugs that mainly target the proteins involved in the Ras-signaling pathway (McCubrey et al., 2006). In a recent study, preclinical
in vivo evaluation of rapamycin (Sirolimus) or its derivative RAD001 (Everolimus)
demonstrated the inhibitory effect of rapamycin on MPNSTs in a xenograft mouse model.(Bhola et al., 2010) In addition, B-Raf inhibitor, Sorafenib, EGFR inhibitor, Erlotinib and R11577/ Lovastatin mediated the inhibition of cell proliferation in the MPNST cells(Ambrosini et al., 2008; Holtkamp et al., 2008; Wojtkowiak et al., 2008).
In this study, I aimed to clarify the molecular mechanisms of malignant progression of NF1 and to find new target molecule(s) for improved chemotherapeutic approaches to treat NF1-associated MPNSTs effectively. Through the comparative analysis of normal or benign neurofibroma cell lines and primary cells and of the MPNST cell line and primary cells, I found the upregulation of EGFR and antiapoptotic Bcl-xL proteins in the MPNST cells, which is responsible for the anticancer drug resistance of the NF1-associated MPNST cells.
Altogether, in the regulation of neurofibromin stability, I found an unexpected function of Bcl-xL beyond antiapoptosis. These findings may also provide insight into the molecular mechanisms of malignant NF1 development and further the new strategies for targeted chemotherapy in NF1 patients with MPNSTs.
Fig. 1. The various clinical symptoms of neurofibromatosis type 1. A, Café-au-lait spots; B, Lisch nodules; C, Scoliosis; D, Tibial dysplasia; E, Pontine glioma; F, Optic pathway glioma; G, Neurofibromas; H, Plexiform neurofibromas.
Fig. 2. Accumulation of activated GTP-Ras and the upregulation of the Ras signaling pathway in NF1. Neurofibromin deficiency by NF1 mutations induces an accumulation of the activated GTP-Ras and a subsequent upregulation of the Ras signaling pathway.
Fig. 3. Pathogenesis of the malignant peripheral nerve sheath tumor (Wilkinson SR and Kelly JM, 2009). Loss of NF1 causes neurofibromas formation in NF1 patients. Most of NF1 patients have dermal neurofibromas which have no malignant potential. Approximately 30 to 40 percent of NF1 patients have plexiform neurofibromas and they are prone to undergo malignant transformation with 8-13% possibility for developing an MPNST. A number of investigators have suggested that other genetic factors may be involved in malignant transformation in NF1.
Fig. 4. Models of tumorigenesis and tumor development in NF1 (Dasgupta B, et al., 2003). NF1 loss in Schwann cell precursors during development-in cooperation with haploinsuffiency in other types of cells (NF1+/-) in neural crest-derived tissues including
fibroblasts, perineurial cells, and mast cells results in plexiform neurofibroma formation. The accumulation of other genetic changes (e.g. p53, p16, or p27 loss and EGFR amplification) may promote transformation of benign tumors into MPNSTs.
Fig. 5. Model of EGFR-mediated tumorigenesis involving the Nf1-mutated peripheral nervous system progenitors (Williams JP, et al., 2008). (A) In the normal developmental situation, the neural crest gives rise to an EGFR+ cell found in the DRG at E12.5 in mouse,
which is capable of Schwann cell, smooth muscle/fibroblast (SM/Fb)-like cells, and rare neuronal differentiation. (B) When Nf1 is inactivated, this EGFR+ progenitor pool is
amplified, neurogenesis is increased, and the population is tumorigenic. An EGFR+ cell can
be identified in the postnatal mutant nerve and in DhhCre;Nf1fl/fl GEM-neurofibroma. It
suggest that this EGFR+ tumor-derived progenitor models the P75+;EGFR+ multipotent,
II. MATERIALS AND METHODS
1. Antibodies and regents
The following antibodies were used: anti-Bcl-xL, anti-Bcl2, anti-Bax, anti-Caspase-3, anti-Erk1/2 and anti-phosphorylated Erk1/2, anti-EGFR, anti-Ras (Cell Signaling Technology); anti-neurofibromin, anti-α-tubulin, anti-p53, anti-Mcl-1, anti-Sp1, anti-ETEA, HRP-conjugated goat anti-rabbit IgG and HRP-conjugated goat anti-mouse IgG antibodies (Santa Cruz Biotechnology); anti- phosphorylated EGFR (Epitomics); anti-phosphorylated SP1 (Abcam); anti-Lamin B (Calbiochem); anti-S100 (Thermo Science); anti-GFP (Invitrogen). Etoposide, Cisplatin and Doxorubicin were purchased from Sigma-Aldrich Co. Erlotinib was obtained from Selleck Chemical. ABT-737 and PD98059 were purchased from Santa Cruz Biotechnology and Calbiochem, respectively.
2. Patient tissue samples and primary tissue culture
Normal tissue and tumor tissue specimens were obtained by skin biopsy and surgical resection, respectively, from a 24-year old male patient with NF1 (Jeong et al., 2006; Jeong et al., 2008). The patient having a NF1 nonsense mutation Y2264X (c.6792C>G) in the NF1 gene presented the clinical features of NF1 with café-au-Lait spots, scoliosis, cutaneous neurofibromas, subcutaneous neurofibromas, PNs and MPNSTs (Jeong et al., 2006; Jeong et al., 2008). Three types of tissues, normal phenotypic tissues, benign plexiform neurofibromas (PNs) and Malignant peripheral nerve sheath tumors (MPNSTs) were
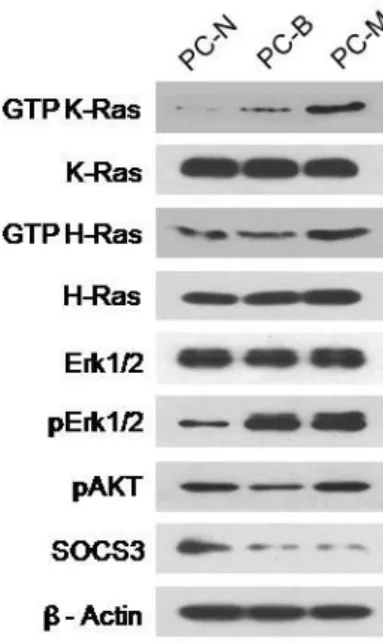
pathologically evaluated by routine light microscopy after staining with hematoxylin and eosin (H&E) as previously described (Jeong et al., 2008). The study was approved by the Institutional Review Board Committee of the Ajou University School of Medicine. Primary tissue culture was performed by primary explant technique. The dissected tissues were finely chopped, rinsed with PBS, and the pieces were seeded onto the surface of a tissue culture flask in 1 ml of DMEM supplemented with a high concentration (40%) of FBS. After an overnight incubation at 37°C, the medium volume was made up to 5 ml and then changed weekly until a substantial outgrowth of cells was observed. Cells were then grown in DMEM media supplemented with 15% FBS. Cells were used from passages 5 through 10. The primary cells from the three types of tissues, normal phenotypic tissues, PNs and MPNSTs, demonstrated their distinct cellular characteristics by western blotting with antibodies against GTP-Ras and its downstream effectors (Fig. 6).
Fig. 6. Characteristics of the NF1-associated primary tissue cultured cells. The primary cells from the three types of pathologically evaluated tissues, normal tissues (PC-N), benign PNs (PC-B) and MPNSTs (PC-M), in the NF1 patient were cultured through stage 5. Ras-GTP was detected by using a Ras-activation assay kit (Upstate Biotechnology) according to the manufacturer’s instructions. Activated GTP-Ras was determined by Western blotting with anti-H-Ras and anti-K-Ras antibodies. Protein amounts of Erk1/2, phosphorylated Erk1/2 (pErk1/2), phosphorylated Akt (pAkt) and SOCS3 were assessed by Western blotting.
3. Cell lines
Human Schwann cells (HSC) were purchased from ScienCell Research Laboratories. The NF1-MPNST Schwann-like cell sNF02.2, sNF96.2 and normal fibroblast IMR90 were obtained from American Type Culture Collection. The HSC, sNF02.2 and sNF96.2 were cultured in Dulbecco's modified essential medium supplemented with 10% fetal bovine serum, penicillin (100 U/ml) and streptomycin (100 μg/ml). IMR90 were matained in minimum essential medium (GIBCO) supplemented with 10% fetal bovine serum, penicillin (100 U/ml) and streptomycin (100 μg/ml). Cells were grown in a humidified atmosphere containing 5% CO2 at 37°C.
4. Hematoxylin and eosin staining
Tumor tissues were obtained from NF1 patients by surgical resection. For pathological evaluation of tissues by routine light microscopy, the specimens were formalin-fixed and embedded in paraffin wax, serial 3 μm sections were prepared on glass using a cryostat, and the slides were stained with hematoxylin and eosin (H&E).
5. Immunohistochemistry
Formalin-fixed paraffin-embedded (FFPE) blocks from 6 patients with NF1 were cut at 10 μm and the sections were dewaxed, rehydrated, followed by antigen retrieval in boiling citrate buffer. Immunostaining was carried out using an Ultravision LP-HRP polymer DAB Kit (Thermo Fisher Scientific), according to the manufacturer’s instructions. Briefly, the sections were incubated with Ultra V Block (Lab Vision) for 5 min at room temperature to
reduce nonspecific background, and the sections were treated with hydrogen peroxide to block the endogenous peroxidase activity. The sections were incubated with primary antibody for 1 h and then incubated with HRP polymer for 20 min. The reaction product was visualized by the chromogen DAB and counter-stained with hematoxylin. Pathological evaluation was performed with the light microscopy of the slides. This study using the human FFPE samples was approved by the institutional review board of the Ajou University School of Medicine.
6. Cell viability assay
Cell viability assay was performed by using EZ-Cytox Cell Viability Assay Kit (Daeil Labservice, Korea). The cultured cells were plated at a density of 4×10³ cells in a 96-well
flat-bottom tissue-culture plate, incubated overnight, and were treated with the indicated concentrations of drugs. After 24 h incubation, 10 μl of Ez-Cytox reagent was added, and the cells were incubated for another 2 h and then absorbance was measured at a wavelength of 450 nm with an ELISA microplate reader (Bio-RadModel 680).
7. Plasmids, small interfering RNAs (siRNAs) and transfection
Plasmid constructs encoding wild-type Bcl-xL was described previously (Jeong et al., 2004). The NFl–GRD (Nf1 GAP-related domain) was cloned from cDNA by PCR amplification using the primers 5'-ATAGATCTACCATGGATCTCCAGACAAGAGCTACA TTTATG-3' and 5'-GTAAGCTTAACCAGTGTGTATCTGCCACAGGT-3'. The PCR products were digested with Bgl II and Hind III and then were subcloned into pEYFP-C1
vectors. The target sequences for the small interfering RNAs (siRNAs) (Genolution, Korea) were as follows: 5'-CAGTGAACGTAAGGGTTCT-3' for the NF1 gene, 5'-GCAA CATGGGAATTATGAA-3' for the SP1 gene, 5'-CAGGGACAGCATATCAGAG-3' for the
BCL2L1 (Bcl-xL) gene, 5'-GGATAACACTTGTCTCTTA-3' for the FAF2 (ETEA) gene, and
5'-CCTACGCCACCAATTTCGT-3' for the nonspecific negative control. Plasmid constructs and siRNA transfections were performed in Opti-MEM (Invitrogen) using Lipofectamine 2000 (Invitrogen) and Lipofectamine RNAiMax (Invitrogen), respectively, according to the manufacturer’s instructions. For plasmid transfection, 80%-confluent cells grown in 60-mm dishes were transfected with Lipofectamine 2000 (Invitrogen). In brief, 3 ug of plasmid DNA and 5 ul of Lipofectamine 2000 (Invitrogen) were diluted separately in 500 ul of OPTI-MEM, and incubated for 5 minutes at room temperature, mixed gently. Mixtures were incubated for 20 min at room temperature and added to the cells. For transfection of siRNA, 60%-confluent cells grown in 60-mm plates were transfected with 30 to 100 nM siRNA with Lipofectamine RNAiMAX (Invitrogen) according to the manufacturer’s instructions.
8. Real-time reverse transcription-polymerase chain reaction (real-time RT-PCR) Total RNA was isolated using TRIzol reagent (Invitrogen). 1ug of total RNA was treated with DNase I (Invitrogen), then reverse transcribed, using the RevertAid™ H Minus First Strand cDNA Synthesis Kit (Fermentas) and oligo-dT primers, according to the manufacturer’s instructions. time RT-PCR was was performed on the 7500 Fast Real-time PCR System of Applied Biosystems with the SYBR Premix Ex Taq (Takara, Japan). Primers used were as follows: the p187403 primer set (Bioneer, Korea) for the EGFR,
P238284 primer set (Bioneer, Korea) for NF1, 5'-GCGATGGCTCTGGCCAATGTG-3' and 5'-GAGAGTCTGCATGGAGTCTGCCA-3 for NF1-GRD, 5'-GTCGGATCGCAGCTTGG ATGGCCAC-3' for BCL2L1 and 5'-TGTTGCCATCAATGACCCCTT-3' and 5'-CTCCAC GACGTACTCAGCG-3' for the GAPDH gene (a relative quantification standard).
9. Chromatin immunoprecipitation (ChIP) assay
Cells were cross-linked by 1% (v/v) formaldehyde-containing medium for 10 min at room temperature. Cross-linking reaction was stopped using 125 mM glycine. Cells were washed PBS, resuspend in SDS lysis buffer (1% SDS, 10 mM EDTA, 50 mM Tris-HCl, pH 8.0), and sonicated using a Vibracell sonicator (Sonic and Materials, Danbury, CT). After centrifuge, supernatant was diluted 10-fold with ChIP dilution buffer (1.25 % Triton X-100, 1 mM EDTA, 200 mM NaCl, 12.5 mM Tris-HCl pH 8.0), and 10% of the diluted lysate was used as input. The immunoprecipitation was carried out with 2 µg of pSP1 antibody or normal rabbit IgG (negative control) for 4 h at 4°C, followed by overnight incubation with protein A beads. The beads were washed and eluted in elution buffer (1% SDS, 0.1 M NaHCO3). The eluate was treated with 5 M NaCl and heated to 65°C for 4 h to reverse crosslinking. After RNase A and Proteinase K treatment, DNA was purified using a QIAquick PCR purification kit (QIAGEN, Inc., Valencia, CA) and was used as a template for EGFR promoter PCR amplification. PCRs were performed using human EGFR promoter-specific primers: A: 5'-GCACAGATTTGGCTCGACCTGGA-3' and 5'-GAGCGG GTGCCCTGAGGAGTTAATT-3'; B: 5'-TGGCCTTGGGTCCCCGCT-3' and 5'-AGGGCG GGAGGAGGAGGGAC-3'. PCR conditions were as follows: 95°C for 5 min, 95°C for 15 s,
65°C for 30 s, and 72°C for 34 s, for 40 cycles. PCR products were separated on a 1% agarose gel containing ethidium bromide and visualized under UV light using the Gel Doc XR system (Bio-Rad, USA).
10. Immunoprecipitation and immunoblotting
Cultured cells were lysed in RIPA buffer (150 mM NaCl, 1% Nonidet P-40, 0.5% sodium deoxycholate, 0.1% SDS, and 50 mM Tris buffer, pH 8.0) containing 1 mM Na3VO4,
5 mM NaF, 1 mM PMSF, and protease inhibitor cocktail. 1 mg protein lysate were incubated with indicated antibody at 4°C overnight, followed by incubation with 25μL protein-A sepharose beads for 4 h (Invitrogen). Immunocomplexes bound to agarose A were washed three times in 500 μl RIPA buffer and were boiled in 2x SDS sample buffer. Precipitated proteins were analyzed by immunoblotting with the indicated antibodies. For Western blot analyses, proteins were heated at 100°C for 10 min and analyzed by SDS-PAGE on 8-12% polyacrylamide gels. The proteins were electroblotted onto PVDF membrane (Millipore). The membranes were blocked with 5% BSA or 5% non-fat skim milk in PBST (PBS with 0.1% Tween 20) and incubated with the indicated primary antibodies overnight at 4°C. After washing with PBST for 5 min three times, the membrane was incubated for 1 h with a secondary antibody, horseradish peroxidase-conjugated anti-mouse IgG or anti-rabbit IgG antibody (Santa Cruz Biotechnology). The immunoblots were visualized using ECL Western blotting detection system (WEST-ZOL plus; Intron Biotechnology, Korea).
11. Cytoplasmic and nuclear fractionation
Cells were washed with PBS and lysed in lysis buffer A (20 mM HEPES, pH 7.4, 25 mM NaCl, 10 mM KCl, , 1 mM MgCl2, 1 mM EDTA, 20% glycerol, 0.1% Triton X100, 1 mM DTT, 1 mM NaF, 1 mM Na3VO4, 1 mM PMSF, protease inhibitor cocktail) by Dounce
homogenization. Lysates fractionated by centrifugation at 1500 g for 5 min at 4°C and supernatants were used as the cytosolic fraction. Pellets were washed and re-suspended with lysis buffer B (20 mM HEPES, pH 7.4, 300 mM NaCl, 10 mM KCl, , 1 mM MgCl2, 1 mM EDTA, 20% glycerol, 0.1% Triton X100,1 mM DTT, 1 mM NaF, 1 mM Na3VO4, 1 mM
PMSF, protease inhibitor cocktail) for 30 min at 4°C. Cell extracts were centrifuged at 14000xg for 10 min at 4°C .The resulting supernatants were collected and used as nuclear fraction.
12. Ras activation assay
Ras-GTP was detected by using a Ras-activation assay kit (Upstate Biotechnology). Briefly, active Ras was precipitated by a GST fusion protein containing the Ras-binding domain of Raf (GST-Raf-RBD). Cells were lysed with lysis buffer (25 mM HEPES pH 7.5, 150 mM NaCl, 1% Igepal CA-630, 10 mM MgCl2, 1 mM EDTA, and 2% glycerol). 300 μg of total protein was incubated with Raf-1 RBD agarose at 4˚C for 1 h. Agarose beads were washed three times with 1 ml of ice-cold lysis buffer, boiled with a 2X Laemmli sample buffer, and separated on SDS-PAGE gels, followed by western blot analysis using an anti-Ras antibody.
13. Immunofluorescence cell staining
The cells were seeded onto 12 mm × 12 mm glass cover slips (Marienfeld, Germany). After 24 hours, cells were fixed with 4% paraformaldehyde for 10 min. Then slides were subsequently washed three times with PBS and perrmeabilized with 0.5% Triton X‐100 in PBS for 10min. Blocking was done with PBS containing 5% bovine serum albumin for 30 min at room temperature. Cells were incubated with anti-phospho-SP1 antibody overnight at 4°C, and then were incubated with FITC-conjugated goat-anti-rabbit IgG antibody for 1 h at room temperature. After wash, the slides were mounted with mounting media containing DAPI (H-1200, Vectashield). Immunofluorescence images were captured and analyzed using LSM 710 confocal microscope (Carl Zeiss).
III. RESULTS
1. The EGFR expression level was closely related to the neurofibromin expression level in both normal and MPNST cells.
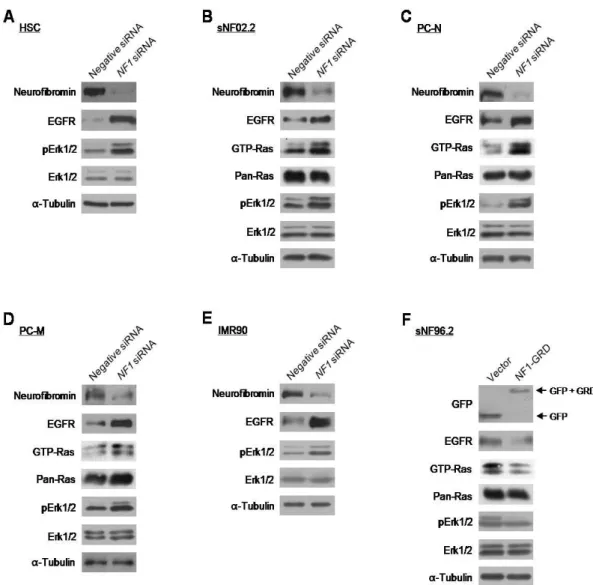
It has been reported that hyperexpression of EGFR is frequently observed in the NF1-associated MPNST tissues (DeClue et al., 2000; Carroll, 2012). In this study, I first aimed to elucidate the role of EGFR in tumor progression of NF1. I first examined whether the basal EGFR expression levels were different between SCs derived from normal tissues and MPNSTs. The EGFR expression levels were examined in the three SC lines; the normal human SC line (HSC) having both normal NF1 alleles (NF1+/+), the sNF02.2 MPNST SC
line containing one mutant NF1 allele and one normal NF1 allele (NF1+/-), and the sNF96.2 2
MPNST SC line harboring a complete LOH at NF1 locus and no intact NF1 allele (NF1-/-)
(Arima et al., 2010; Sun et al., 2012). The reduced expression level of neurofibromin was detected in the sNF02.2 compare to the HSC, and no expression of neurofibromin was detected in the sNF96.2 (Fig. 7A).
I compared the EGFR expression levels among these cells and found that neurofibromin expression levels were significantly increased in the two MPNST SCs compared the normal SCs (Fig. 7A, B). Interestingly, I found that the expression level of EGFR protein was inversely related to the expression level of neurofibromin protein in the SCs tested. In order to confirm this finding, I carried out the same experiment in the NF1-associated primary cells, the normal phenotypic fibroblast cells (PC-N) and the malignant
MPNST fibroblast cells (PC-M) derived from a patient with NF1 (Fig. 6). The expression level of neurofibromin detected in the PC-M was significantly lower than that in the PC-N, while the expression level of EGFR in the PC-M was significantly higher than that in the PC-N (Fig. 7C, D). As observed in the SC lines, the expression level of EGFR protein was dependent on the expression level of neurofibromin protein in the primary cells. These results suggested that upregulation of EGFR in the NF1-associated MPNSTs may be caused by neurofibromin deficiency.
Fig. 7. Upregulation of basal EGFR expression in NF1-associated MPNST cells. Protein levels of the neurofibromin and EGFR in three Schwann cell lines (A, B) and two primary-cultured cells were determined by Western blotting. α-tubulin protein was used as the internal control. *P < 0.05 and **P < 0.01.
2. Manipulation of NF1 gene expression caused alterations in the transcriptional expression of the EGFR gene.
In order to determine if the expression level of EGFR is dependent on the expression level of the NF1 gene, I manipulated the NF1 gene expression in the primary cells and cell lines. Depletion of neurofibromin expression by short interfering RNA (siRNA) treatment for the NF1 gene caused an increase in the EGFR expression in the normal HSC and malignant sNF96.2 SCs, primary PC-N and PC-M fibroblast cells, and normal IMR90 fibroblast cells (Fig. 8A-E). Next, I performed an overexpression of NF1 gene in the sNF96.2 cells lacking intact NF1 alleles. Because the NF1 gene is very large, and the GAP-related domain of neurofibromin (NF1-GRD) is sufficient to restore normal growth in mouse
Nf1-/- cells (Hiatt et al., 2001), I used a GFP-fused NF1-GRD plasmid construct for the
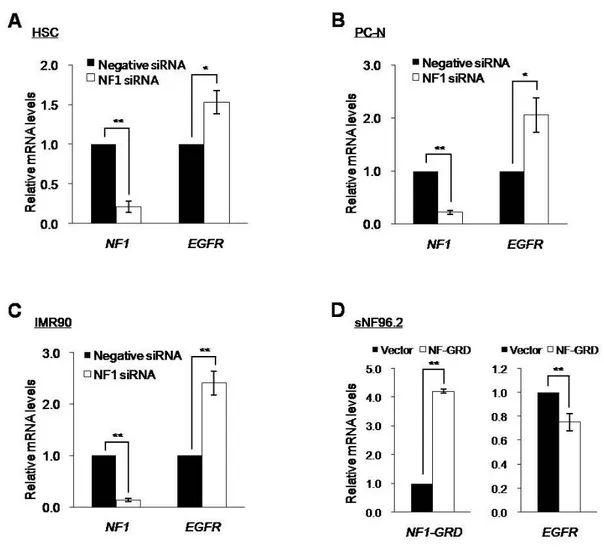
neurofibromin overexpression experiments instead of a plasmid construct containing the full-length NF1 gene. Overexpression of the NF1-GRD-GFP in sNF96.2 cells resulted in the decreased EGFR expression, as expected (Fig. 8F). Alterations in EGFR level by manipulating the NF1 gene expression had an influence on the Ras/Raf/Mek/Erk pathway. Expression levels of EGFR were associated with protein levels of the activated forms of Ras GTPase, GTP-Ras, and/or its downstream effector Erk1/2, phosphorylated Erk1/2 (pErk1/2) (Fig. 8). Importantly, quantitative real-time reverse-transcribed-PCR (RT-PCR) demonstrated that both the significantly increased EGFR expression level by the knockdown of NF1 gene and the significantly decreased EGFR expression level by the overexpression of NF1-GRD were responsible for the changes in transcriptional expression of the EGFR gene (Fig. 9).
Fig. 8. Correlation between the expression levels of the EGFR and neurofibromin. (A-E) The indicated cells were transfected with siRNAs for the NF1 gene (100 nM) or the nonspecific negative control (100 nM). After 72 h incubation, protein levels of the indicated proteins were determined by Western blot analysis. α-tubulin protein level was used as the internal control. (F) sNF96.2 cells were transfected with pEGFP-C1 vector or the NF1-GRD plasmid construct and then incubated for 24 h. Protein levels of the indicated proteins were determined by Western blot analysis. α-tubulin protein level was used as the internal control.
Fig. 9. Increased transcriptional expression of the EGFR by the downregulation of NF1 expression. (A-C) The indicated cells were transfected with siRNAs for the NF1 gene (100 nM) or the nonspecific negative control (100 nM) and incubated for 72 h. (D) sNF96.2 cells were transfected with pEGFP-C1 vector or the NF1-GRD plasmid construct and then incubated for 24 h. Relative NF1 and EGFR mRNA levels in cells transfected with the control or NF1 siRNAs were assessed by real-time reverse transcription polymerase chain reaction (RT-PCR). *P < 0.05 and **P < 0.01.
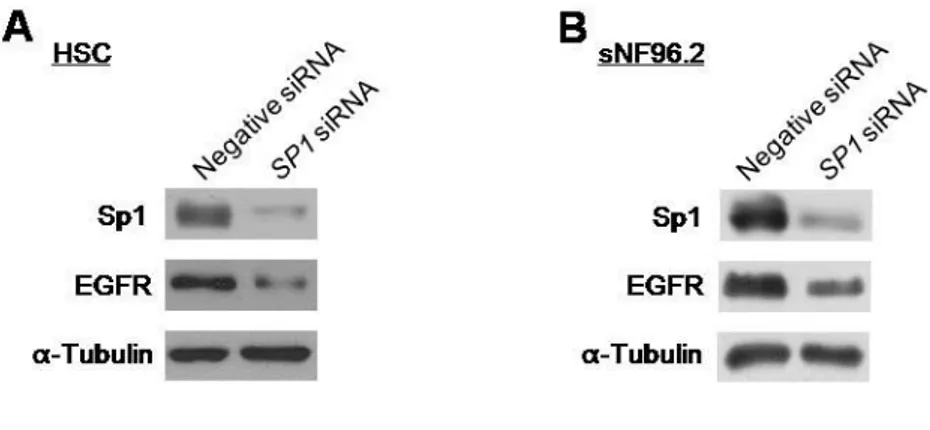
3. Neurofibromin-regulated EGFR expression occurred by modulating the binding of the Sp1 transcription factor to the EGFR gene promoter
Because specificity protein 1 (Sp1) is known to be a major transcription factor of the EGFR gene (Kageyama et al., 1988), I aimed to examine if the neurofibromin-mediated regulation of transcriptional expression of the EGFR gene was influenced by Sp1. At first, I tested whether basal transcriptional expression of the EGFR gene is regulated by Sp1 in SCs. The HSC and sNF96.2 SCs knocked down of SP1 by siRNAs treatment showed decreased expression of EGFR (Fig. 10). Next, I examined whether alterations in the NF1 expression level affect the Sp1 expression and/or activation. Knockdown of NF1 by siRNAs revealed increased Sp1 expression level and increased protein level of the activated form of Sp1, phosphorylated Sp1 at Threonine residue 453 (pSp1) (Milanini-Mongiat et al., 2002; Chu and Ferro, 2005), in the all tested cells, including HSC and sN02.2 SCs, primary PC-N and PC-M cells, and normal fibroblast IMR90 cells (Fig. 11A-E), while overexpression of
Fig. 10. The Sp1-mediated expression regulation of the EGFR gene. HSC (A) and sNF96.2 (B) cells were transfected with siRNAs for the SP1 gene (30 nM) or the nonspecific negative control (30 nM). After 72 h incubation, protein levels of the Sp1 and EGFR proteins were determined by Western blot analysis. α-tubulin protein level was used as the internal control.
Fig. 11. Alterations in the total Sp1 and phosphorylated Sp1 levels in NF1-manipulated cells. (A-E) The indicated cells were transfected with siRNAs for the NF1 gene (100 nM) or the nonspecific negative control (100 nM). After 72 h incubation, protein levels of the Sp1 and phosphorylated Sp1 (pSp1) were determined by Western blot analysis. α-tubulin protein level was used as the internal control. (F) sNF96.2 cells were transfected with pEGFP-C1 vector or the NF1-GRD plasmid construct and then incubated for 24 h. Protein levels of the Sp1 and pSp1 were determined by Western blot analysis. α-tubulin protein level was used as the internal control.
Because nuclear localization of the activated pSp1 (Davie et al., 2008; Ito et al., 2009) is known, we investigated the nuclear-localizing pSP1 protein levels by manipulating the
NF1 gene expression. Knockdown of NF1 by RNAi in HSC and IMR90 cells showed the
increased pSp1 in the nucleus, while overexpression of NF1-GRD in sN96.2 cells showed the reduced pSp1 in the nucleus (Fig. 12). Next, in order to prove the hypothesis that neurofibromin regulates EGFR expression at the mRNA level via modulating transcriptional activity of Sp1 which is influenced by phosphorylation at Threonine residue 453, I tested whether there were alterations in pSp1 binding to EGFR gene in response to neurofibromin expression level. Downregulation of NF1 in HSC and IMR90 cells resulted in the elevated pSp1 level in the nucleus rather than cytosol (Fig. 13 A, B).
To examine whether the increased pSp1 in the nucleus leads to the increased binding of pSp1 to EGFR promoter, I preformed the site-specific chromatin immunoprecipitation (ChIP) targeting the pSp1-binding site of EGFR gene as described the previous report (Schuch et al., 2012). After pulling-down the pSp1-assocaited chromatins using anti-pSp1 antibody in the HSC cells treated NF1 or negative control siRNAs, PCR amplification for the two pSp1 binding-regions on the EGFR promoter was performed. The results of site-specific ChIP on HSC cells revealed that binding of pSp1 to EGFR gene was stimulated by knockdown of NF1 (Fig. 13C). These results demonstrated that neurofibromin regulates
EGFR expression via modulating the binding of Sp1 transcription factor to the EGFR gene
Fig. 12. Nuclear localization changes of the phosphorylated Sp1 in NF1-manipulated cells. HSC and IMR 90 cells were transfected with siRNAs for the NF1 gene (100 nM) or the nonspecific negative control (100 nM) and then incubated for 72 h. sNF96.2 cells were transfected with pEGFP-C1 vector or the NF1-GRD plasmid construct and then incubated for 24 h. Cells were further incubated with anti-phospho-SP1 (pSp1) antibody overnight at 4°C, and then were incubated with FITC-conjugated goat-anti-rabbit IgG antibody for 1 h at room temperature. After wash, the slides were mounted with mounting media containing DAPI for staining the nucleus. Immunofluorescence images were captured and analyzed using LSM 710 confocal microscope.
Fig. 13. Neurofibromin-regulated EGFR expression via modulating the binding of the Sp1 transcription factor to the EGFR gene promoter. HSC (A) and IMR90 (B) cells were transfected with siRNAs for the NF1 gene (100 nM) or the nonspecific negative control (100 nM). After 72 h incubation, the cells were harvested and homogenized. Total cell extract were divided into cytosolic and nuclear fractions. Protein levels of the phosphorylated Sp1 (pSp1), nuclear marker Lamin, and α-tubulin proteins were assessed by Western blot analysis.
Lamin and α-tubulin protein level was used as each fraction marker. (C) The site-specific chromatin immunoprecipitation targeting the pSp1-binding site of EGFR gene. HSC cells were transfected with siRNAs for the NF1 gene (100 nM) or the nonspecific negative control (100 nM). After 72 h incubation, nuclei were lysed, and chromatin was fragmented by enzyme digestion. Chromatin was immunoprecipitated either by rabbit IgG antibody as a negative control or anti-pSp1 antibody. Non-immunoprecipitated chromatin was used as total input. DNAs form Input and IgG and SP1-immunoprecipitated chromatins were subjected to PCR analysis. PCR was performed using the primers corresponding to each region (regions 1 and 2) of the promoter region of EGFR gene. Structure of the 5′-region of the EGFR gene is shown in the bottom.
4. Neurofibromin-regulated EGFR expression occurred by modulating the Erk/Sp1-signaling pathway
Next, I aimed to clarify the molecular mechanisms of how alterations in neurofibromin expression in SCs modulate EGFR expression level. Extracellular regulated kinase (Erk)1/2 is reported to be one of the key protein kinases that are responsible for Sp1 phosphorylation (Merchant et al., 1999; Chupreta et al., 2000). I first tested whether inhibiting Erk1/2 could influence Bcl-xL expression level in HSC cells. When HSC cells were treated with the Erk1/2 inhibitor PD98059 for 24 h, EGFR and Sp1 protein levels decreased in a dose-dependent manner (Fig. 14A). Next, neurofibromin-depleted HSC cells following transfection with NF1 siRNAs exhibited a increase in pErk1/2, Sp1, and EGF levels in the absence of PD98059, but neurofibromin-depleted HSC cells showed a weak increase in pErk1/2 and Bcl-xL levels in the presence of PD98059 (Fig. 14B). These results suggested that the Erk1/2-mediated Sp1 level may play a crucial role in the NF1 dose-dependent EGFR expression changes.
Fig. 14. Knockdown of NF1-induced EGFR expression by activating the Erk1/2 and Sp1. (A) HSC cells were treated with DMSO (control) or the indicated concentrations of the Erk1/2 inhibitor PD98059 for 24 h. Protein levels of Erk1/2, phosphorylated Erk1/2 (pErk1/2), Sp1, EGFR, and α-tubulin were assessed by Western blotting. α-tubulin protein level was used as the internal control. (B) HSC cells were transfected with or without the
NF1 siRNAs and DMSO or 70 μM PD98059, and then incubated for 24 h. Protein levels of
Erk1/2, phosphorylated Erk1/2 (pErk1/2), Sp1, EGFR, and α-tubulin in the HSC cells were assessed by Western blotting. α-tubulin protein level was used as the internal control.
5. MPNST cells were more resistant than normal cells to anticancer drugs inducing apoptosis.
Understanding the mechanism of drug resistance is crucial for developing new strategies for targeted chemotherapy. To examine whether the chemosensitivity to anticancer drugs between normal and malignant Schwann cell (SC) lines was different, I investigated cytotoxic sensitivity to the representative anticancer drugs inducing apoptosis in the established cell lines, the normal human SC line (HSC), the sNF02.2 MPNST SC line, and the sNF96.2 2 MPNST SC line (Jouhilahti et al., 2011). Since Doxorubicin, Cisplatin and Etoposide have already been studied in the patients with NF1-associated MPNSTs (Kinebuchi et al., 2005; Landy et al., 2005; Kroep et al., 2011; Moretti et al., 2011), I used these three anticancer drugs in this study. Cell viability assay results showed that the sNF02.2 and sNF96.2 MPNST cells were more resistant to all three drugs than normal HSC cells (Fig. 15A-C). Next, I tried to confirm this result in the NF1-associated primary cells. As observed in the cell lines, the primary MPNST cells (PC-M) were more resistant to all three drugs than the primary normal phenotypic cells (PC-N) (Fig. 15D-F).
Fig. 15. Comparison of the chemosensitivity to anticancer drugs between normal cells and MPNST cells. (A, B, C) Established normal human Schwann cell line (HSC), NF1-associated MPNST cells (sNF02.2) and human NF1-depeted Schwann cell line (sNF96.2) and (D, E, F) primary tissue cultured normal cells (PC-N) and MPNST cells (PC-M) were treated with the indicated concentrations of Doxorubicin, Cisplatin or Etoposide. After 24 h incubation, cell viability was determined by Ez-Cytox assay.
6. The downregulation of NF1 expression reduced the apoptosis sensitivity to Doxorubicin in normal cells.
Because the NF1-assocaited MPNST cells showed reduced apoptosis sensitivity to anticancer drugs, I examined whether depletion of neurofibromin by siRNAs treatment targeting the NF1 gene had an influence on apoptotic cell death by anticancer drugs. The neurofibromin-depleted HSC and primary PC-N cells showed decreased caspase-3 cleavage activity (Fig. 16A, B) and increased cell viability (Fig. 16C, D), when Doxorubicin was co-treated for 24 h after 72 h of NF1 siRNA treatment.
Fig. 16. Decreased apoptosis sensitivity to Doxorubicin by the downregulation of NF1 expression in normal cells. The normal human Schwann cell line (HSC) and primary tissue cultured normal cells (PC-N) were transfected with siRNAs for the negative control (100 nM) or NF1 (100 nM). After 72 h incubation, HSC and PC-N cells were further treated with 0.5 μg/ml and 2.5 μg/ml of Doxorubicin, respectively for 24 h. (A, C) Protein levels of uncleaved caspase 3 (U-Caspase 3), cleaved caspase 3 (C-Caspase 3), and α-tubulin were determined by Western blotting. α-tubulin protein level was used as the internal control. (B, D) Cell viability was determined by the Ez-Cytox assay. *P < 0.05 and **P < 0.01.
7. The NF1 gene dose mediated the Bcl-xL expression level in normal and MPNST cells.
In order to determine the primary cause of the decreased apoptotic cell death in the normal cells lacking neurofibromin (Fig. 16), I investigated expression levels of the Bcl-2 family members and p53 that play a key role in cellular apoptosis regulation in the NF1-depleted normal cells. Downregulation of neurofibromin expression by NF1 siRNAs treatment caused a significant increase in the Bcl-xL expression in a dose-dependent manner in both the normal human Schwann cell line (HSC) and primary normal cells (PC-N), but it did not have any effects on other proteins, Bcl-2, Mcl-1, Bax, and p53 (Fig. 17A, C). Real-time RT-PCR results of BCL2L1 demonstrated that increased Bcl-xL expression level in the neurofibromin-depleted HSC and PC-N cells was caused by increased BCL2L1 mRNA expression (Fig. 17B, D), indicating that the knockdown of NF1 led to the increase in the mRNA level of the BCL2L1 gene.
Because the NF1-GRD is sufficient to restore normal growth in mouse Nf1-/- cells
(Hiatt et al., 2001), I overexpressed a human NF1-GRD fused to GFP. NF1-GRD-GFP overexpression in sNF96.2 cells increased caspase-3 cleavage activity significantly and reduced cell viability by Doxorubicin treatment (Fig. 18). These results indicate that Bcl-xL expression level is mediated by NF1 gene dose.
Fig. 17. Increase of Bcl-xL expression at the mRNA level in normal cells by knockdown of NF1. (A, B) The normal human Schwann cell line (HSC) and primary normal cells (PC-N) were treated with siRNAs for the NF1 gene (30 or 60 nM) or the nonspecific negative control (30 nM). After 72 h incubation, protein expression levels of the indicated proteins were assessed by Western blot analysis. (B, D) Relative mRNA levels of NF1 and BCL2L1 in the HSC and PC-N cells were measured by real-time RT-PCR. *P < 0.05 and **P < 0.01.
Fig. 18. Reduced Bcl-xL expression and enhanced apoptosis sensitivity to Doxorubicin in MPNST sNF96.2 cells by NF1-GRD overexpression. sNF96.2 cells were transfected with pEGFP-C1 vector or the NF1-GRD plasmid construct and then incubated for 24 h. sNF96.2 cells were further treated with 0.5 μg/ml Doxorubicin for 24 h. (A) Protein levels of Bcl-xL, uncleaved caspase 3 (U-Caspase 3), cleaved caspase 3 (C-Caspase 3), and α-tubulin were determined by Western blotting. α-tubulin protein level was used as the internal control. (B) Cell viabilities of the 0.5 μg/ml Doxorubicin-treated cells were determined by the Ez-Cytox assay. **P < 0.01.
8. The endogenous Bcl-xL was upregulated in MPNST cells.
Comparison study of the chemosensitivity to anticancer drugs between the normal cells and malignant MPNST cells demonstrated that MPNST cells represented strong drug resistance compared to the normal cells (Fig. 15). Next, I aimed to clarify the reason for the difference in drug resistance between the MPNST cells and normal cells. Because NF1-GRD overexpression resulted in enhanced apoptosis sensitivity to Doxorubicin in the MPNST sNF96.2 cells (Fig. 18), I compared the basal expression levels of apoptosis-related proteins between normal and MPNST cells. Interestingly, I found that the basal expression level of Bcl-xL was significantly increased in both established and primary MPNST cells compared to the normal cell line and primary normal cells, while none of the expression levels of other anti-apoptotic proteins, Bcl-2 and Mcl-l, and p53 were found to be different (Fig. 19).
Fig. 19. Hyperexpression of Bcl-xL in MPNST cells. (A) Basal protein expression levels of the Bcl-xL ,Bcl-2, Mcl-1, and p53 in the normal human Schwann cell line (HSC) and NF1-associated MPNST cell lines (sNF02.2 and sNF96.2) and (B) primary tissue cultured normal phenotypic cells (PC-N) and MPNST cells (PC-M) were assessed by Western blotting. α-tubulin protein level was used as the internal control.
9. The Bcl-xL expression level was closely related to the apoptosis sensitivity to Doxorubicin in both normal and MPNST cells.
To determine if the apoptosis sensitivity to Doxorubicin was dependent on Bcl-xL expression level in cells, I manipulated Bcl-xL expression levels in normal Schwann cells (HSC) and two MPNST Schwann cells (sNF02.2 and sNF96.2). Overexpression of Bcl-xL in HSC cells decreased caspase-3 cleavage activity significantly and increased cell viability by Doxorubicin treatment (Fig. 20A, B). In contrast, down-regulation of Bcl-xL in MPNST cells by treatment with siRNAs targeting the BCL2L1 gene increased caspase-3 cleavage activity significantly and reduced cell viability by Doxorubicin treatment (Fig. 20C-F). These results indicate that Bc-xL level is closely related to apoptosis sensitivity by Doxorubicin in both normal and MPNST cells.
Fig. 20. The Bcl-xL level-dependent alteration of apoptosis sensitivity to Doxorubicin in normal and MPNST cells. (A, B) Overexpression of Bcl-xL in human normal Schwann HSC cells. The HSC cells were transfected with pCDNA3.1 plasmid vector or a Bcl-xL plasmid construct and then incubated for 24 h. The cells were further treated with 0.5 μg/ml Doxorubicin for 24 h. (C, D, E, F) Knockdown of BcL-xL using siRNAs in the MPNST Schwann cell lines, sNF02.2 and sNF96.2. MPNST cells were treated with BCL2L1 gene siRNAs (50 nM) or the nonspecific negative control (50 nM) and incubated for 72 h. The cells were further treated with 0.5 μg/ml Doxorubicin for 24 h. (A, C, E) Protein levels of Bcl-xL, uncleaved caspase 3 (U-Caspase 3), cleaved caspase 3 (C-Caspase 3), and α-tubulin
were determined by Western blotting. α-Tubulin protein level was used as an internal control. (B, D, F) Cell viabilities of the cells were determined by Ez-Cytox assay. *P < 0.05 and **P < 0.01.
10. NF1 deficiency-induced Bcl-xL expression occurred by activating the Ras/Erk/Sp1 signaling pathway
Next, I attempted to clarify the molecular mechanisms of how alterations in neurofibromin expression modulate Bcl-xL expression level. Because neurofibromin deficiency caused Erk/Sp1 signaling activation and promotes an EGFR increase by transcriptional regulation (Figs. 8-14), and because Sp1 is one of the transcription factor of
BCL2L1 gene which encoding Bcl-xL protein (Lee et al., 2009), I explored if the Erk/Sp1
signaling pathway (Chupreta et al., 2000) is involved in this neurofibromin-mediated Bcl-xL expression alterations. I first tested whether inhibiting Erk1/2 could influence Bcl-xL expression level in sNF96.2 cells. I first tested whether inhibiting Erk1/2 could influence Bcl-xL expression level in sNF96.2 cells. When sNF96.2 cells were treated with the Erk1/2 inhibitor PD98059 for 24 h, Bcl-xL protein level decreased in a dose-dependent manner (Fig. 21A). Next, neurofibromin-depleted HSC cells following transfection with NF1 siRNAs exhibited a significant increase in pErk1/2 and Bcl-xL levels in the absence of PD98059, but neurofibromin-depleted HSC cells showed a weak increase in pErk1/2 and Bcl-xL levels in the presence of PD98059 (Fig. 21B). These results suggest that the Erk1/2 activation level may play a crucial role in the NF1 dose-dependent Bcl-xL expression changes in both normal and MPNST cells.
Knockdown of SP1 gene reduced Bcl-xL, indicating that transcript factor Sp1 is involved in Bcl-xL transcription in the HSC cells (Fig. 21C). In order to prove the hypothesis that neurofibromin regulated Bcl-xL expression at the mRNA level via modulating
transcriptional activity of Sp1, I checked the levels of total Sp1 and activated, phosphorylated Sp1 in the NF1-depleted HSC cells. Downregulation of NF1 in HSC cells resulted in increased Sp1 and pSp1 levels (Fig. 21D). Because Sp1 is known to be activated by EGFR (Kageyama et al., 1988), I treated EGF in primary normal PC-N cells. Inducing EGFR expression level by EGF treatment resulted in activation of Ras/Erk/Sp1 pathway and consequently Bcl-xL upregulation (Fig. 21E). These results indicated that elevated transcriptional expression of EGFR and Bcl-xL in MPNST cells is mediated by the Ras/Erk/Sp1signaling pathway.
Fig. 21. NF1-dependent regulation of Bcl-xL expression via the Ras/Erk/Sp1-mediated signaling pathway. (A) sNF96.2 cells were treated with DMSO (control) or the indicated concentrations of the Erk1/2 inhibitor PD98059 for 24 h. Protein levels of Erk1/2, phosphorylated Erk1/2 (pErk1/2), Bcl-xL, and α-tubulin in sNF96.2 cells were assessed by Western blotting. α-tubulin protein level was used as the internal control. (B) HSC cells were transfected NF1 siRNAs with DMSO (control) or 70 μM PD98059 and then incubated for 24
and α-tubulin in the HSC cells were assessed by Western blotting. α-tubulin protein level was used as the internal control. (C, D) HSC cells were transfected with siRNAs for the SP1 (50 nM) or NF1 (100 nM) genes or the nonspecific negative control (50 or 100 nM). After 72 h incubation, protein levels of the indicated proteins were determined by Western blot analysis. α-tubulin protein level was used as the internal control. (E) PC-N cells were treated with or without EGF and then incubated for 24 h. Cells were then treated with DMSO (control) or 50 ng/ml of EGF for 2 h. The indicated proteins were determined by Western blot analysis. α-tubulin protein level was used as the internal control.