www.cdc.go.kr
3038
주간 건강과 질병•제13권 제42호
만성질환 통계
1. 에너지 섭취량 추이, 1998∼2018
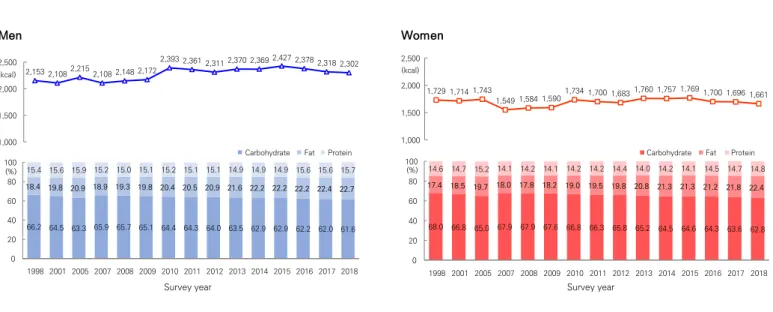
◈ 에너지 섭취량은 2018년 남자 2,302kcal, 여자 1,661kcal로 남자는 1998년(2,153kcal)에 비해 증가하였으나 여자는 20년간 유사한 수준
유지, 남녀 모두 에너지 섭취량 중 탄수화물의 섭취 분율은 1998년에 비해 2018년에 감소한 반면 지방은 증가하는 경향임(그림 1).
2,153 2,108 2,215 2,108 2,148 2,1722,393 2,361 2,311 2,370 2,369 2,427 2,378 2,318 2,302 1,000 1,500 2,000 2,500조사연도
66.2 64.5 63.3 65.9 65.7 65.1 64.4 64.3 64.0 63.5 62.9 62.9 62.2 62.0 61.6 18.4 19.8 20.9 18.9 19.3 19.8 20.4 20.5 20.9 21.6 22.2 22.2 22.2 22.4 22.7 15.4 15.6 15.9 15.2 15.0 15.1 15.2 15.1 15.1 14.9 14.9 14.9 15.6 15.6 15.7 0 20 40 60 80 100 1998 2001 2005 2007 2008 2009 2010 2011 2012 2013 2014 2015 2016 2017 2018 탄수화물 지방 단백질 (kcal) (%)남자
그림 1. 에너지 섭취량 및 급원별 섭취분율 추이
1,729 1,714 1,743 1,549 1,584 1,5901,734 1,700 1,683 1,760 1,757 1,769 1,700 1,696 1,661 1,000 1,500 2,000 2,500 조사연도 68.0 66.8 65.0 67.9 67.9 67.6 66.8 66.3 65.8 65.2 64.5 64.6 64.3 63.6 62.8 17.4 18.5 19.7 18.0 17.8 18.2 19.0 19.5 19.8 20.8 21.3 21.3 21.2 21.8 22.4 14.6 14.7 15.2 14.1 14.2 14.1 14.2 14.2 14.4 14.0 14.2 14.1 14.5 14.7 14.8 0 20 40 60 80 100 1998 2001 2005 2007 2008 2009 2010 2011 2012 2013 2014 2015 2016 2017 2018 탄수화물 지방 단백질 (kcal) (%)여자
* 2005년 추계인구로 연령표준화
출처 : 2018년 국민건강통계, http://knhanes.cdc.go.kr/
작성부서 : 질병관리청 만성질환관리국 건강영양조사분석과
www.cdc.go.kr
3039
주간 건강과 질병•제13권 제42호
2. 음료류 섭취량 현황, 1998∼2018
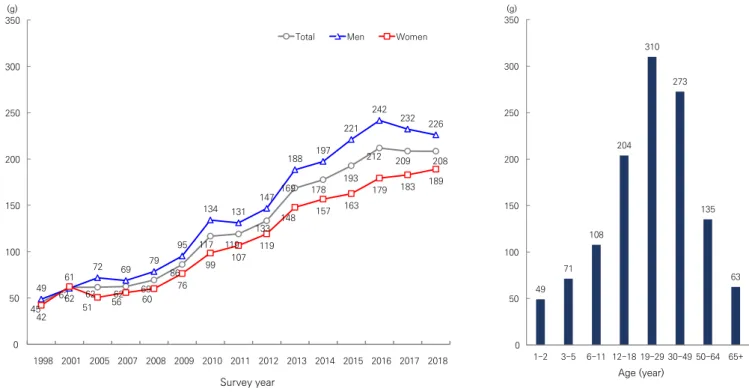
◈ 음료류 섭취량은 2018년 208g으로 1998년(45g)에 비해 20년간 4배 이상 증가(그림 2), 음료류 섭취량은 남자가 여자보다 높았으며 20,
30대에서 가장 높았음(그림 3).
45 62 62 62 69 86 117 119 133 169 178 193 212 209 208 49 61 72 69 79 95 134 131 147 188 197 221 242 232 226 42 62 51 56 60 76 99 107 119 148 157 163 179 183 189 0 50 100 150 200 250 300 350 1998 2001 2005 2007 2008 2009 2010 2011 2012 2013 2014 2015 2016 2017 2018 전체 남자 여자 (g)조사연도
그림 2. 음료류 섭취량 추이, 1998∼2018
49 71 108 204 310 273 135 63 0 50 100 150 200 250 300 350 1~2 3~5 6~11 12~18 19~29 30~49 50~64 65+ (g)연령(세)
그림 3. 연령별 음료류 섭취량, 2018
* 그림2의 연도별섭취량은 2005년 추계인구로 연령표준화
출처 : 2018년 국민건강통계, http://knhanes.cdc.go.kr/
작성부서 : 질병관리청 만성질환관리국 건강영양조사분석과
www.cdc.go.kr
3040
주간 건강과 질병•제13권 제42호
1. Trends in intake of energy, 1998-2018
◈ Energy intake in 2018 was 2,302 kcal for men and 1,661 kcal for women, which increased compared to 1998 for men, but at a similar
intake for women. Over the past 20 years, the percentage of energy intake from carbohydrate has decreased, but the percentage of
energy intake from fat has increased (Figure 1).
2,153 2,108 2,215 2,108 2,148 2,1722,393 2,361 2,311 2,370 2,369 2,427 2,378 2,318 2,302 1,000 1,500 2,000 2,500
Survey year
66.2 64.5 63.3 65.9 65.7 65.1 64.4 64.3 64.0 63.5 62.9 62.9 62.2 62.0 61.6 18.4 19.8 20.9 18.9 19.3 19.8 20.4 20.5 20.9 21.6 22.2 22.2 22.2 22.4 22.7 15.4 15.6 15.9 15.2 15.0 15.1 15.2 15.1 15.1 14.9 14.9 14.9 15.6 15.6 15.7 0 20 40 60 80 100 1998 2001 2005 2007 2008 2009 2010 2011 2012 2013 2014 2015 2016 2017 2018 Carbohydrate Fat Protein (kcal)(%)
Men
Figure 1. Trends in energy intake and percentage of energy in take from carbohydrate, fat, and protein
1,729 1,714 1,743 1,549 1,584 1,5901,734 1,700 1,683 1,760 1,757 1,769 1,700 1,696 1,661 1,000 1,500 2,000 2,500 68.0 66.8 65.0 67.9 67.9 67.6 66.8 66.3 65.8 65.2 64.5 64.6 64.3 63.6 62.8 17.4 18.5 19.7 18.0 17.8 18.2 19.0 19.5 19.8 20.8 21.3 21.3 21.2 21.8 22.4 14.6 14.7 15.2 14.1 14.2 14.1 14.2 14.2 14.4 14.0 14.2 14.1 14.5 14.7 14.8 0 20 40 60 80 100 1998 2001 2005 2007 2008 2009 2010 2011 2012 2013 2014 2015 2016 2017 2018 (kcal) (%)Women
Carbohydrate Fat Protein
Survey year
* Energy intake and percentage of energy in take from carbohydrate, fat, and protein in figure 1 was calculated using age- and sex-specific
structures of the estimated population in the 2005 Korea Census.
Source: Korea Health Statistics 2018, Korea National Health and Nutrition Examination Survey, http://knhanes.cdc.go.kr/
Reported by: Division of Health and Nutrition Survey and Analysis, Korea Disease Control and Prevention Agency
www.cdc.go.kr
3041
주간 건강과 질병•제13권 제42호
2. Trends in intake of beverages, 1998-2018
◈ Beverage intake among Korea population aged 1 years and over was 208g in 2018, increase to more than four times of that in 1998
(45g). Beverages intake was higher in men than in women, and the highest in their 20s and 30s (Figure 2, 3).
45 62 62 62 69 86 117 119 133 169 178 193 212 209 208 49 61 72 69 79 95 134 131 147 188 197 221 242 232 226 42 62 51 56 60 76 99 107 119 148 157 163 179 183 189 0 50 100 150 200 250 300 350 1998 2001 2005 2007 2008 2009 2010 2011 2012 2013 2014 2015 2016 2017 2018 Total Men Women (g)
Survey year
Figure 2. Trends in intake of beverages, 1998-2018
49 71 108 204 310 273 135 63 0 50 100 150 200 250 300 350 1-2 3-5 6-11 12-18 19-29 30-49 50-64 65+ (g)