저작자표시-비영리-변경금지 2.0 대한민국 이용자는 아래의 조건을 따르는 경우에 한하여 자유롭게 l 이 저작물을 복제, 배포, 전송, 전시, 공연 및 방송할 수 있습니다. 다음과 같은 조건을 따라야 합니다: l 귀하는, 이 저작물의 재이용이나 배포의 경우, 이 저작물에 적용된 이용허락조건 을 명확하게 나타내어야 합니다. l 저작권자로부터 별도의 허가를 받으면 이러한 조건들은 적용되지 않습니다. 저작권법에 따른 이용자의 권리는 위의 내용에 의하여 영향을 받지 않습니다. 이것은 이용허락규약(Legal Code)을 이해하기 쉽게 요약한 것입니다. Disclaimer 저작자표시. 귀하는 원저작자를 표시하여야 합니다. 비영리. 귀하는 이 저작물을 영리 목적으로 이용할 수 없습니다. 변경금지. 귀하는 이 저작물을 개작, 변형 또는 가공할 수 없습니다.
A Thesis
For the Degree of Master of Science
Effect of Various Levels of Tapioca Residues
on Growth Performance, Blood Profiles, Pork
Quality and Feed Cost in Finishing Pigs
비육돈 사료 내 타피오카 부산물의 수준별 첨가가
비육돈의 성장성적, 혈액성상, 도체특성 및
사료가격에 미치는 영향
February, 2020
By
You, Sung Min
College of Agriculture and Life Sciences
Seoul National University
Effect of Various Levels of Tapioca Residues on
Growth Performance, Blood Profiles, Pork Quality and
Feed Cost in Finishing Pigs
비육돈 사료 내 타피오카 부산물의 수준별 첨가가
비육돈의 성장성적, 혈액성상, 도체특성, 및 사료가격에
미치는 영향
지도교수
김 유 용
이 논문을 농학석사 학위논문으로 제출함
2020 년 2 월
서울대학교 대학원 농생명공학부
유 성 민
유성민의 농학석사 학위논문을 인준함
2020 년 2 월
위 원 장 (인)
부위원장 (인)
위 원 (인)
Summary
With the recent rise in feed ingredient prices such as corn and soybean meal (SBM), there is increasing in the economics of animal feed in the livestock industry. Feed accounts for about 60-70% of total production costs in livestock farming. Korea relies on imports for about 90% of its feed ingredients, and prices of major feed ingredients are unstable worldwide. So studies of various alternative feed ingredients to help reduce feed costs are very important. Tapioca is regarded as a typical energy source in swine feed because its price is lower than other energy source although it contains high level of energy. Therefore, this study was conducted to evaluate different levels of tapioca residue supplementation on growth performance, blood profiles, pork quality and feed cost in finishing pigs. A total of 140 finishing pigs ([Yorkshire×Landrace]×Duroc), with an average body weight of 69.22±3.985kg, were used for 6 weeks feeding trial. Pigs were allotted into one of four treatments by body weight and sex in 5 replicates with 7 pigs per pen in a randomized complete block (RCB) design. The treatments were included 1) Corn-SBM based diet (T0), 2) Corn-SBM based diet + 3% of tapioca residue (T3), 3) Corn-SBM based diet + 6% of tapioca residue (T6) and 4) Corn-SBM based diet + 9% of tapioca residue (T9). In feeding trial, there were no significant differences in body weight (BW), average daily gain (ADG) and average daily feed intake (ADFI). However, during late finishing period (4-6 weeks) and whole finishing phase (0-6 weeks) G:F ratio showed quadratic response (quadratic, P<0.01, P<0.01 respectively). The ADFI tended to increase linearly with increasing levels of tapioca residue in diet during late finishing period (linear, P<0.08). Blood profiles were not affected by dietary levels of tapioca residue. In proximate analysis of longissimus muscle, crude ash was decreased linearly with increasing tapioca residue levels (linear, P<0.05). Moisture, crude protein (CP) and crude fat were not affected by
dietary tapioca treatments. In addition, significant differences were not observed on water holding capacity (WHC), cooking loss and shear force by dietary levels of tapioca residue. There were no significant differences in pH of pork and meat color. There were significant differences in TBARS values between 3rd and 7th storage periods although all of the values were within the normal range. In fatty acid composition, there were no significant differences among dietary treatments. There was significant difference in feed cost per weight gain during 4-6 week and 0-6 week (quadratic, P<0.01, P<0.01, respectively). Also there was significant difference in total feed cost per pig during 4-6 week (linear, P<0.05) and estimated total feed cost to market weight (quadratic, P<0.05). Days to market weight was not changed by dietary tapioca levels. Consequently, tapioca residue can be supplemented up to 9% in finishing pig’s diet without detrimental effects on growth performance, blood profiles and pork quality with lower price of feed.
Key words: Tapioca residue, Finishing pig, Growth performance, Blood
Contents
page Overall Summary ··· i Contents ··· ⅲ List of Tables ··· ⅴ List of Figures ··· ⅶ List of Abbreviations ··· ⅷ Ⅰ. Introduction ··· 1 Ⅱ. Literature Review 1. Introduction ··· 3 2. Alternative feed ingredients ··· 2.1. Characteristic of alternative feed ingredients ··· 4 2.2. Type of alternative feed ingredients ··· 5 3. General information of tapioca ···3.1. Nutrient characteristics in tapioca ··· 8 3.2. Nutrient composition of tapioca ··· 9 3.3. The value of tapioca as a feed ingredient ··· 12
Ⅲ. Effect of Various Levels of Tapioca Residues on Growth Performance,
Blood Profiles, and Pork Quality in Finishing Pigs
Abstract ··· 15
Introduction ··· 17
Materials and Methods ··· 19
Results and Discussion ··· 25
Conclusion ··· 33
Ⅳ. Literature Cited ··· 44
Ⅴ. Summary in Korean ··· 56
List of Tables
Ⅱ. Review of literatureTable 1. General nutrients by region of tapioca ··· 9 Table 2. Comparison to major cereal ingredients ··· 11 Table 3. Mineral contents of corn and tapioca ··· 12 Ⅲ. Experiment
Table 1. Formula and chemical compositions of the experimental diets in phase I (0 to 3 weeks) ··· 34 Table 2. Formula and chemical compositions of the experimental diets in
phase II (4 to 6 weeks) ··· 35 Table 3. Effect of tapioca residue supplementation levels on growth
performance in finishing pigs ··· 36 Table 4. Effect of tapioca residue supplementation levels on blood profiles
in finishing pigs ··· 37 Table 5. Effect of tapioca residue supplementation levels on pork quality of
longissimus muscle ··· 38 Table 6. Effect of tapioca residue supplementation levels on pH after
slaughter ··· 39 Table 7. Effect of tapioca residue supplementation levels on pork color after
slaughter ··· 40 Table 8. Effect of tapioca residue supplementation levels on TBARS in
longissimus muscle ··· 41 Table 9. Effect of tapioca residue supplementation levels on pork fatty acid
composition in longissimus muscle ··· 42 Table 10. Effect of tapioca residue supplementation levels on economic
List of Figures
Ⅰ. Review of Literature
List of Abbreviation
AAFCO Association of American Feed Control Officials
ADFI Average daily feed intake ADG Average daily gain
AOAC Association of official analytical chemists ASF African swine fever
BUN Blood urea nitrogen BW Body weight
CP Crude protein
DDGS Distillers dried grains with soluble FMD Foot and mouth disease
G:F Gain to feed
MUFA Mono unsaturated fatty acid NFE Nitrogen free extract
NRC National research council PKM Palm kernel meal
PUFA Polyunsaturated fatty acid RCB Randomized complete block SAS Statistical analysis system SBM Soybean meal
SFA Saturated fatty acid
TBARS 2-thiobarbituric acid reactive substances USFA Unsaturated fatty acid
I. Introduction
Recently, as price of feed ingredients are continually rising subsequently it caused hot issues in the field of domestic feed industry. In Korea, corn and SBM are using as main ingredients for animal feed and corn accounts for about 60-70% of swine diet. Also approximately 90% of the feed ingredients in swine diet are imported other countries consequently feed cost is comprised of 60-70% in total cost of production in swine industry. In particular, Korea has an excessively high production cost of pigs compared to other advanced countries in swine industry. Therefore, efforts to reduce the cost of production are essential for swine industry in Korea and first of all, reduction of cost should be done in feed cost. Many researchers in the livestock industry focused on various alternative feed ingredients to reduce the cost of animal feed. Alternative feed ingredients, such as copra meal (CM) and palm kernel meal (PKM), may have relatively some advantages to alleviate feed cost compared to corn-SBM based diet although levels of energy and protein are considered. In addition, those ingredients can be produced in large quantities in the area of southeastern asia such as Malaysia and Indonesia.
There are various source of alternative ingredients. By-products can be obtained from a variety of sources such as grain processing, beverages, manufacturing fiber products and production of foods (Ponce and Rernat, 2002; Soukoulis and Aprea, 2012; Hall and Chase, 2014).
Tapioca is a starch extracted from cassava root and is mainly used as an energy source (Wu, 1991; Tzudir et al., 2012). Global
average productivity of tapioca reaches approximately 10 tons/ha and can provide high yields of energy per unit area (Edison, 2007) with relative low price. When tapioca is supplemented in swine feed instead of corn, feed cost can be reduced dramatically. In general, swine feed mainly uses grains such as corn, wheat or barley as energy sources. Tapioca contains high amount of water-soluble carbohydrates and low in protein and fiber (Dominguez, 1990). Tzudir et al. (2012) reported that tapioca is better digested in pigs than corn and can contain up to 50% of swine feed. Tapioca residue have been successfully used in growing pigs by 20-25% (Gomez, 1992). The price of tapioca residue, however, is approximately 20% lower than that of corn.
Therefore, this study was conducted to evaluate various levels of tapioca residue supplementation on growth performance, blood profiles, pork quality and feed cost in finishing pigs.
II. Literature Review
1. Introduction
Raw material prices such as corn and SBM have fluctuated due to various influences such as the US-china trade negotiations ‘small deal’ and China’s purchase of US $ 50 billion US agricultural products. In addition, grain prices can be changed depending on weather forecasts, natural disasters and yields. Currently, Korea is using corn and SBM as its main feed ingredients in swine feed consequently corn is comprised of about 60-70% of the swine feed. As approximately 90% of feed ingredients are imported from other countries, it is important to study alternative raw materials to replace corn and SBM, which are the main raw materials in swine feed.
2. Alternative feed ingredients
2.1 Characteristic of alternative feed ingredients
Feed costs account for about 65% of pork production, making up the largest share in the swine industry and play an important role in determining profitability (Armstrong et al., 2012). Many feed ingredients are currently being researched to replace corn and SBM in feed. These alternative ingredients can help reduce feed costs. Alternative feed ingredients will also be more effective at increasing the price of major feed ingredients such as corn and SBM (DiCostanzo, 2003). Alternative feed ingredients are generally less expensive than corn and SBM and contain compliant energy and protein levels. It also has the advantage of being easy to mass produce in Southeastern Asia. While there are many advantages in terms of economics, nutrition and productivity, there are obvious disadvantages, so it must be careful about use as feed ingredient. The most important point to note is the anti-nutritional factor. Anti-nutritional factors are the most influential factors in feed ingredients that interfere with nutrient digestion and utilization. Alternative feed ingredients generally contain high levels of NSPs, which are a limiting factor in their effective use in monogastric animal considerations. Various alternative feed ingredients have potential benefits in terms of cost savings and nutrients, which are produced in the food industry (DiCostanzo, 2003). The by-products from food industry can gradually replace many parts of the nutrient supply in swine feed (Stein, 2007). The proper amount to use for a swine diet depends on the cost, quality and supply. Its quality includes amino acid
profile, digestibility, antinutritional factors, storage conditions and palatability (Bogges et al., 2007).
2.2 Type of alternative ingredients
1) Palm kernel meal
Palm kernel meal (PKM) is a by-product of extraction of oil palm. PKM contain about 17-21% protein content, 10-17% crude fiber content, 4-5% crude ash and 0.7-0.9% ether extract content (Nwokolo et al., 1976). PKM has similar energy and protein content as corn and SBM (Nwokolo et al., 1976). However, PKM has high fiber content and low palatability, but high methionine and cystine content. Kim et al. (2001) reported that supplementation of PKM in swine diets interfere growth performance. Chandrasekaiah et al. (2001) reported that PKM widely used in ruminant animal feed. Also PKM can replace corn and SBM in swine diet.
2) Copra meal
Copra meal is a by-product of the production of coconut oil. Copra meal are known to account for 59% of global production in Indonesia and the Philippines (Feed resource handbook, 2011). Recently, a large amount of copra meals are imported to korea. In 2009, 379 thousand tons were imported and used for cattle feed. The protein content of copra meal is low, about 21-24%, with lysine being the limiting amino acid and containing sulfur amino acids being particularly
low (Sundu et al., 2009). Thorne et al. (1988) reported that the amino acid balance of copra meal to be far from ideal with being deficient. Thorne et al. (1988) reported that there was a linear reduction in daily weight gain as the copra meal level increased.
3) Rapeseed meal
Rapeseed meal is a by-product remaining from squeezing rapeseed oil. Rapeseed is much higher than soybean content (about 18%) and contains about 40-50% fat. The protein content of rapeseed is 34-38% and the crude fiber content is 10% (Mawson et al., 1993). The amino acid composition of rapeseed meal is good and high in methionine and low in lysine, so it can be expected to be complementary to each other when used together with SBM (Sarwar et al., 1975). Rapeseed meal contains glucosinolates, an anti-nutritional factor. Pigs are more susceptible to rapeseed meal toxicity than other animals, making it difficult to use in weaning pigs and pregnant sow. Excessive supplementation of rapeseed meal with high glucosinolate content in pregnant sows reduces litter size and birth weight and it is known to be difficult to use more than 3% because it causes other pregnancy and lactation disorders.
4) Distillers dried grains with soluble (DDGS)
In recent years, the biggest change in plant protein production and supply worldwide is the emergence of DDGS (Feed resource handbook, 2011). According to the The Association of American Feed Control Officials (AAFCO), corn-DDGS is produced through the
production of bio-fuel from corn. DDGS is obtained by fermenting grains or mixed grains with yeast, followed by distillation and separation of ethanol. It is defined as a product in which more than 75% of solids are concentrated and dried in the fermentation and distillation process. DDGS is available for supplementation in diets fed to swine (Stein, 2007). It has become the famous and economical alternative feed ingredient for use in animal diets not only for pig, but also poultry and ruminant animal diet (Stein, 2007). DDGS has low lysine content and tryptophan is second limiting amino acid after lysine, so it should be careful when using more than 10% in swine diets (Shurson, 2007). Shurson. (2007) reported that DDGS can be supplemented to pig diets without negative effects on growth performance and pork quality.
5) Tapioca
Tapioca is a starch extracted from cassava root and is mainly used as an energy source (Wu, 1991; Tzudir et al., 2012). Tapioca has a global average productivity of 10 tons/ha and can provide high yields of energy per unit area (Edison, 2007). Therefore, tapioca can reduce the high burden on feed costs for farmers as an energy source for swine feed. In general, swine feed uses grains such as corn, wheat or barley as energy sources. Tapioca is high in water-soluble carbohydrates and low in protein and fiber (Dominguez, 1990). Tzudir et al. (2012) reported that tapioca is better digested in pigs than maize and can contain up to 50% of swine feed.
Tapioca residue is a by-product of making tapioca starch. It has high starch extracted from cassava root and is mainly used as an
energy source (Wu, 1991; Tzudir et al., 2012). Tapioca residue have been successfully used in growing pigs by 20-25% (Gomez, 1992).
3. General information of tapioca
3.1 Nutrient characteristics of tapioca
Tapioca is promising as an energy feed source because its main component is starch. Tapioca is used in food, especially in the form of starch and for animal feed because it is very rich in starch (Gomez, 1992; Liu et al., 2006). Tapioca contains about 80% NFE and 38% starch, so it is highly digestible by animals. Silva et al. (2008) reported that all livestock could receive tapioca in diets because of its energy and palatability. However, tapioca has a very low protein content, and the composition of amino acids is also out of balance (Armbawehla et al., 1975). Also it lacks calcium and P and is known to be low in carotene. Cassava is widely grown crop in most countries and ranks as one of the main crops in tropical countries (Calpe, 1992). Since HCN remains in the tapioca powder and there may be a phosphate inhibitory factor present in the outer portion of the tapioca tuber, such a substance may be a growth inhibitory factor. Tapioca masses contain 0.01-0.04% of linamarin, a glucoside, which is decomposed by linamarase to liberate HCN. Therefore, it should be noted that various problems may occur because tapioca contains HCN, which is toxic to animals. However, this problem can be solved by feeding methionine with tapioca (Feed resources handbook, 2011). Feeding methionine or
inorganic sulfur (Na2SO4) with tapioca is involved in HCN
detoxification and prevents growth inhibition in animals. Tapioca residue recently started to be used in Korea are by-products extracted by simple centrifugation without any chemical action. Tapioca by-products are superior in all ingredients and stability except for higher fiber content than general tapioca.
3.2 Nutrient composition of tapioca
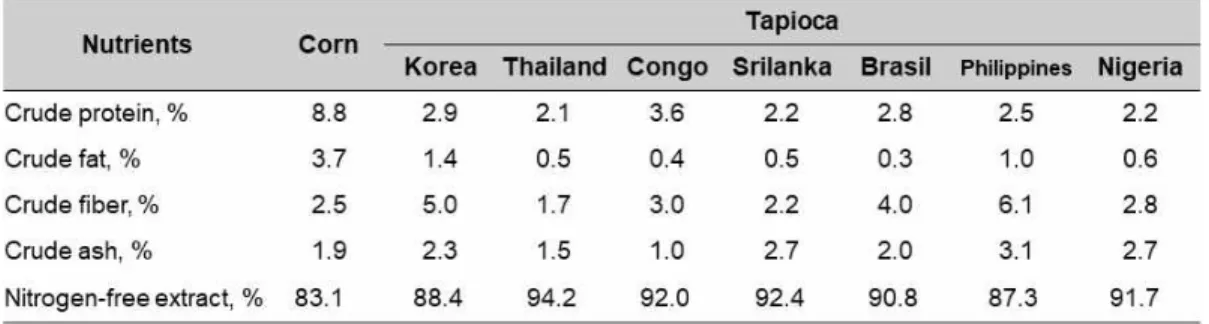
The dried roots or pellets of tapioca are placed in the same category, and they are called tapioca. The proximate analysis of tapioca varies from study to study. This is because the variety of tapioca produced is different and the breed and conditions for breeding are different.
Table 1. General nutrients by region of tapioca (Feed resources handbook, 2011).
The metabolizable energy (ME) levels of tapioca have been presented with values ranging from 3,000-3,200 kcal/kg (Buitrago et al., 2002), 3,200 kcal/kg (Egena, 2006), 3,145 kcal/kg (Khajarern and
khajarern, 2007) and 3,279 kcal/kg (Olugbemi et al., 2010). CP content of tapioca is 2.1-3.6% per dry matter, 60% of total nitrogen is in amino acid form, 1% is nitrite and HCN nitrogen, and the rest is unknown (Ngiki et al., 2014).
Tapioca is composed almost of carbohydrate, as well as 1% to 3% CP (Stupak et al., 2006). Tapioca is low in protein and the protein it has poor quality with low essential amino acid (Olugbemi et al., 2010). The protein content of cassava flour, peels and leaves is low at about 3.6%, 5.5% and 21%, respectively (Iyayi and losel, 2001). Nagib and Sousa. (2007) reported that the total amino acid content of tapioca is about 0.254g per 100g and lysine is about 0.010 g per 100g. Tapioca has a high arginine content but low in methionine, isoleucine, phenylalanine, proline and cysteine content (Onwueme, 1978).
Tapioca has a very low lipid content. Tapioca contains about 0.1% lipids, compared with corn which has approximately 6% (Gomes et al., 2005). Hudson and Ogunsua. (1974) reported that flour of tapioca contains about 2.5% lipids, but only half of this is extractable with conventional solvent systems and the fatty acids in tapioca are primarily saturated. Tapioca has low levels of vitamin A, B1, B2 and
niacin but high levels of vitamin C (Onwueme, 1978).
Tapioca contains about 17% amylose and 83% amylopectin, compared with corn starch which has about 28% amylose and 72% amylopectin (Promthong et al., 2005). Amylopectin can form resistant starch but it is a slower and less stable (Tongta et al., 2007). Tongta et al. (2007) reported that high resistant starch in tapioca was likely because it is composed of about 82.85% amylopectin and 17.25%
amylose.
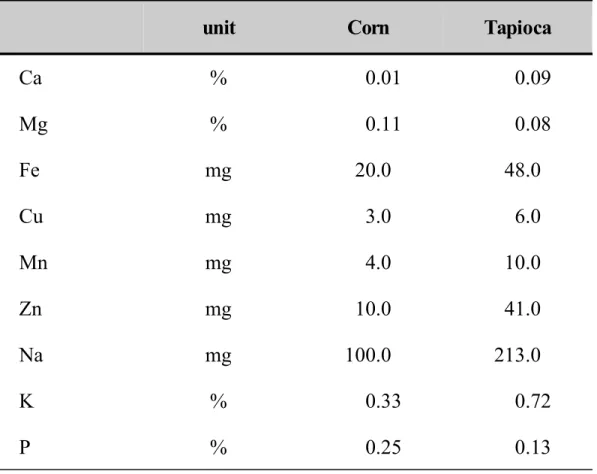
Table 3. Mineral contents of corn and tapioca
unit Corn Tapioca
Ca % 0.01 0.09 Mg % 0.11 0.08 Fe mg 20.0 48.0 Cu mg 3.0 6.0 Mn mg 4.0 10.0 Zn mg 10.0 41.0 Na mg 100.0 213.0 K % 0.33 0.72 P % 0.25 0.13
3.3 The value of tapioca as feed ingredient
Tapioca can be added up to 10-12% when used without bromide in broiler or herbivorous feed (Feed resource handbook, 2011). Mcmillan and Dudley. (1941) reported that inclusion of tapioca in poultry diets reduced performance. However recent studies, such as Aderemi et al. (2000), Khajarern and Khajarern. (1992) and Tewe and Egbunike (1992) found more encouraging results and how to balance the impact of HCN. Feed intake of tapioca supplemented diet is limited
in poultry because it is less palatable due to dust and volume. This problems can be alleviated by processing the tapioca diets through pelleting or fat to improve texture. Feed conversion and growth performance were lower when tapioca was fed in mash form. but similar growth performance was observed when tapioca diet was pelleted (Muller et al., 1974; Oke, 1978). Some researchers reported that tapioca residue can be fed to broilers up to 50% without negative effect on growth performance (Eshiett and Ademosun, 1980; Stevenson and Jackson, 1983; Ekpenyong and Obi, 1986). Gomez et al. (1983) reported that growth performance of broilers fed 200g/kg tapioca residue was similar to that of broilers fed corn based diets. Ezeh and Arene. (1994) reported that tapioca residue can replace up to 75% of corn, resulting in a cost benefit against corn.
The allowable level of tapioca that can be used for laying hen diet varies greatly from study to study in the 30% to 50% range (Garcia et al., 1994; Eustace and Olumide, 1994; Enyenihi et al., 2009; Tesfaye et al., 2014). Corn and tapioca have similar effects on laying rate and egg quality (Natalie and Mingan, 2016). Egg yolk color score to be lower in eggs from layer fed diets containing tapioca (Saparattananan et al., 2005). Khajarern and Khajarern. (2007) reported that tapioca products are deficient in carotene and most carotenoids, meaning supplementation of these ingredients is required in tapioca based diets for maintenance of normal egg yolk. Raphael et al. (2013) reported that replacing corn with tapioca residue in diets had no negative effect on feed intake, egg production, production cost and egg weight.
Fewer studies have been conducted in pig compared with poultry. Park et al. (2015) reported that dietary supplementation of PKM with tapioca could compensate anti-nutritional effect of PKM on the growth performance in growing-finishing pigs. It indicates the PKM with tapioca could be a alternative energy source to reduce feed cost (Park et al., 2015). Tapioca residue can be supplemented in the diet of growing pigs up to a level of 50% for economizing the pig production (Tzudir et al., 2012).
Ⅲ. Effect of Various Levels of Tapioca Residues
on Growth Performance, Blood Profiles, Pork
Quality and Feed Cost in Finishing Pigs
ABSTRACT: This study was conducted to evaluate different levels of
tapioca residue supplementation on growth performance, blood profiles, pork quality and feed cost in finishing pigs. A total of 140 finishing pigs ([Yorkshire × Landrace] × Duroc) with an average body weight of 69.22 ± 3.985kg, were used for 6 weeks feeding trial. Pigs were allotted into one of four treatments by body weight and sex in a randomized complete block (RCB) design. The treatments were included 1) Corn-SBM based diet (T0), 2) Corn-SBM based diet + 3% of tapioca residue (T3), 3) Corn-SBM based diet + 6% of tapioca residue (T6) and 4) Corn-SBM based diet + 9% of tapioca residue (T9). In feeding trial, there were no significant differences on body weight (BW), average daily gain (ADG) and average daily feed intake (ADFI). However, during late finishing period (4-6 weeks) and whole finishing phase (0-6 weeks) G:F ratio showed quadratic response (quadratic, P<0.01, P<0.01 respectively). The ADFI tended to increase linearly with increasing levels of tapioca residue in diet during late finishing period (linear, P<0.08). Blood profiles were not affected by dietary levels of tapioca residue. In proximate analysis of longissimus muscle, crude ash was decreased linearly with increasing tapioca residue levels (linear, P<0.05). Moisture, CP and crude fat were not affected by dietary
tapioca treatments. In addition, significant differences were not observed on water holding capacity (WHC), cooking loss and shear force by dietary levels of tapioca residue. There were no significant differences in pH of pork and meat color. There were significant differences in TBARS values between 3rd and 7th storage periods although all of the values were within the normal range. In fatty acid composition, there were no significant differences among dietary treatments. There was significant difference in feed cost per weight gain during 4-6 week and 0-6 week (quadratic, P<0.01, P<0.01, respectively). Also there was significant difference in total feed cost per pig during 4-6 week (linear, P<0.05) and estimated total feed cost to market weight (quadratic, P<0.05). Days to market weight was not changed by dietary tapioca levels. Consequently, tapioca residue can be supplemented up to 9% in finishing pig’s diet without detrimental effects on growth performance, blood profiles and pork quality with lower price of feed.
Key words : Tapioca residue, Finishing pig, Growth performance,
Introduction
Recently, the swine industry in Korea is facing many difficulties. There are many problems and damages caused by diseases such as foot and mouth disease (FMD) and african swine fever (ASF), but above all, the cost of production is ridiculously higher than other countries for a long time. In Korea, corn and SBM are using as main ingredients for animal feed and corn accounts for about 60-70% of swine diet. Also approximately 90% of the feed ingredients in swine diet are imported other countries consequently feed cost is comprised of 60-70% in total cost of production in swine industry. Therefore, many researches on alternative feed ingredients are needed to conduct for reducing cost of production.
Among many alternative feed ingredients, tapioca has several advantages, First of all, it can be easily mass-produced, and is expected to be a potential raw material that can completely replace corn as a source of energy in swine feed. Tapioca is believed to represent the future of food security in some developing countries (Morgan and Choct, 2016). Tapioca production in the world was increased by 4.6% between 2013 and 2014 and the main countries producing tapioca was Nigeria, Brazil, Indonesia, Congo and Thailand (FAO, 2014). Tapioca production has been increasing steadily since the 1960s but between 1997 and 2007 its production increased by over 40%, and its use in animal feed increased by 76 million tones (FAO, 2014).
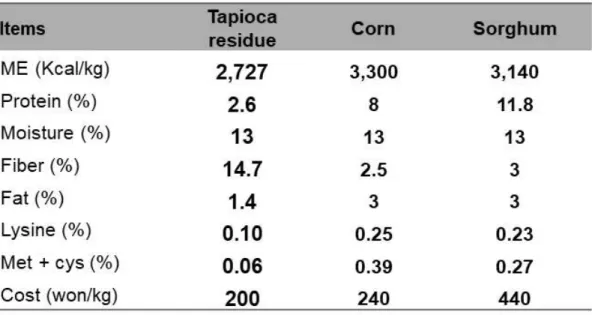
used as an energy source in animal feed (Wu, 1991; Tzudir et al., 2012). Tapioca has a global average productivity of 10 tons/ha and can provide high yields of energy per unit area (Edison, 2007) with a cheap price compared to corn. Therefore, tapioca can reduce the high burden on feed cost for farmers as an energy source for swine feed. In general, swine feed uses grains such as corn, wheat or barley as energy sources. Tapioca is high in water-soluble carbohydrates and low in protein and fiber (Dominguez, 1990). Tzudir et al. (2012) reported that tapioca is better digested in pigs than corn and can contain up to 50% of swine feed. Tapioca residues have been successfully used in growing pigs by 20-25% (Gomez, 1992). In addition, as of October 2019, corn costs 240 won and wheat costs 250 won, while tapioca residue cost 200 won.
Consequently this experiment was conducted to investigate various levels of tapioca residue supplementation on growth performance, blood profiles, pork quality and feed cost in finishing pigs.
Materials and Methods
Experimental animals and management
A total of 140 finishing pigs ([Yorkshire × Landrace] × Duroc) with an average body weight of 69.22 ± 3.985 kg were used for 6 weeks feeding trial at experimental swine farm. Experimental period was consisted with 2 phases, phase 1 is 0-3 week, phase 2 is 4-6 week. All pigs were housed in an environmentally controlled building with fully-concrete floor facility (2.60 x 2.84m2) during the whole experimental period. Each pen was equipped with a feeder and a nipple drinker to provide ad-libitum access.
Experimental design and diets
Experimental pigs were allotted to one of four treatments by BW and sex in 5 replications with 7 pigs per pen in a randomized complete block (RCB) design. Dietary treatments were: 1) T0 : corn-SBM based diet, 2) T3 : corn-SBM based diet with tapioca residue 3%, 3) T6 : corn-SBM based diet with tapioca residue 6% and 4) T9 : corn-SBM based diet with tapioca residue 9%. All nutrients were met or exceeded the requirement of NRC (2012). The concentrations of lysine and methionine in experimental diet were formulated to meet or exceed the requirement of NRC (2012). Experimental diets formula and chemical compositions were presented in Tables 1 and 2.
Growth performance
BW and feed intake were recorded at 0, 3 and 6 week after starting of experiment to calculate the ADG, ADFI and G:F ratio.
Blood sampling and analysis
Blood samples were taken from the jugular vein of randomly selected 4 pigs in each treatment for measuring blood urea nitrogen (BUN), total cholesterol, creatinine, and glucose. Blood collection was performed at initial and at the end of each phase in experiment. Collected blood samples were quickly centrifuged for 15 min by 3,000 rpm at 4℃ (Eppendorf centrifuge 5810R, Germany). Then, the sera were transferred to 1.5 ml plastic tubes by pipette and stored at –20℃ until later analysis. Total BUN, total cholesterol, creatinine, and glucose concentration was analyzed using blood analyzer (Cobas 8000, Roche, Germany).
Carcass traits
At the end of experiment, 4 pigs from each treatment were slaughtered and pork samples were collected from nearby 10th rib of carcass. Because of chilling procedure, 30 minutes after slaughter was regarded as initial time. The pH was measured at 0, 3, 6, 12 and 24 hour after initial time. The meat color were measured at 3, 6, 12 and 24 hour after initial time. The pH was determined by pH meter (Model, Themo Orion, USA) and meat color was determined by CIE color L*, a* and b* value using a CR300 (Minolta Camera Co., Japan). Proximate analysis of pork samples were analyzed by the
method of AOAC (2005).
Pork quality
Centrifuge method was used for measuring WHC of pork (Abdullah and Najdawi, 2005). Pork samples were collected in filter tube, and heated in water bath at 80℃ for 20 min and centrifuged for 10 min at 2,000 rpm and 10℃ (Eppendorf centrifuge 5810R, Germany). To calculate the cooking loss, pork samples were packed with polyethylene bag and heated in water bath until core temperature reached 72℃ and weighed before and after cooking. Then samples were cored (0.5 inch in diameter) parallel to muscle fiber and used to measure the shear force (Warner Bratzler Shear, USA). Cooking loss, shear force, water holding capacity of pork sample were analyzed by the laboratory animal origin of food science, Seoul National University.
TBARS Assay
The extent of lipid oxidation was measured for the 2-thiobarbituric acid reactive substances (TBARS) value by using a spectrophotometer (X-ma 3100, Human Co. Ltd., Seoul, Korea). Each sample (5 g) was homogenized with 15 mL of DDW and 7.2% butylated hydroxyl toluene in ethanol at 9,600 rpm for 30 seconds (T25, Ika Works, Staufen, Germany). After homogenization, 2 mL of the homogenates were transferred to 15 mL falcon tubes. Then added 4 mL of 20 mM TBA in 15% TCA. The tubes were heated in a laboratory water bath at 90°C for 30 min, and centrifuged at 2,265 for 15 min (HM-150IV, Hanil Co. Ltd., Incheon, Korea). The samples
were measured before and after cooking boiled in water bath at 90°C for 8 min. The absorbance of supernatant was measured at 532 nm. The TBARS value was expressed as mg MDA/kg.
Fatty acid composition
Lipids in pork sample (10 g) were extracted with 100 mL of chloroform/methanol (2.1, v/v) (Folch et al., 1957) and shaking incubator (25℃, 120 rpm) for 24 hours. Extracted lipids filtered with filter paper (WhatmanTM No.4, Buckinghamshire, UK). Twenty five mL of 0.88 % NaCl was added in the filtered sample and centrifuging at 2,090×g for 10 min (Continent 512R, Hanil Co., Ltd., Incheon, Korea). The supernatant was separated and concentrated pork lipids using N2
gas at 45℃. After concentrating the lipids, 0.1 g was weighted into a 15 mL tube with 1 mL of internal standard (1 mg of undecanoic acid in 1 mL of iso-octane) and 1.5 mL of 0.5 N methanolic NaOH. The samples were heated in the water bath at 85°C for 10 min and cooled at room temperature. After cooling, 2 mL of 14% BF3-methanol was added and then repeated heating process one more time. After then, 2 mL of iso-octane and 1 mL saturated NaCl was added, centrifuged at 2,500 rpm for 3 min (Continent 512R, Hanil Co., Ltd., Incheon, Korea). Upper layer containing fatty acid methyl ester(FAME) was dehydrated with anhydrous sodium sulfate and transferred to a vial. Analyzed the vial using a gas chromatograph (HP 7890, Agilent Technologies, Santa Clara, CA, USA) with a split ratio (50:1). A capillary column (DB-23, 60 m x 250 μm x 0.25 μm, Agilent, Santa Clara, CA, USA) was used. The injector and detector temperatures were
maintained at 250°C and 280°C, respectively. The column oven temperature were as follows: 50°C for 1 min, increased to 130°C at 25°C/min, 170°C at 8°C/min, then held at 215°C at 1.5°C/min. Nitrogen was used as a carrier gas at linear flow of 4 mL/min. Individual FAME was identified by comparison of the relative retention times of peaks from samples, with those of the external standards (37 FAME mix and CLA mix, Supelco, Bellefonte, PA, USA) calculated based on the Korean Food Standards Codex (MFDS, 2017).
Chemical Analyses
Diets were ground by a Cyclotec 1093 Sample Mill (Foss Tecator, Hillerod, Denmark) and ground diets were analyzed. All analyses were performed in duplicate samples and analyses were repeated if results from duplicate samples varied more than 5% from the mean. Experimental diet was analyzed for contents of dry matter (procedure 930.15; AOAC, 1995), crude ash (procedure 942.05; AOAC, 1995), ether extract (procedure 920.39; AOAC, 1995), N by using the Kjeldahl procedure with Kjeltec (KjeltecTM 2200, Foss Tecator, Sweden).
Economic analysis
As the experimental pigs were reared in the same environmental condition, economic analysis was calculated using the feed cost without considering other factors. The total feed cost (won) per body weight gain (kg) was calculated by using amount of the total feed intake and feed price. The feed cost per weight gain was calculated based on
price of raw materials during the time of the experiment. The days to market weight (110 kg) were estimated from the body weight at the end of feeding trial and ADG of phase 2.
Statistical analysis
The experimental data were analyzed as a randomized complete block (RCB) design using the general linear model (GLM) procedure of SAS. For data on growth performance and economic analysis a pen was considered as an experimental unit, while individual pig was used as an unit for data on blood profile, pork quality and carcass traits. Linear and quadratic effects for equally spaced treatments were assessed by measurement of orthogonal polynomial contrast. The differences were declared significant at P<0.05 or highly significant at P<0.01.
Results and Discussion
Growth performance
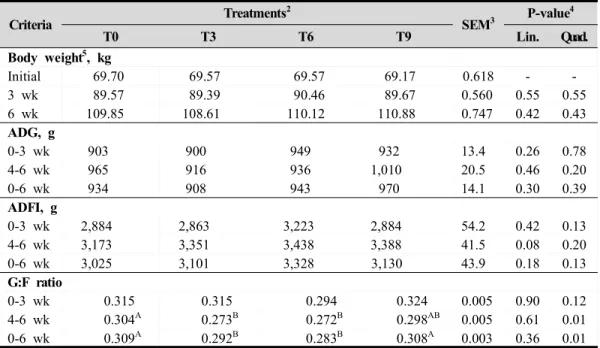
The effect of tapioca residue supplementation in finishing diet on growth performance was presented in Table 3. During the whole feeding trial, there were no significant differences in the BW, ADG, ADFI among treatments. During late finishing period (4-6 weeks) and whole finishing phase (0-6 weeks), whereas G:F ratio showed quadratic response (quadratic, P<0.01). The ADFI tended to increase linearly with increasing levels of tapioca residue in diet during late finishing period (linear, P=0.08), but there was no significant effect on ADFI in the early finishing period.
In previous studies, ADG was improved when 25% or 50% of corn in the feed was replaced with tapioca residue and replaced with 50% of tapioca residue treatment showed significantly higher ADG then 25% of tapioca residue treatment (Tzudir et al., 2012). In addition, some researchers have reported improved ADG by adding tapioca residue to swine diet (Aumaitre, 1969; Chou et al., 1975; Wu, 1991; Thi et al., 1997; Ngoan and Ly, 2007). Results of these previous studies demonstrated that high availability of nutrients in distributions containing tapioca roots consequently the starch of tapioca is better digested in pig compared to corn (Kanto et al., 2009).
However, in present study, there was no significant difference in ADG regardless of dietary treatments. According to Tewe et al. (1986) and Jimenez et al. (2005), it has been reported that supplementation of tapioca residue in growing-finishing pig diet had no effect on ADG and
ADFI. The present experiment was also demonstrated that ADG was not improved by supplementation of tapioca residue in the finishing pigs.
Muller et al. (1974) reported that when cereals in swine feed were replaced with tapioca, ADFI was improved and pigs were easily accepted and palatable. Chou et al. (1975) reported that feed intake increased when feeding tapioca containing feeds. However, other experiments represented that higher ADFI was not observed by supplementation of tapioca residue in growing-finishing diet (Tewe et al., 1986; Thi et al., 2000; Jemenez et al., 2005).
Tzudir et al. (2012) reported that the supplementation of tapioca residue did not show a significant difference in G:F ratio. Other previous studies have shown similar results in G:F ratio (Tewe et al., 1986; Thi et al., 2000; Jimenez et al., 2005). However in present study, there was significant difference in G:F ratio during late finishing period (4-6 weeks) and whole finishing phase (quadratic, P<0.01). These results demonstrated that G:F ratio was decreased due to the fact that high ADFI was observed in T3 and T6 treatments.
Consequently, there were no negative effects on growth performance by supplementation of tapioca residue and it might be supplemented up to 9% in diet of finishing pigs.
Blood profiles
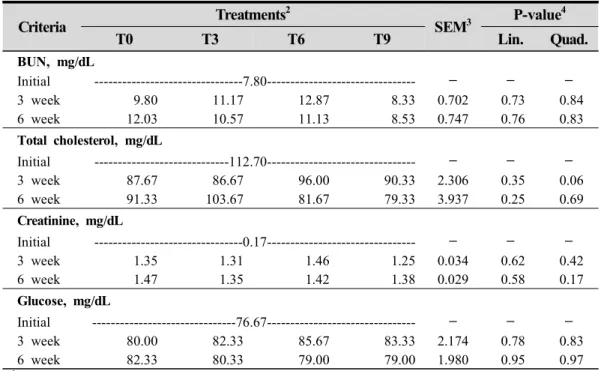
The effect of tapioca residue supplementation levels on blood profiles such as BUN, total cholesterol, creatinine and glucose were presented in Table 4. During whole period, there was no significant
difference in BUN, total cholesterol, creatinine and glucose. However, total cholesterol concentration at 3 week tend to increase as tapioca residue supplementation level increased (quadratic, P=0.06).
The serum BUN concentration usually used as an indicator of excessive amino acids which are inefficiently used in body and released into the blood (Jeong et al., 2010). The BUN concentration is directly related to protein intake and quality and is known to be associated with the maintenance of nitrogen intake (Whang and Easter, 2000). However, the result of this study represented that serum BUN concentration was not changed by tapioca residue treatment. Consequently it meant there was no difference of excessive amino acid between tapioca residue and corn supplementation in swine diet.
Dietary fiber can be a source of short-chain fatty acids in gastrointestinal tract and it supplied energy requirement of about 7-30%, depending on the type and age of the pig or the feeding method (Kass et al., 1980). Fibers are fermented by microorganisms in colon to produce short-chain fatty acids, and most of the short-chain fatty acids absorbed by the large intestine are known as acetates, which are precursors of endogenous cholesterol synthesis. Wheeler et al. (1987) reported that the carcass fat and lipid contents of the longissimus muscle were correlated with the concentration of serum cholesterol. Also Arave et al. (1975) reported that serum cholesterol concentrations increased as energy intake increased. However, no significant difference in total cholesterol was found in this experiment.
Blood creatinine is used as an index of calculating body muscle content presuming body muscle content because it is released into
blood in amounts proportional to muscle content (Rassin and Bhatia, 1992). Blood creatinine has a positive correlation with total muscle in body (Baxmann, 2008). Creatinine is a nonprotein nitrogenous compound in the blood and is the final metabolite produced by non-enzymatic dehydration from creatinine in muscle. However, creatinine contents was not changed by dietary treatments in this study. Therefore, the present experiment concluded that there was no difference muscle production of finishing pigs by tapioca residue or corn in diet.
When the glucose uptake increased by insulin sensitive cells, this additional energy is fuel for protein synthesis, providing support to the tissue growth and to the cell maintenance (Anderson and Kolozlovsky, 1985). However, any difference was not detected in this study.
In conclusion, supplementation of tapioca residue in finishing pig diet had no negative effect on blood profiles.
Carcass traits
The effect of tapioca residue supplementation levels on carcass traits was presented in Table 5. In this study, significant differences were not found in moisture, CP and crude fat by dietary tapioca residue treatment. However, crude ash concentration was decreased as tapioca residue supplementation level increased (linear, P=0.03).
In physiochemical property such as cooking loss, shear force and WHC, any significant difference was not detected by supplementation levels of tapioca residue.
on pork quality when adding tapioca residue in finishing pig diet. Crude ash was effected by many factors in feed ingredients and fat concent in pork (Olsson et al., 2003; Daszkiewicz et al., 2005). In this study, crude ash content was lowered in tapioca residue inclusion treatments and control. The content of crude ash indicated an evolutionary tenderness when crude ash content increased (Okrouhla et al., 2008). Physicochemical analysis of pork showed no significant difference in cooking loss and shear force. It is known that peat quality was determined by important parameter that such as WHC, cooking loss and shear force (Lee et al., 2000).
Park et al. (2015) reported that WHC, cooking loss and shear force were not affected by supplementation of tapioca residue in finishing pig diet. Similar results were observed in present study that proximate analysis and physiochemical property were not affected by supplementation of tapioca residue.
Pork quality
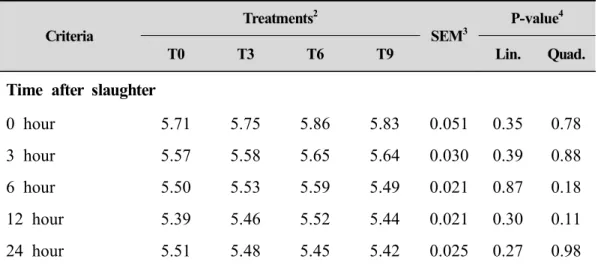
The effect of tapioca residue supplementation levels on pork quality of longissimus presented in Tables 6 and 7. In this study, No significant differences were observed in L*, a*, b* value and pH at 24h after slaughter when pigs were fed different levels of tapioca residue supplementation (P>0.05).
There was no negative effect in pH by tapioca residue supplementation (Park et al., 2015). Brewer and McKeith. (1999) reported that change of pH value would be an important factor that determined pork quality. Palansky and Nosal (1991) reported that pH
levels are closely related to pork quality, WHC and tenderness. Palansky and Nosal (1991) reported that the loss of heating decreased with increasing pH.
Bendall and Wismer (1962) reported that increasing yellowness and decreasing redness of pork resulted in a decrease in freshness of pork. The L* value increased by the increased reflection of light due to exudation of water. The elevation of L* value can improve some visual attributes providing higher lightness (Suarez et al., 2016). The b* value has been related to marbling (Suarez et al., 2016). Similarly, elevated crude fat of pork was contributed to increasing Hunter b* value. There was no negative effect in meat color by tapioca residue supplementation (Park et al., 2015).
Consequently, supplementation of tapioca residue in swine diet had no negative effect on pH and pork color.
Lipid oxidation (TBARS)
The effect of tapioca residue supplementation levels on TBARS analysis in Table 8. There were significant differences in TBARS values by dietary levels of tapioca residue at day 3 and 7, but observed TBARS values of all treatments were within the normal range, indicating no negative effects. The TBARS value was indicator for lipid oxidation in meat and meat products, and this related to meat quality deterioration such as color, flavor, texture, and nutritive value (Jakobsen and Bertelsen, 2000). TBARS is an index of oxidation rate (McMillin, 2008). Increasing the unsaturated fatty acid (USFA) in meats induced higher oxidative deterioration.
In present study, the value of TBARS tended to increase as the level of tapioca residue increased. This result meant that there was no significant effect on TBARS values by dietary level of tapioca residue.
Fatty acid composition
The effect of tapioca residue supplementation levels on fatty acid composition was presented in Table 9. There were no significant differences in individual fatty acid, saturated fatty acid (SFA), unsaturated fatty acid (USFA) and USFA/SFA ratio. In monogastric animal, change of diet could affect fatty acid composition in pork (Enser et al., 2000; Teye et al., 2006; Wood et al., 2008). Contrary to previous studies, the present experiment demonstrated that fatty acid composition was not changed by dietary levels of tapioca residue.
Economic analysis
The effect of tapioca residue supplementation levels on feed per weight gain, total feed cost per pig, estimated fee cose to 110 kg and days to market weight were presented in Table 10. There was significant difference in feed cost per weight gain during 4-6 week and 0-6 week (quadratic, P<0.01, P<0.01, respectively). Also there was significant difference in total feed cost per pig during 4-6 week (linear, P=0.04) and estimated total feed cost to market weight (quadratic, P=0.03). The reason for the high cost of T3 and T6 treatment in this experiment may be attributed to high ADFI subsequently the feed cost increased as the level of tapioca residue increased in T3 and T6
Conclusion
During the whole feeding trial, there were no significant differences in BW, ADG, ADFI among treatments. During late finishing period (4-6 weeks) and whole finishing phase (0-6 weeks) G:F ratio showed quadratic response (quadratic, P<0.01). Blood profiles showed the normal ranges regardless of supplementation of tapioca residue during the whole experimental period. There were no detrimental effects on carcass traits and pork quality although tapioca residue was supplemented up to 9% in finishing pig diets. There was significant difference in total feed cost per pig during 4-6 week (linear, P=0.04) and estimated total feed cost to market weight (quadratic, P=0.03).
Consequently, this experiment demonstrated that supplementation of tapioca residue in diets of finishing pigs did not show negative responses in growth performance, blood profile and pork quality.
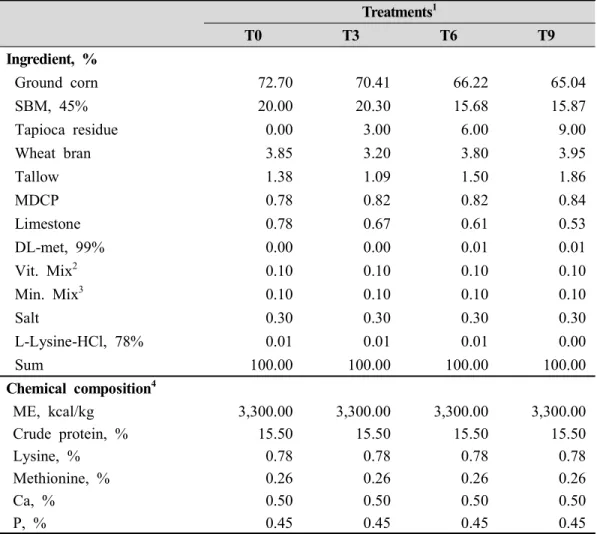
Table 1. Formula and chemical compositions of the experimental diets in phase I (0 to 3 weeks). Treatments1 T0 T3 T6 T9 Ingredient, % Ground corn 72.70 70.41 66.22 65.04 SBM, 45% 20.00 20.30 15.68 15.87 Tapioca residue 0.00 3.00 6.00 9.00 Wheat bran 3.85 3.20 3.80 3.95 Tallow 1.38 1.09 1.50 1.86 MDCP 0.78 0.82 0.82 0.84 Limestone 0.78 0.67 0.61 0.53 DL-met, 99% 0.00 0.00 0.01 0.01 Vit. Mix2 0.10 0.10 0.10 0.10 Min. Mix3 0.10 0.10 0.10 0.10 Salt 0.30 0.30 0.30 0.30 L-Lysine-HCl, 78% 0.01 0.01 0.01 0.00 Sum 100.00 100.00 100.00 100.00 Chemical composition4 ME, kcal/kg 3,300.00 3,300.00 3,300.00 3,300.00 Crude protein, % 15.50 15.50 15.50 15.50 Lysine, % 0.78 0.78 0.78 0.78 Methionine, % 0.26 0.26 0.26 0.26 Ca, % 0.50 0.50 0.50 0.50 P, % 0.45 0.45 0.45 0.45 1
T0 : Tapioca residue 0%, T3 : Tapioca residue 3%, T6 : Tapioca residue 6%, T9 : Tapioca residue 9%.
2 Provided the following quantities of vitamins per kg of complete diet : vitamin A, 7,960 IU;
vitamin D3, 1,592 IU; vitamin E, 32 IU; thiamine, 3 mg; riboflavin, 3.2 mg; calcium pantothenic acid, 8 mg; niacin, 46 mg; pyridoxine, 5 mg; biotin, 0.25 mg; folic acid, 0.5 mg; vitamin B12, 12 μg.
3
Provided the following quantities of minerals per kg of complete diet : Se, 0.1 mg; I, 0.3 mg; Mn, 24.8 mg; CuSO4, 24.80 mg; Fe, 54.1 mg; Zn, 84.7 mg; Co, 0.3 mg.
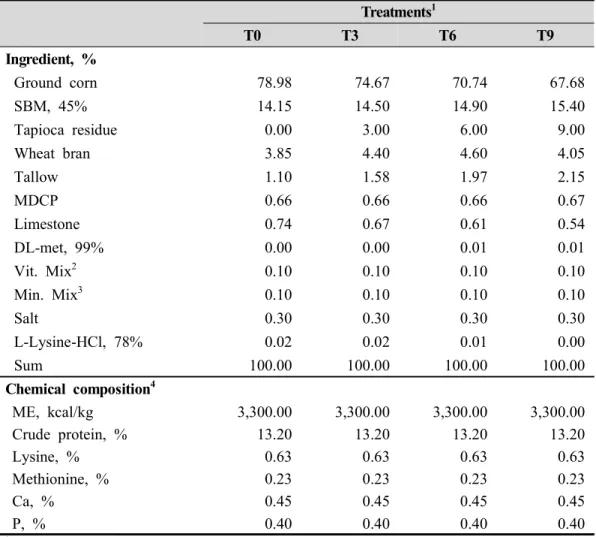
Table 2. Formula and chemical compositions of the experimental diets in phase II (4 to 6 weeks). Treatments1 T0 T3 T6 T9 Ingredient, % Ground corn 78.98 74.67 70.74 67.68 SBM, 45% 14.15 14.50 14.90 15.40 Tapioca residue 0.00 3.00 6.00 9.00 Wheat bran 3.85 4.40 4.60 4.05 Tallow 1.10 1.58 1.97 2.15 MDCP 0.66 0.66 0.66 0.67 Limestone 0.74 0.67 0.61 0.54 DL-met, 99% 0.00 0.00 0.01 0.01 Vit. Mix2 0.10 0.10 0.10 0.10 Min. Mix3 0.10 0.10 0.10 0.10 Salt 0.30 0.30 0.30 0.30 L-Lysine-HCl, 78% 0.02 0.02 0.01 0.00 Sum 100.00 100.00 100.00 100.00 Chemical composition4 ME, kcal/kg 3,300.00 3,300.00 3,300.00 3,300.00 Crude protein, % 13.20 13.20 13.20 13.20 Lysine, % 0.63 0.63 0.63 0.63 Methionine, % 0.23 0.23 0.23 0.23 Ca, % 0.45 0.45 0.45 0.45 P, % 0.40 0.40 0.40 0.40
1 T0 : Tapioca residue 0%, T3 : Tapioca residue 3%, T6 : Tapioca residue 6%, T9 : Tapioca residue 9%. 2 Provided the following quantities of vitamins per kg of complete diet : vitamin A, 7,960 IU; vitamin D3,
1,592 IU; vitamin E, 32 IU; thiamine, 3 mg; riboflavin, 3.2 mg; calcium pantothenic acid, 8 mg; niacin, 46 mg; pyridoxine, 5 mg; biotin, 0.25 mg; folic acid, 0.5 mg; vitamin B12, 12 μg.
3
Provided the following quantities of minerals per kg of complete diet : Se, 0.1 mg; I, 0.3 mg; Mn, 24.8 mg; CuSO4, 24.80 mg; Fe, 54.1 mg; Zn, 84.7 mg; Co, 0.3 mg.
Table 3. Effect of tapioca residue supplementation levels on growth performance in finishing pigs1.
Criteria Treatments 2 SEM3 P-value 4 T0 T3 T6 T9 Lin. Quad. Body weight5, kg Initial 69.70 69.57 69.57 69.17 0.618 - -3 wk 89.57 89.39 90.46 89.67 0.560 0.55 0.55 6 wk 109.85 108.61 110.12 110.88 0.747 0.42 0.43 ADG, g 0-3 wk 903 900 949 932 13.4 0.26 0.78 4-6 wk 965 916 936 1,010 20.5 0.46 0.20 0-6 wk 934 908 943 970 14.1 0.30 0.39 ADFI, g 0-3 wk 2,884 2,863 3,223 2,884 54.2 0.42 0.13 4-6 wk 3,173 3,351 3,438 3,388 41.5 0.08 0.20 0-6 wk 3,025 3,101 3,328 3,130 43.9 0.18 0.13 G:F ratio 0-3 wk 0.315 0.315 0.294 0.324 0.005 0.90 0.12 4-6 wk 0.304A 0.273B 0.272B 0.298AB 0.005 0.61 0.01 0-6 wk 0.309A 0.292B 0.283B 0.308A 0.003 0.36 0.01 1
A total 140 crossbred pigs was fed from average initial body 69.22 ± 3.985 kg and the average final body weight was 109.86 kg.
2 T0 : Tapioca residue 0%, T3 : Tapioca residue 3%, T6 : Tapioca residue 6%, T9 : Tapioca residue 9%. 3 Standard error of mean.
4
Abbreviation: Lin. (linear) and Quad. (quadratic).
5
Values are means for five pens of seven pigs per pen.
A,B
Table 4. Effect of tapioca residue supplementation levels on blood profiles in finishing pigs1. Criteria Treatments 2 SEM3 P-value 4 T0 T3 T6 T9 Lin. Quad. BUN, mg/dL Initial ---7.80--- - - -3 week 9.80 11.17 12.87 8.33 0.702 0.73 0.84 6 week 12.03 10.57 11.13 8.53 0.747 0.76 0.83 Total cholesterol, mg/dL Initial ---112.70--- - - -3 week 87.67 86.67 96.00 90.33 2.306 0.35 0.06 6 week 91.33 103.67 81.67 79.33 3.937 0.25 0.69 Creatinine, mg/dL Initial ---0.17--- - - -3 week 1.35 1.31 1.46 1.25 0.034 0.62 0.42 6 week 1.47 1.35 1.42 1.38 0.029 0.58 0.17 Glucose, mg/dL Initial ---76.67--- - - -3 week 80.00 82.33 85.67 83.33 2.174 0.78 0.83 6 week 82.33 80.33 79.00 79.00 1.980 0.95 0.97
1 Least squares means of 3 observations per treatment
2 T0 : Tapioca residue 0%, T3 : Tapioca residue 3%, T6 : Tapioca residue 6%, T9 : Tapioca residue 9%. 3 Standard error of mean.
Table 5. Effect of tapioca residue supplementation levels on pork quality of longissimus muscle1. Criteria Treatments2 SEM3 P-value4 T0 T3 T6 T9 Lin. Quad. Proximate analysis, % Moisture 73.56 73.15 73.39 72.11 0.296 0.42 0.52 Crude protein 22.44 22.36 22.55 23.15 0.210 0.23 0.42 Crude fat 2.10 3.33 2.58 2.58 0.262 0.79 0.32 Crude ash 1.16a 1.13b 1.12b 1.07b 0.371 0.03 0.04 Physiochemical property, % WHC5 64.60 65.05 64.75 66.22 0.969 0.69 0.84 Cooking loss6 24.97 26.87 26.98 25.43 0.763 0.83 0.29 Shear force7 44.47 40.00 40.59 41.74 2.133 0.74 0.59 1 Least squares means for four pigs per treatment.
2 T0 : Tapioca residue 0%, T3 : Tapioca residue 3%, T6 : Tapioca residue 6%, T9 : Tapioca residue 9%. 3 Standard error of mean.
4
Abbreviation: Lin. (linear) and Quad. (quadratic).
5
WHC: water holding capacity.
6
Cooking loss unit: %.
7 Shear force unit: kg/0.5 inch2.
Table 6. Effect of tapioca residue supplementation levels on pH after slaughter1. Criteria Treatments2 SEM3 P-value4 T0 T3 T6 T9 Lin. Quad.
Time after slaughter
0 hour 5.71 5.75 5.86 5.83 0.051 0.35 0.78
3 hour 5.57 5.58 5.65 5.64 0.030 0.39 0.88
6 hour 5.50 5.53 5.59 5.49 0.021 0.87 0.18
12 hour 5.39 5.46 5.52 5.44 0.021 0.30 0.11
24 hour 5.51 5.48 5.45 5.42 0.025 0.27 0.98
1 Least squares means for four pigs per treatment.
2 T0 : Tapioca residue 0%, T3 : Tapioca residue 3%, T6 : Tapioca residue 6%, T9 : Tapioca residue 9%. 3 Standard error of mean.
4
Table 7. Effect of tapioca residue supplementation levels on pork color after slaughter1. Criteria Treatments 2 SEM3 P-value 4 T0 T3 T6 T9 Lin. Quad. CIE value5, L 3 hour 51.04 49.92 47.74 50.01 0.729 0.50 0.34 6 hour 50.12 53.23 48.52 49.82 0.846 0.50 0.62 12 hour 51.31 54.01 49.69 51.18 0.722 0.51 0.70 24 hour 52.91 54.97 52.29 53.41 0.796 0.88 0.78 CIE value, a 3 hour 6.34 7.37 6.48 5.56 0.293 0.20 0.10 6 hour 8.20 7.42 8.40 7.96 0.236 0.91 0.76 12 hour 9.15 8.00 8.74 8.84 0.232 0.93 0.24 24 hour 5.96 6.68 6.85 6.52 0.207 0.37 0.25 CIE value, b 3 hour 11.29 11.74 11.72 10.72 0.261 0.53 0.25 6 hour 12.91 14.26 12.83 12.85 0.281 0.51 0.24 12 hour 14.20 14.67 13.13 14.02 0.210 0.26 0.60 24 hour 12.58 13.69 12.48 13.20 0.329 0.82 0.75 1
Least squares means for four pigs per treatment.
2 T0 : Tapioca residue 0%, T3 : Tapioca residue 3%, T6 : Tapioca residue 6%, T9 : Tapioca residue 9%. 3 Standard error of mean.
4 Abbreviation: Lin. (linear) and Quad. (quadratic).
5 CIE L: luminance or brightness (vary from black to white), a: red and green component
Table 8. Effect of tapioca residue supplementation levels on TBARS in longissimus muscle1. Criteria Treatments 2 SEM3 P-value 4 T0 T3 T6 T9 Lin. Quad. Day 1 0.20 0.22 0.19 0.24 0.019 0.28 0.44 3 0.21ab 0.24a 0.20b 0.20b 0.014 0.14 0.44 5 0.15 0.18 0.17 0.16 0.014 0.77 0.14 7 0.24ab 0.17b 0.23ab 0.30a 0.028 0.15 0.07 1
Least squares means for four pigs per treatment.
2 T0 : Tapioca residue 0%, T3 : Tapioca residue 3%, T6 : Tapioca residue 6%, T9 : Tapioca residue 9%. 3
Standard error of mean.
4 Abbreviation: Lin. (linear) and Quad. (quadratic).
Table 9. Effect of tapioca residue supplementation levels on pork fatty acid composition in longissimus muscle1.
Criteria Treatments
2
SEM3 P-value
4
T0 T3 T6 T9 Lin. Quad.
Fatty acid composition, %
C14:0 1.09 2.08 1.39 1.48 0.198 0.69 0.77 C16:0 17.42 33.68 24.52 25.49 2.698 0.56 0.98 C16:1 1.90 4.37 2.96 3.19 0.340 0.46 0.99 C17:0 0.75 0.98 0.92 0.67 0.094 0.36 0.80 C18:0 10.12 17.53 12.91 13.78 1.474 0.71 0.93 C18:1 n-9 25.34 55.83 40.77 43.12 4.318 0.45 0.78 C18:2 n-6 6.49 8.80 7.06 7.20 0.466 0.57 0.70 C18:3 n-3 0.17 0.29 0.19 0.19 0.024 0.54 0.46 C20:0 0.14 0.28 0.18 0.20 0.025 0.67 0.75 C20:1 0.56 1.04 0.91 0.93 0.097 0.50 0.46 C20:2 0.33 0.42 0.38 0.41 0.025 0.70 0.61 C21:0 0.23 0.24 0.25 0.23 0.009 0.41 0.63 C20:4 n-6 1.24 1.27 1.40 1.25 0.042 0.18 0.36 SFA5 29.76 54.80 40.18 41.87 4.462 0.59 0.23 UFA6 36.03 72.04 53.68 56.28 5.205 0.31 0.10 MUFA7 27.81 61.24 44.65 47.24 4.722 0.27 0.09 PUFA8 8.22 10.80 9.03 9.04 0.529 0.84 0.24 UFA/SFA ratio 1.22 1.37 1.35 1.35 0.028 0.16 0.20
1 Least squares means for four pigs per treatment.
2 T0 : Tapioca residue 0%, T3 : Tapioca residue 3%, T6 : Tapioca residue 6%, T9 : Tapioca residue 9%. 3 Standard error of mean.
4 Abbreviation: Lin. (linear) and Quad. (quadratic). 5SFA = saturated fatty acids
6
UFA = unsaturated fatty acids
7MUFA = monounsaturated fatty acids 8PUFA = polyunsaturated fatty acids
Table 10. Effect of tapioca residue supplementation levels on economic analysis. Criteria Treatment 1 SEM2 P-value 3 T0 T3 T6 T9 Lin. Quad.
Feed cost per weight gain, won/kg
0-3 wk 1,911 1,975 1,947 1,888 27.1 0.63 0.19 4-6 wk 919B 1,038A 1,036A 952AB 18.2 0.49 0.01 0-6 wk 1,415B 1,506A 1,491A 1,420B 15.8 0.99 0.01
Total feed cost per pig, won/head
0-3 wk 17,663 17,515 18,279 16,773 281.7 0.48 0.27 4-6 wk 18,562b 19,739ab 20,362a 20,108a 258.3 0.04 0.17 0-6 wk 36,225 37,254 38,641 36,881 471.2 0.47 0.19 Estimated total feed cost to market weight (110kg) from 69.22kg, won
36,269b 37,643ab 38,609a 36,630ab 365.8 0.52 0.03
Days to market weight (110kg) from 69.22kg, days
42 44 42 41 0.8 0.38 0.49 1
T0 : Tapioca residue 0%, T3 : Tapioca residue 3%, T6 : Tapioca residue 6%, T9 : Tapioca residue 9%.
2 Standard error of mean. 3
Abbreviation: Lin. (linear) and Quad. (quadratic).
a,b
Means with different superscripts in the same row significantly differ(P<0.05).
A,B
Literature Cited
Aderemi, F. A., O. O. Tewe, A. O. K. Adesehinwa. 2000. Utilization of cassava root and leaves in diets for layers. Trop. Vet. 18:213-219.
Anderson, R. A., and A. S. Kolozlovsky. 1985. Chromium intake, absorption and excretion of subjects consuming self-selected diets. Am. J. Clin. Nutr. 41:1177-1183.
AOAC. 2005. Official methods of Analysis. 18th Edition. Association of Official Analytical Chemist. Washington, D.C., U.S.A.
Arambawela, W. D., M. B. Nielsen, V. Danielben, and B. G. Eccum. 1975. Effect of replacing barley with tapioca meal at two different levels of feeding on the growth and health of early weaned pigs. Liwat. Prod. Sci. 2:281-288.
Arave, C. W., R. H. Miller, and R. C. Lamb. 1975. Genetic and environmental effects on serum cholesterol of dairy cattle of various ages. J. Dairy. Sci. 58:423-427.
Armstrong, D., V. Attoh-Kotoku, R. O. Kwame, and R. Gasear. 2012. Evaluation of nutritional quality of dried cashew nut testa using laboratory rat as a model for pigs. The Scientific World. J. 10:1100-1105.
Aumaitre, A. 1969. Valeur alimentaire du manioc et de differentescereals dans les regimes de sevrage precoce du porcelet : utilization digestive de l’aliment et eefect sur la croissance des animaux. Ann. Zootech. 18:385-398.