Prediction of Fluid-borne Noise Transmission Using AcuSolve and
OptiStruct
Michael Barton*
·
David Corson*
·
Dilip Mandal*
·
Kyeong-Hee Han
†Key Words : CFD, CAA
ABSTRACT
In this work, Altair Engineering's vibroacoustic modeling approach is used to simulate the acoustic signature of a simplified automobile in a wind tunnel. The modeling approach relies on a two step procedure involving simulation and extraction of acoustic sources using a high fidelity Computational Fluid Dynamics (CFD) simulation followed by propagation of the acoustic energy within the structure and passenger compartment using a structural dynamics solver. The tools necessary to complete this process are contained within Altair's HyperWorks CAE software suite. The CFD simulations are performed using AcuSolve and the structural simulations are performed using OptiStruct. This vibroacoustics simulation methodology relies on calculation of the acoustic sources from the flow solution computed by AcuSolve. The sources are based on Lighthill’s analogy and are sampled directly on the acoustic mesh. Once the acoustic sources have been computed, they are transformed into the frequency domain using a Fast Fourier Transform (FFT) with advanced sampling and are subsequently used in the structural acoustics model. Although this approach does require the CFD solver to have knowledge of the acoustic simulation domain a priori, it avoids modeling errors introduced by evaluation of the acoustic source terms using dissimilar meshes and numerical methods. The aforementioned modeling approach is demonstrated on the Hyundai Simplified Model (HSM) geometry in this work. This geometry contains flow features that are representative of the dominant noise sources in a typical automobile design; namely vortex shedding from the passenger compartment A-pillar and bluff body shedding from the side view mirrors. The geometry also contains a thick poroelastic material on the interior that acts to reduce the acoustic noise. This material is modeled using a Biot material formulation during the structural acoustic simulation. Successful prediction of the acoustic noise within the HSM geometry serves to validate the vibroacoustic modeling approach for automotive applications.
1. Introduction♣
This paper is motivated by the automotive industry's desire to develop simulation tools that are capable of predicting the acoustic characteristics of candidate vehicle designs. To facilitate this goal, the Hyundai Simplified Model (HSM) testing program was created. This program consists of a series of wind tunnel tests using progressively complex geometries for which acoustic measurements were obtained.
† 교신저자; Altair Engineering Korea E-mail : [email protected] * Altair Engineering
The goal in collecting this data is to enable software vendors to validate their suggested approaches for simulating the acoustics of automobiles on a geometry that captures the dominant physics of a passenger vehicle.
The work presented in this paper describes the application of a vibroacoustic simulation approach to predict the acoustic signature of the three models provided by Hyundai.
2. Simulation Methodology
The first step in performing the vibroacoustic simulation is quantification of the acoustic sources present within the flow field. Using 한국소음진동공학회 2014년 추계학술대회
Altair's vibroacoustic simulation approach, this is accomplished by running a high resolution flow simulation using AcuSolve, then extracting the acoustic sources from within a subset of the modeled fluid domain. Once the CFD simulation is completed, the acoustic sources are post-processed into the frequency domain and provided as input to the OptiStruct model. OptiStruct simulates the effect of the acoustic waves on the structure and propagates them into the interior of the geometry. Upon completion of the simulations, the CFD results, acoustic sources, and acoustic responses can all be visualized concurrently within HyperView. All tools necessary to complete this process are contained within Altair's HyperWorks CAE software suite.
3. CFD Model Description
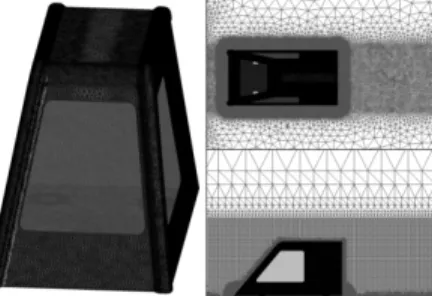
The CFD model was constructed using each of the geometries that were provided by Hyundai. The starting point for the analyses is the BMT-4 model at zero yaw with no mirrors (referred to as the BASE case). This geometry was used to develop a modeling methodology that will be applied to all analyses required for this phase of the HSM exercise. An image of the geometry, showing point probe output locations and its location within the CFD domain is shown in the following image (Fig. 1):
Figure 1Geometric model (BASE) used for initial HSM simulations
3.1 Meshing Controls
An important aspect of performing vibroacoustic simulations is adequately capturing all of the length and time scales of importance within the flow field. For this simulation, this consists of the scales associated with the advection of momentum as well as the propagation of the acoustic pressure waves. To resolve all of these characteristics of the flow, it is necessary to ensure that the most limiting scale is resolved appropriately. For this case, the limiting scale corresponds to the wavelength of the highest frequency acoustic wave of interest (4000 Hz).
The model was meshed with AcuSolve's mesh generator, AcuMeshSim, using all tetrahedral elements. The volume and surface element size was chosen to resolve the wavelength of the 4000 Hz wave using approximately 10 points in space. This corresponds to an element size of approximately 0.0086 meters. This mesh resolution was maintained in the immediate vicinity of the vehicle body, and a small distance away from the surface where the acoustic energy is expected to be concentrated. The momentum boundary layer along the surface of the vehicle was resolved using structured layers of tetrahedral elements with a stretch ratio of 1.2. The first layer height was chosen to yield a y+ value of approximately 1.0. The farfield was meshed coarsely to maintain a reasonable model size as well as to provide a damping mechanism to prevent reflection of acoustic waves from the surrounding wind tunnel surfaces. Representative images of the mesh are shown below (Fig. 2).
Figure 2 Representative mesh used in the HSM acoustic simulations for BASE geometry
3.2 Boundary Conditions
The boundary conditions of the HSM model consist of rigid, no-slip walls on the surface of the vehicle. The inlet velocity field was specified at a distance of 9.432 meters upstream of the model to minimize interaction between the inlet boundary of the model and the flow around the body of the notional vehicle. The velocity profile corresponds to what was provided by Hyundai for the BL-off case. The velocity magnitude was set to 110 KPH. Slip wall constraints are used on the floor of the wind tunnel to maintain the profile until it reaches the location at which the velocity profile measurements were taken. From this point downstream, a no-slip constraint is applied to the wind tunnel floor. The eddy viscosity at the inlet of the model was adjusted to provide an appropriate development of the inlet profile based on the empty tunnel data that was provided by Hyundai.
An integrated pressure constraint is applied at the outlet of the wind tunnel and slip wall constraints are used on the side and top walls.
3.3 Solver Controls
Accurate resolution of the acoustic sources requires the simulation of the transient, turbulent features within the flow field. To accomplish this, the Delayed Detached Eddy Simulation (DDES) turbulence model was used in all of the HSM simulations. The simulations are performed using a fixed time increment of 2.5e-5 seconds. This time step size corresponds to the time scale associated with resolving the acoustic waves using an acoustic CFL number of approximately 1.0. The simulations were run using an isentropic variable density material model. This approach produces a full variable density flow solution, but saves compute power in comparison to an ideal gas density model by avoiding the need to solve for the temperature equation. The isentropic density model allows the solver to capture large standing waves as well as acoustic waves, which both contribute to the interior
cabin noise.
3.4 Acoustic source sampling
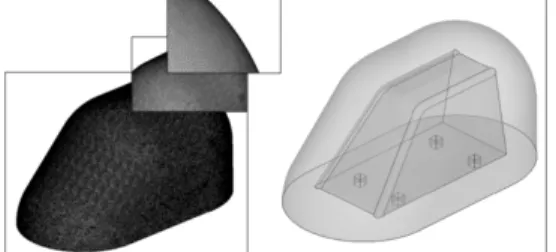
As mentioned previously, the vibroacoustic simulation approach within HyperWorks relies on AcuSolve to simulate the acoustic sources and OptiStruct to propagate the sources within the structure and internal cavity of the model. The passing of data between the two codes is facilitated through the vibroacoustic output mechanism within AcuSolve. Using this mechanism, an acoustic mesh is defined within the AcuSolve simulation. The relevant acoustic sources are sampled on this acoustic mesh based on the AcuSolve flow solution at each time step. This data is then post-processed in the frequency domain and provided as input to the OptiStruct model to propagate the noise into the interior of the vehicle. In order to maintain suitable model sizes and only capture the flow information pertinent for OptiStruct, the acoustic domain is restricted to the near wall region surrounding the vehicle. Various distances from the surface of the vehicle will be evaluated as part of this work to identify best practices for the HSM model. The following image (Fig. 3) illustrates a representative acoustic mesh used for this application.
Figure 3 Acoustic mesh used for initial HSM simulations.
4. Results
Initial CFD simulations have been performed to extract the acoustic sources from the HSM BASE model flow field. The following results (Fig. 4) reflect the chaotic nature of the flow field at a single instant in time. Note the resolution of the large scale vortex structures within the flow field
as well as the smaller scale features that develop within the wake.
Figure 4 Iso-surfaces of Q-criterion colored by velocity magnitude illustrating the dominant features of the
flow field.
The time history of the flow further illustrates the highly turbulent nature of the flow around the A-pillar and it's propagation into the wake. The following time traces (Fig. 5) illustrate the pressure field on the surface of the vehicle during the transient simulation.
Figure 5 Time history of pressure along the side window of the HSM model corresponding to the surface
pressure nodes.
The locations of the time history signal correspond to the surface pressure probes as requested by Hyundai.
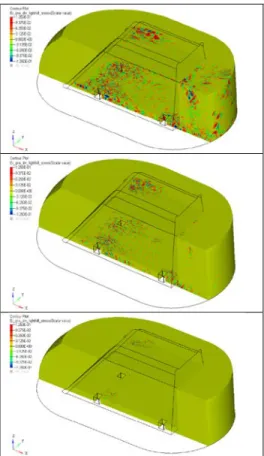
The acoustic sources were processed and can be viewed in the frequency domain. The following images (Fig. 6) illustrate the strength of the acoustic sources on the surface of the HSM model for 125, 250 and 500 Hz.
Figure 6 Acoustic source strength on the surface of the BASE model at 125 Hz (Top), 250 Hz (Center) and
500 Hz (Bottom)
The volumetric acoustic source terms can also be viewed, and are shown in the following figures (Fig. 7).
5. Discussion
The results presented in this document were extracted from a first set of simulations that were performed in support of a full vibroacoustic model of the HSM BASE geometry. Future work will focus on refining the models and identifying best practices for predicting the acoustic characteristics of the BASE model as well as the remaining cases supplied by Hyundai.
Figure 7 Acoustic source strength in the volume near the BASE model at 125 Hz (Top), 250 Hz (Center) and
500 Hz (Bottom)
Acknowledgments
The authors gratefully acknowledge Hyundai Motors for providing the experimental data that will be used in this investigation.