Journal of Pharmaceutical Investigation Vol. 41, No. 6, 377-380 (2011)
377
Discrimination between Artemisia princeps and Artemisia capillaris Based on
Near Infrared Spectroscopy Combined Multivariate Analysis
Dong Young Lee, Minji Jeon, Youngbae Suh, Seung Hyun Kim1, Young Choong Kim and Sang Hyun Sung†
College of Pharmacy and Research Institute of Pharmaceutical Science, Seoul National University, Seoul 151-742, Republic of Korea 1College of Pharmacy, Yonsei Institute of Pharmaceutical Sciences, Yonsei University, Incheon 406-840, Korea
(Received November 28, 2011·Revised December 3, 2011·Accepted December 9, 2011)
ABSTRACT−The Artemisia princeps (Compositae) has been used in traditional Korean medicine for the treatment of microbial infections and inflammatory diseases. Since A. princeps is generally difficult to be discriminated from A. cap-illaris, A. caplillaris has been misused in place of A. princeps. To solve this problem, a rapid and nondestructive method for discrimination of A. princeps and A. capillaris samples was developed using near infrared spectroscopy (NIRS) in the present study. A principal component analysis (PCA) and a partial least squares discrimination analysis (PLS-DA) were per-formed to discriminate two species. As a result, with the use of PLS-DA, A. princeps and A. capillaris were clustered according to their genus. These outcomes indicated that the NIRS could be useful for the discrimination between Artemisia princeps and Artemisia capillaris.
Key words−Artemisia princeps, Artemisia capillaris, Near infrared spectroscopy (NIRS), Partial least square dis-crimination method(PLS-DA)
Genus Artemisia is the largest genus in the tribe Anthemid-eae and genera in the AsteracAnthemid-eae. More than 500 species of Artemisia are widely distributed in the northern hemisphere, but there are less than 10 species in the southern hemisphere (Torrell et al., 1999). They have been used in foods, orna-mentals and traditional medicine. Several pharmacological effects have been reported, including anti-malarial, anti-cancer and anti-diabetic effects (Lee et al., 2009). In particular, the standardized extract of A. princeps has been sold as an anti-gastritis agent in South Korea (Choi et al., 2008).
There are 40 Artemisia species in Korea (Lee et al., 2009). These plants look similar to one another, for this reason certain Artemisia herbs tend to be misused as other Artemisia herb. For instance, young leaves of A. princeps are not easily dis-tinguished from those of A. capillaris. Therefore, a part of A. capillaris mixed as A. princeps in medicinal herbs market (Lee et al., 2006). To solve this problem, an efficient method for the identification of Artemisia herbs needs to be developed.
Morphological discrimination of Artemisia herbs is very puzzling owing to their similarities in the shapes of young leaves. Furthermore, Artemisia herbs are commonly available in dried and sliced forms in the market (Lee et al., 2006; Lee
et al., 2008).
Other analytical discrimination method, including high per-formance liquid chromatography (HPLC), gas chromatogra-phy (GC), and DNA sequencing method, are not always sufficient because they are time consuming, difficult, destruc-tive, and consequently require experise. Near-infrared spec-troscopy (NIRS) has been known to be a potent tool for qualitative and quantitative analysis available in foods, agri-cultural, and pharmaceutical industries. It provides fast and non-destructive methods, requiring minimal or no sample preparation with reasonable good precision (Burns et al., 2001).
In recent years, many researches have been attempted to dis-criminate various herbs using NIRS (Chen et al., 2009; Li et al., 2007; Woo et al., 2005). However, discrimination of Arte-misia spp. using NIRS has not been tried yet.
In this study, we attempted to develop classification method between A. princeps and A. capillaris based on the results of NIRS analysis combined with appropriate chemometric meth-ods and multivariate analysis.
Materials and Methods
Samples and reagents
Forty one samples of A. princeps and five samples of A. capillaris were purchased from Kyungdong traditional herbal
†Corresponding Author :
Tel : +82-2-880-7859, E-mail : [email protected] DOI : 10.4333/KPS.2011.41.6.377
378 Dong Young Lee, Minji Jeon, Youngbae Suh, Seung Hyun Kim, Young Choong Kim and Sang Hyun Sung
J. Pharm. Invest., Vol. 41, No. 6 (2011)
market (Seoul, Korea). Nine samples of A. capillaris aerial parts were provided by Korea Food and Administration. All the samples were authenticated by Dr. Young Bae Suh, pro-fessor of Seoul National University. Voucher specimens have been deposited at the Institute for Life Science, Elcomscience Co. Ltd. Samples were milled into powder with a grinder for one minute. To reduce the effect of particle size, the pulverized samples were passed through a 100-mesh sieve(150µm). Then this sieved powder was dried for 10 hours in an oven at 50oC in order to remove the moisture in the samples before NIR analysis.
NIR measurement
Near infrared reflectance spectra of Artemisia spp. powder were obtained using an NIR system (MPA; Bruker optics, Ger-many) over a wavelength range 4000 cm-1~10000 cm-1, using 32 scans 8 cm-1 resolution per spectrum. About 800 mg of the sample powder was individually filled up in a standard sample vial. The spectra were acquired in the reflectance mode with a standard sample vial as a reference standard. Each sample spectrum was measured three times and the average of three spectra was used in the analysis.
Data analysis
The SIMCA-P (Umetrics, Swden, version 11) software was used for multivariate analysis. NIR spectral data acquisition, spectrum preprocessing was performed by OPUS 6.0 (Bruker Optics, Ettlingen, Germany) software. The NIR spectra were analyzed using principle component analysis (PCA) and partial least square – discriminant analysis (PLS-DA) with several preprocessing methods to obtain the optimum results.
Results and Discussion
Features of NIR spectra
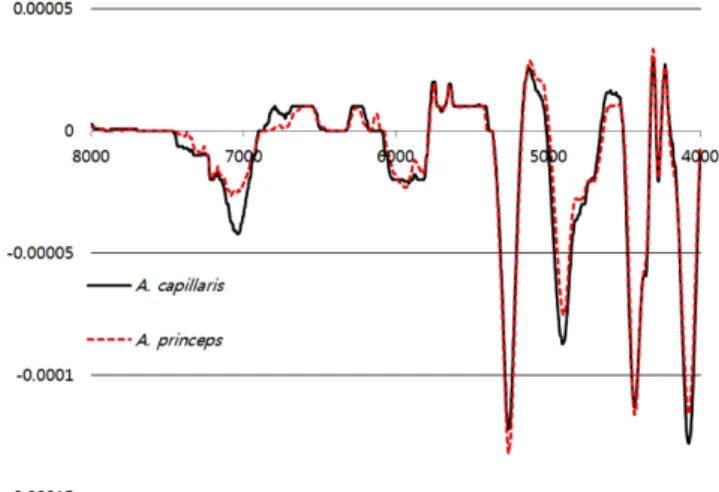
Figure 1 shows the average of raw reflectance spectra of forty one samples of A. princeps and fourteen samples of A. capillaris. Several differences among samples were observed at several regions around 4400, 4700, 5800 and 6900 cm-1, which corresponded to the combinations and overtones of fun-damental stretching vibrations of -NH, -OH and -CH in the mid-infrared (Louw et al, 2010). In order to reduce the particle size effects and noises, it was necessary to preprocess raw spectra before multivariate analysis. There are several spectral preprocessing methods including smoothing, derivativation, multiplicative scatter correction (MSC), standard normal vari-ate transformation (SNV) and other methods. By comparing several spectral preprocessing, SNV with first derivative is
most suitable model for multivariate analysis (shown in Figure 2). SNV is used to remove slope variation and correct scatter effects. First derivative is used to eliminate baseline drift and enhance small spectral differences (Chung et al., 2000).
Principal Component Analysis (PCA)
The original data of the NIR spectra of A. princeps (AP) and A. capillaris (AC) were analyzed by PCA method, an unsu-pervised method of data compression and visualization, to get the more interpretable results. In order to visualize the clus-tering trends of the samples, a scatter plot of the scores was obtained using the main two principal components (PCs). The first two PCA PCs account for 41.1% of the total variance of the near infrared spectra in the set of Artemisia spp. analyzed. PCA score plots generated from the fifty five samples showed two clear outliers, P-22 and P-34, where the ellipse marks the Figure 1. Average raw reflectance spectra of A. princeps and A. capillaris
Figure 2. Average SNV with first derivative spectra of A. princeps and A. capillaris
Discrimination between Artemisia princeps and Artemisia capillaris Based... 379
J. Pharm. Invest., Vol. 41, No. 6 (2011) Figure 3. PCA score plot of Artemisia spp. using the first(x axis) and second(y axis) PCs
380 Dong Young Lee, Minji Jeon, Youngbae Suh, Seung Hyun Kim, Young Choong Kim and Sang Hyun Sung
J. Pharm. Invest., Vol. 41, No. 6 (2011)
95% Hotelling T2 control chart (Figure 3). In this score plot, most samples of A. princeps were partially separated from samples of A. capillaris by positive scores on PC1 and neg-ative scores on PC2. However, several samples of A. princeps were not discriminated and partially overlapped with samples of A. capillaris.
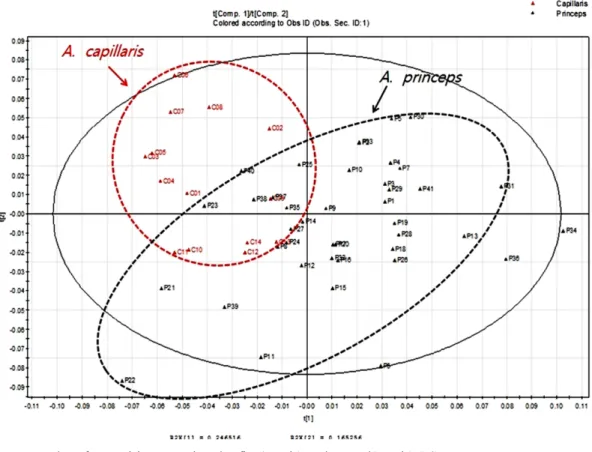
Partial least squares discriminant analysis (PLS-DA) The original data of the NIR spectra of A. princeps and A. capillaris was also analyzed by a PLS-DA, a supervised method, in order to clarify the separation between two groups (Figure 4). The first two PLS-DA PCs account for 36% data variance. PLS-DA score plot generated from the fifty five sam-ples showed three clear outlier, P-21 P-22 and P-34, where the ellipse marks the 95% Hotelling T2 control chart. PLS-DA score plot is analogous to the PCA score plot. However, dis-crimination of Artemisia spp. appears more obvious. This might be elucidated from the fact that the PLS-DA maximizes the variance between groups rather than within the group (Kemsley, 1996). With three exception of P-21, P-22 and P-34 sample, samples of A. capillaris were nicely separated from samples of A. princeps by positive scores on PC1 and PC2, respectively.
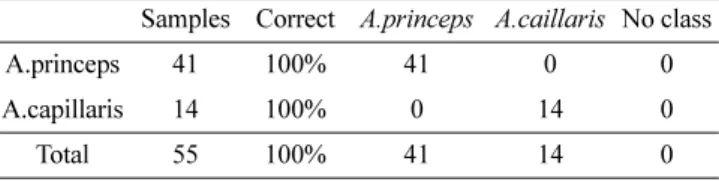
Misclassification list for PLS-DA of Artemisia spp. The misclassification list summarizes how well the PLS-DA model classifies the observations into the known groups (Table I). The assign each observation only to the nearest group option is used. In this table, all the observations were correctly classified without any exception.
In conclusion, the present study showed the potential of NIRS for species discrimination between A. princeps and A. capillaris. Since NIRS is non-destructive, less time consuming and cost-consuming, and more rapid and more environmen-tally friendly, NIRS could be a powerful tool in the quality control of Artemisia spp.
Acknowledgement
This work was supported by the Global Leading Technology Program (10039303) of the Office of Strategic R&D
Plan-ning(OSP) funded by the Ministry of Knowledge Economy, Republic of Korea.
References
Burns, D.A., Ciurczak, E.W., 2001. Handbook of Near-infrared Analysis, Marcel Dekker, New York.
Chen, Q., Zhao, J., Lin H., 2009. Study on discrimination of Roast green tea (Camellia sinensis L.) according to geographical ori-gin by FT-NIR spectroscopy and supervised pattern recog-nition, Spectrochim Acta A 72, 845-650.
Choi, E.J., Oh, H.M., Na, B.R., Ramesh, T.P., Lee, H.J., Choi, C.S., Choi, S.C., Oh, T.Y., Choi, S.J., Chae, J.R., Kim, S.W., and Jun, C.D., 2008. Eupatilin protects gastric epithelial cells from oxidative damage and down-regulates genes respondible for the cellular oxidative stress, Pharm Res 25, 1355-1364. Chung, H. I., Kim, H. J., 2000. Near-Infrared Spectroscopy :
Prin-ciples, Anal Sci Tech 13, 1-14.
Kemsley, E.K. 1996. Discriminant analysis of high-dimensional data: a comparison of principal components analysis and par-tial least squares data reduction methods, Chemometr Intell Lab 33, 47-61.
Louw, E.D., Theron, K.I., 2010. Robust prediction models for quality parameters in Japanese plums (Prunus salicina L.) using NIR spectroscopy, Postharvest Biol tech 58, 176-184. Lee J.H., Lee J. W., Sung J.S., Bang K.H., Moon S.G., 2009. Molecular authentication of 21 korean Artemisia species (Compositae) by polymerase chain reaction-restriction frag-ment length polymorphism based on trnL-F region of chlo-roplast DNA, Bio Pharm Bull 32, 1912-1916.
Lee M.Y., Doh E.J., Park C.H., Kim Y.H., Kim E.S., Ko B.S., Oh S.E., 2006. Development of SCAR marker for discrimination of Artemisia princeps and A. argyi from other Artemisia herbs. Bio Pharm Bull 29, 629-633.
Lee M.Y., Doh E.J., Kim E.S., Kim Y.H., Ko B.S., Oh S.E., 2008. Application of the multiplex PCR method for discrimination of Artemisia iwayomogi from other Artemisia herbs, Bio Pharm Bull 31, 685-690.
Li, W., Frank S.C. Lee, Xiaoru, W., 2007. Near-infrared spec-troscopy for classification of licorice (Glycyrrhizia uralensis Fisch) and prediction of the glycyrrhizic acid (GA) content, LWT 40, 83-88.
Li, X., He, Y., Fang H., 2007. Non-destructive discrimination of Chinese bayberry varieties using Vis/NIR spectroscopy, J. Food Eng 81, 357-363.
Torrell M., Garcia-Jacas N., Susanna A., Vallès J., 1999. Phy-logeny in Artemisia (Asteraceae, Anthemideae) inferred from nuclear ribosomal DNA (ITS) sequences, Taxon 48, 721-736. Woo, Y.A., Kim, H.J., Ze, K.R., Chung, H., 2005. Near-infrared (NIR) spectroscopy for the non-destructive and fast deter-mination of geographical origin of Angelicae gigantis Radix, J. Pharmaceu Biomed 36, 966-969.
Table I. Misclassification list for PLS-DA of Artemisia spp. Samples Correct A.princeps A.caillaris No class
A.princeps 41 100% 41 0 0
A.capillaris 14 100% 0 14 0