Copyright © 2016 The Korean Society of Environmental Health and Toxicology
Introduction
Since 1962, South Korea (hereafter Korea) has achieved rapid growth due to the implementation of a what started as a 5-year economic development plan. During the early years of econom-ic development, Korea chiefly strived to expand energy sources, such as electricity and coal, and national infrastructure, such as roads, ports, railroads, telecommunications, electric power, and water supply. In the 1970’s, the nation focused on industrializa-tion of the heavy chemical industry. Energy, steel, and petro-chemical products played important roles in this industrializa-tion process [1]. In particular, many naindustrializa-tional and public indus-trial complexes were built in the Chungnam region because of its geographic proximity to the capitol area and the west coast,
which allowed easy access to ports, seawater, and smooth trade with China [2].
While such industrialization achieved economic development, it polluted the air, soil, and water quality of the regions in which industrial facilities continuously released exhaust and wastewa-ter. In the process of combusting fossil fuels and refining metal, heavy metal was created, which then polluted the surrounding areas by either falling to the ground after becoming absorbed into the dust emitted from the combustion process, or by rain. Because these sources of pollution can become absorbed into the body and breed both acute and chronic health hazards, the stench from industrial complexes could cause a great deal of mental and psychological damage to its neighboring residents [1,3].
Relationship between residential district and
health-related quality of life in Chungnam
industrial complex area
Heechan Kim
1, Sangchul Roh
1,21Department of Occupational and Environmental Medicine, Dankook University College of Medicine, Cheonan; 2Center for Farmers’ Safety and Health, Dankook University Hospital, Cheonan, Korea
• Original Article
http://dx.doi.org/10.5620/eht.e2016017eISSN: 2233-6567
Objectives This study aimed to evaluate the relationship between residential district of people, such as power plant, steel-mill and petrochemical industries, and health-related quality of life (HRQoL).
Methods Using a cross-sectional study design, we randomly recruited participants for our study from industrial areas (thermoelectric power plant, steel-mill, petrochemical in-dustry) and rural areas. Logistic regression analysis was used to identify the relation-ships between Euro quality of life-5 dimension (EQ-5D) scores and living region, while controlling for sociodemographic characteristics.
Results In adjusted model, quality of life decreased with increasing category of age and were lower for females than males. EQ-5D scores of people living in the vicinity of thermoelectric power plant were significant lower than those of people living the vicinity of comparison region (odds ratio, 1.59; 95% confidence interval, 1.00 to 2.53).
Conclusions Living region of thermoelectric power plant, was strongly associated with scores on the EQ-5D. More research is needed to elucidate the mechanisms which makes the relationship with the living regions and HRQoL.
Keywords Health-related quality of life, Euro quality of life-5 dimension, Industrial com-plex area, Republic of Korea
Correspondence: Sangchul Roh 119 Dandae-ro, Dongnam-gu, Cheonan 31116, Korea Tel: +82-41-550-3956 Fax: +82-41-556-6461 E-mail: [email protected] Received: July 27, 2016 Accepted: August 5, 2016 Published: August 26, 2016
Investigation of the health effects from the surrounding areas of industrial complexes were mainly carried out by an official checking the magnitude of pollutant emission, assessing the amount of pollutants accumulated in the body, and diagnosing diseases based on a medical examination [2]. However, it is dif-ficult for investigations on health to reflect the effects of indus-trial complexes on the quality of life (QoL) of neighboring resi-dents. This is because the concept of health is gradually evolving toward valuing the QoL, not just extending it [4].
Euro quality of life-5 dimension (EQ-5D) is a health-related quality of life (HRQoL) index that has been internationally stan-dardized. The need to consider the multi-dimensionality of health makes health evaluation challenging. In other words, we need to comprehensively consider aspects such as physical, func-tional, subjective, and mental health. EQ-5D is measured based on a respondent’s self-evaluation of experiences such as motor ability, self-care, usual activities, pain/discomfort, and anxiety/ depression. While EQ-5D is a subjective index because of its self-evaluation method, it is also a comprehensive measurement in-dex that takes into account the multi-dimensionality of health, since it encompasses the physical, functional, and mental dimen-sions [5].
The objective of this study is to evaluate the QoL of residential districts around the power plant, steel mill, and petrochemical industrial complexes built in Chungnam. First, we will compare the QoL between residential districts in industrial areas and resi-dents living in areas that are considered to be unaffected by in-dustrial complexes. Second, we will analyze the factors that af-fect the QoL within near an industrial complex. In particular, we will investigate the relevance between the distance from a facili-ty to the QoL.
Materials and Methods
Study Subjects
Six regions were randomly selected from areas vulnerable to environmental pollution: four regions bordering the Chungnam power plant, steel mill, and petrochemical industrial complexes (Dangjin Power Plant, Boryeong Power Plant, Seocheon Power Plant, Taean Power Plant), the Dangjin Steel Mill, and Seosan Petrochemical Industrial Complex. Moreover, four comparison regions were selected that are located at least 30 km from an in-dustrial complex and have low exposure to environmental pol-lution: Cheongyang and Gongju were selected as inland com-parison regions while Hongseong and Taean (located near the seashore) were selected as coastal comparison regions. Then, administrative districts at the village level were selected within the regions of each city and province and surveys of the
resi-dents were conducted.
The surveys were carried out from November 2013 to De-cember 2015. The subjects of the study were limited to adult residents of the selected regions who were age 20 or older, and the surveys were conducted on local medical check-up examin-ees. People who had previously been employed at an industrial complex, had suffered from a mental disorder, or had verbal communication issues were excluded. Out of the 1320 total subjects recruited, 1244 participated in the surveys.
Based on the 2013 resident registration population, 385410 residents over the age of 20 lived in the power plant industrial complex region, 159615 in the steel mill industrial complex re-gion, 165837 in the petrochemical industrial complex rere-gion, and 300644 in the comparison regions. Since villages were ran-domly selected within the industrial areas and the comparison regions and then surveys of the village residents were conduct-ed, the survey results represent each region.
The research ethics committee of Dankook University Hospi-tal approved this study (DKUH 2013-10-005), and before con-ducting the surveys, consent was received from all research sub-jects.
Questionnaire
In addition to 36-Item Short Form Health Survey Instrument (SF-36), EQ-5D is one of the most widely used QoL evaluation instrument in the clinical research field. EQ-5D has been trans-lated into more than 130 languages worldwide and is used in a variety of fields. EQ-5D is a general health measurement instru-ment that not only describes a patient’s QoL, but can also pres-ent a single summary index by applying weights to each of the levels in each dimension. These weights are calculated based on the valuation of health states from general population samples. EQ-5D is composed of five dimensions: mobility, self-care, usu-al activities, pain/discomfort, and anxiety/depression. Each di-mension is divided into three levels: no problems, some prob-lems, and extreme problems. EQ-5D is simple and does not take a long time to complete. The questionnaire can be self-complet-ed or by face-to-face interviews.
Based on the above questions, EQ-5D calculates a score by at-taching different weights to each question. A unique valuation is calculated and used after taking into account each country’s conditions. Nam et al. [6] conducted a study that computed an EQ-5D valuation in Korea. This study adopted the valuation method used by Nam et al [6] since it is the official method used by the Korea National Health and Nutrition Examination Survey.
According to Nam et al. [6], an EQ-5D score is calculated by the following formula:
Y=1-(0.050+0.096*M2+0.418*M3+0.046*SC2+0.136*SC3 +0.051*UA2+0.208*UA3+0.037*PD2+ 0.151*PD3+0.043*A D2+0.158*AD3+0.050*N3) --- (1) M=mobility SC=self-care UA=usual activity PD=pain/discomfort AD=anxiety/depression
If a respondent selects level 1 for all of the dimensions, their EQ-5D score is one, and is deemed a healthy person by mea-surement standards. Based on this standard, if a respondent se-lects level 2 or 3 for the dimensions, we can calculate the EQ-5D score by subtracting the valuation presented in Formula (1). Therefore, the number of health states that can be described by EQ-5D is 35=243, with a maximum distribution of one and a
minimum of -0.171.
The constant 0.050 is subtracted in cases where even one of the five dimensions is in the category of level 2 or more. N3 is subtracted when a respondent answers with a level 3 (the worst health state) for even one of the questions. This is called a dys-function dimension, and since this additional dimension is pro-duced by the interactive characteristic of EQ-5D, it does not in-dicate an unhealthy state for one particular dimension, but for all five dimensions. There is a total of six dimensions in EQ-5D, including the dysfunction dimension. Because there is no fixed breaking point to define poor QoL, a breaking point was select-ed by the researchers randomly: the lower 10% fractile of the control group would represent poor QoL. Since many studies,
including one by Jo and Lee [7], have verified the validity of EQ-5D, it was decided that this instrument could be used with-out further verification.
Confounder
Survey agents carried out research on subjects using EQ-5D and a questionnaire on socioeconomic standards. To determine socioeconomic status, respondents were asked about their sex, age, marital status, average monthly income, education level, employment status, and whether nor not they suffered from any chronic diseases.
Data Analysis
A frequency analysis was conducted on the demographic char-acteristics of the research subjects, as well as on the distribution of levels in each of the five dimensions of EQ-5D depending on the residential district. Finally, a logistics regression analysis was conducted on the declining QoL depending on socioeconomic status. Then the mean and standard deviation of the EQ-5D were calculated according to the distance from facilities in the industrial complex. After adjusting for the decline of QoL in res-idential districts according to socioeconomic levels, a regression analysis was conducted. SPSS version 23.0 (IBM Corp., Ar-monk, NY, USA) was used for all statistical analyses.
Results
The demographic characteristics of the subjects are summa-Table 1. Sociodemographic characteristics of study subjects
Thermoelectric power plant Steel mill Petrochemical industry Control p-valuea
Sex Male 223 (47.3) 125 (47.9) 64 (39.0) 185 (53.2) 0.03
Female 248 (52.7) 136 (52.1) 100 (61.0) 163 (46.8)
Age ≤59 139 (29.5) 80 (30.7) 64 (39.0) 114 (32.8) 0.009
60-69 134 (28.5) 90 (34.5) 44 (26.8) 127 (36.5)
≥70 198 (42.0) 91 (34.9) 56 (34.1) 107 (30.7)
Marital status Yes 367 (77.9) 208 (79.7) 128 (78.0) 289 (83.0) 0.31
Nob 104 (22.1) 53 (20.3) 36 (22.0) 59 (17.0)
Monthly income (104 Korean won) ≤49 214 (45.6) 113 (43.3) 74 (45.1) 147 (42.4) 0.80
50-199 175 (37.3) 95 (36.4) 55 (33.5) 129 (37.2)
≥200 80 (17.1) 53 (20.3) 35 (21.3) 71 (20.5)
Education Uneducated 106 (22.5) 51 (19.5) 38 (23.2) 64 (18.4) 0.32
Elementary 207 (43.9) 119 (45.6) 59 (36.0) 160 (46.0) Middle or higher 158 (33.5) 91 (34.9) 67 (40.9) 124 (35.6)
Employed status Yes 316 (67.1) 154 (59.0) 124 (76.1) 264 (76.3) <0.001
No 155 (32.9) 107 (41.0) 39 (23.9) 82 (23.7)
Chronic diseasec Yes 247 (47.6) 128 (49.0) 67 (40.9) 142 (40.9) 0.09
No 224 (52.4) 133 (51.0) 97 (59.1) 205 (59.1)
Values are presented as number (%).
ap-values of chi-square test.
bUnmarried/divorced/widowed.
rized in Table 1. There was a higher portion of female residents living in areas vulnerable to environmental pollution, but there was a higher portion of male residents living in the comparison regions. There was a higher age range for power plant districts, with 42.0% of the population older than 70 years. The age range was lower for the petrochemical industrial complex, with 39.0% of the population younger than 59 years. More residents report-ed to be marrireport-ed in comparison regions (83.0%) than in areas vulnerable to environmental pollution. The greatest fraction of residents reported a 500000 Korean won or less monthly
in-come, and the highest percentage of residents who fell into this category lived in power plant districts (45.6%). In terms of edu-cation level, the highest percentage of residents who had at least a middle school diploma lived in the petrochemical industrial complex (40.9%) region. The employment rate was highest in comparison regions, at 76.3%, and lowest in steel mill districts, at 59.0%. The prevalence rate of chronic diseases was highest in power plant districts, at 49.0%.
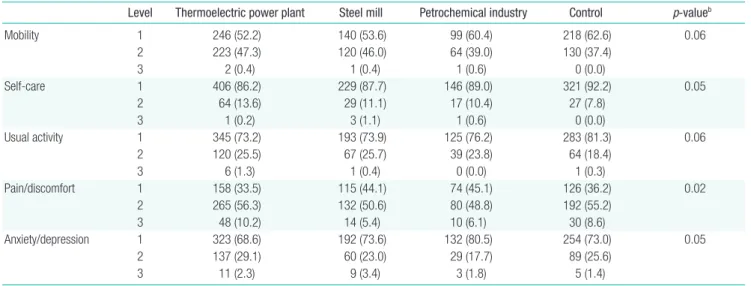
Table 2 summarizes the distribution of levels in each of the five dimensions of EQ-5D depending on the residential district.
Table 2. Distribution of Euro quality of life-5 dimension (EQ-5D)a
Level Thermoelectric power plant Steel mill Petrochemical industry Control p-valueb
Mobility 1 246 (52.2) 140 (53.6) 99 (60.4) 218 (62.6) 0.06 2 223 (47.3) 120 (46.0) 64 (39.0) 130 (37.4) 3 2 (0.4) 1 (0.4) 1 (0.6) 0 (0.0) Self-care 1 406 (86.2) 229 (87.7) 146 (89.0) 321 (92.2) 0.05 2 64 (13.6) 29 (11.1) 17 (10.4) 27 (7.8) 3 1 (0.2) 3 (1.1) 1 (0.6) 0 (0.0) Usual activity 1 345 (73.2) 193 (73.9) 125 (76.2) 283 (81.3) 0.06 2 120 (25.5) 67 (25.7) 39 (23.8) 64 (18.4) 3 6 (1.3) 1 (0.4) 0 (0.0) 1 (0.3) Pain/discomfort 1 158 (33.5) 115 (44.1) 74 (45.1) 126 (36.2) 0.02 2 265 (56.3) 132 (50.6) 80 (48.8) 192 (55.2) 3 48 (10.2) 14 (5.4) 10 (6.1) 30 (8.6) Anxiety/depression 1 323 (68.6) 192 (73.6) 132 (80.5) 254 (73.0) 0.05 2 137 (29.1) 60 (23.0) 29 (17.7) 89 (25.6) 3 11 (2.3) 9 (3.4) 3 (1.8) 5 (1.4)
Values are presented as number (%).
aEQ-5D is divided into three levels (1: no, 2: some, and 3: extreme) of perceived problems. bp-values of chi-square test.
Table 3. Odds ratios and 95% confidence interval for impaired health-related quality of life
Thermoelectric power plant Steel mill Petrochemical industry
Sex Male 1.00 (reference) 1.00 (reference) 1.00 (reference)
Female 2.76 (1.40, 5.43) 10.99 (2.12, 57.03) 5.26 (0.40, 68.25)
Age ≤59 1.00 (reference) 1.00 (reference) 1.00 (reference)
60-69 2.00 (0.78, 5.10) 7.26 (0.68, 77.45) 0.49 (0.03, 9.45) ≥70 4.91 (1.89, 12.79) 10.59 (0.89, 125.28) 2.78 (0.13, 60.47) Marital status Yes 1.00 (reference) 1.00 (reference) 1.00 (reference)
Noa 0.59 (0.30, 1.18) 0.74 (0.25, 2.21) 1.01 (0.22, 4.75)
Monthly income (104 Korean won) ≤49 1.00 (reference) 1.00 (reference) 1.00 (reference)
50-199 0.75 (0.32, 1.77) 0.23 (0.02, 2.28) 1.24 (0.07, 21.00) ≥200 0.71 (0.30, 1.71) 0.99 (0.13, 7.77) 0.78 (0.03, 19.56) Education Uneducated 1.00 (reference) 1.00 (reference) 1.00 (reference)
Elementary school 1.62 (0.74, 3.54) 1.13 (0.16, 7.81) 0.67 (0.06, 7.49) Middle school or higher 1.28 (0.48, 3.47) 0.97 (0.11, 8.67) 1.71 (0.10, 29.43) Employed status Yes 1.00 (reference) 1.00 (reference) 1.00 (reference)
No 0.80 (0.44, 1.46) 0.84 (0.27, 2.61) 0.36 (0.06, 1.97) Chronic diseaseb Yes 1.00 (reference) 1.00 (reference) 1.00 (reference)
No 0.95 (0.55, 1.63) 1.72 (0.61, 4.81) 2.50 (0.53, 11.75) Values are presented as odds ratio (95% confidence interval).
The lowest 10% level in Euro quality of life-5 dimension score of control group was cut-off values for determining impaired health-related quality of life.
aUnmarried/divorced/widowed.
The most frequently cited health issue in all of the districts was “pain/discomfort”. The percentage of residents complaining of “mobility” issues was higher in power plant districts (47.7%) and steel mill districts (46.4%) than that of petrochemical in-dustrial complex and comparison regions. The percentage of residents who complained of “self-care” issues was highest in power plant districts, at 13.8%, and lowest in comparison re-gions, at 7.8%. The percentage of residents complaining of “usu-al activities” issues was higher in power plant districts (26.8%) and steel mill districts (26.1%) than that of petrochemical in-dustrial complex and comparison regions. The percentage of residents complaining of “pain/discomfort” was higher in pow-er plant districts (66.5%) and comparison regions (63.8%) than that of steel mill districts and petrochemical industrial complex regions. The percentage of residents who complained of “anxi-ety/depression” issues was highest in power plant districts, at 31.4%, and lowest in the petrochemical industrial complex areas at, 19.5%.
The analysis of the results of socioeconomic factors that im-pact EQ-5D in residential districts is summarized in Table 3. In power plant districts, the degree of risk for a decline in QoL was significantly higher for females than males (odds ratio [OR], 2.76; 95% confidence interval [CI], 1.40 to 5.43) and residents in the over 70s age group than residents in the under 50s age group (OR, 4.91; 95% CI, 1.89 to 12.79). In steel mill districts,
the degree of risk for a decline in QoL was significantly higher for females than males (OR, 10.99; 95% CI, 2.12 to 57.03). In petrochemical industrial complex areas, there was no significant difference between socioeconomic factors in the degree of risk for a decline in QoL.
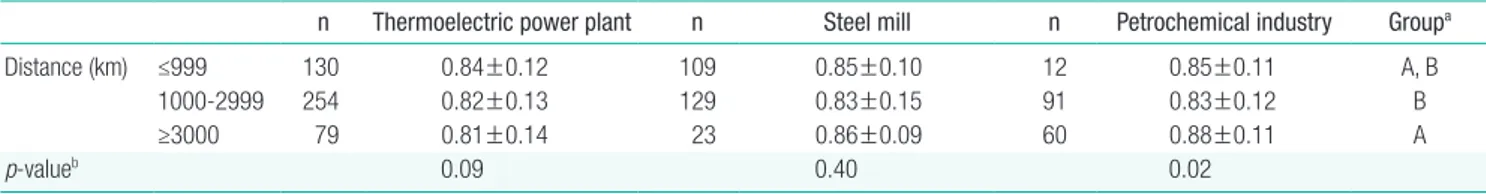
Table 4 presents the mean and standard deviation of EQ-5D according to the distance from facilities in the industrial com-plex area. For power plant and steel mill districts, there wasn’t a fixed tendency for the distance to impact the QoL. However, re-sults for the petrochemical industrial complex region, showed that the closer the distance to the facilities, the higher the QoL.
Table 5 presents the regression analysis results on the decline of QoL in residential districts according to socioeconomic lev-els. When compared to the results of the comparison regions, the degree of risk for a decline in QoL was higher in industrial areas both before and after adjusting for socioeconomic factors, but the number was not statistically significant. When we ana-lyzed each industrial complex, however, the degree of risk for a decline in QoL was significantly higher in power plant districts than in comparison regions (OR, 1.78; 95% CI, 1.14 to 2.77). The degree of risk for a decline in QoL was statistically signifi-cant even when adjusted for sex, age, marital status, average monthly income, education level, employment status, and chronic diseases (OR, 1.59; 95% CI, 1.00 to 2.53). There was no significant difference in the QoL between power plant dis-tricts, petrochemical industrial complex areas, and comparison regions.
Discussion
Today, the quality aspect of health is getting as much attention as estimating the risk of disease outbreak. This is because health has become more than just about extending life—maintaining a healthy lifestyle has been highlighted over the years. The assess-ment of medical treatassess-ment is shifting from a third party perspec-tive, in which a doctor describes symptoms, to a subjective per-spective, in which a person evaluates his/her own health [8].
QoL can be classified into HRQoL and non-HRQoL. In the field of health and medical services, HRQoL is usually used. Table 4. Means and standard deviations of Euro quality of life-5 dimension according to the distance of industrial facilities
n Thermoelectric power plant n Steel mill n Petrochemical industry Groupa
Distance (km) ≤999 130 0.84±0.12 109 0.85±0.10 12 0.85±0.11 A, B
1000-2999 254 0.82±0.13 129 0.83±0.15 91 0.83±0.12 B
≥3000 79 0.81±0.14 23 0.86±0.09 60 0.88±0.11 A
p-valueb 0.09 0.40 0.02
Values are presented as mean±standard deviation.
aThe group is divided by post-hoc Tukey test.
bp-values of one-way analysis of variance.
Table 5. Odds ratios and 95% confidence intervals for impaired health-related quality of life according to living region
Crude Adjusteda
Control 1.00 (reference) 1.00 (reference) Industrial areasb 1.32 (0.87, 2.00) 1.19 (0.77, 1.83)
Thermoelectric power plant 1.78 (1.14, 2.77) 1.59 (1.00, 2.53) Steel mill 0.99 (0.57, 1.73) 0.94 (0.53, 1.69) Petrochemical industry 0.64 (0.31, 1.33) 0.54 (0.25, 1.16) Values are presented as odds ratio (95% confidence interval).
The lowest 10% level in Euro quality of life-5 dimension score of control group was cut-off values for determining impaired health-related quality of life.
aAdjusted for sex, age, marital status, monthly income, education, employed
status, chronic disease.
bIndustrial areas were included thermoelectric power plant, steel mill,
This category includes health levels based on personal experi-ence, beliefs, and expectations, as well as the physical, mental, and social aspects of health according to cognitive abilities [5].
Compared to residents living in rural areas, those living around power plants and petrochemical industrial complexes are report-ed to have a higher outbreak of asthma, respiratory diseases, neu-rological disorders, and skin diseases. Residents living around the petrochemical industrial complex reported a higher rate of head-aches, sneezing, and itchiness and irritation of the eyes than those living in rural areas. Residents living around power plants report-ed a higher rate of headaches, itchiness and irritation of the eyes, itchy skin, and sneezing than those living in rural areas. While there weren’t any instances of sleep disruption in rural areas due to the stench emitted from facilities in the industrial complexes, there was a high rate of sleep disruption in both the petrochemi-cal industrial complex areas and the power plant districts. How-ever, the numbers were not statistically significant [1,3]. The air in power plant districts exhibited a higher concentration of fine particulate matter (PM)–e.g., PM2.5, PM10 -and heavy metals–
cadmium, chromium, arsenic, lead - than the air in other regions. These toxic substances have an effect on the outbreak of respira-tory-related diseases such as asthma and cardiovascular diseases, which the elderly (over 60 years old) are especially susceptible to [1]. In addition, these substances can have a toxic effect on the gastrointestinal tract, kidneys, blood, and nerves.
The subjects of this study complained of “pain/discomfort” for many of the health- related questions. It is suspected that this was because the age of residents living in industrial districts and comparison regions were over age 60. When EQ-5D tests were conducted on senior citizens who visited health centers, the re-sults also showed that they most frequently complained of “pain/discomfort” [9]. This could be because as people age, they become more sensitive to pain, and therefore complain of more pain related symptoms. In terms of socioeconomic factors, females reported a lower QoL than males, and the difference seems to result from Korea’s patriarchal culture [10,11]. The distance between industrial complexes did not contribute to a decline in QoL. The distance from the facilities was divided by 1 km and 3 km, which is believed to be too small to determine the effect of distance on QoL [12].
Because this study was carried out as a cross-sectional design study, it shows the correlation between residential districts and QoL, but does not have enough evidence to prove a causal rela-tionship between the two. Moreover, this study cannot repre-sent the whole population because it was only conducted in the Chungnam area. Finally, the selected subject pool was limited as well, since surveys were conducted only on medical check-up participants.
By measuring the QoL in industrial complex areas in Chun-gnam and in comparison areas, this study investigated the corre-lation between residential environment and subjective health. This study showed that the QoL declined for residents living around industrial complexes—especially those living around power plants. Therefore, additional assessments of factors that could negatively affect the HRQoL around power plants and policies to prevent them are needed.
Conflict of Interest
The authors have no conflicts of interest associated with mate-rial presented in this paper.
ORCID
Heechan Kim http://orcid.org/0000-0002-0997-7112 Sangchul Roh http://orcid.org/0000-0003-4467-5416
References
1. Lee JH, Kang HS, Kim BB. Health effects of the offensive odor in residents living near the petrochemical industries complex area and the thermoelectric power plant. Korean J Environ Health 2007; 33(2):83-91 (Korean).
2. Joo Y, Roh S. Exposure assessment of heavy metals using exposure biomarkers among residents living near a Chungcheongnam-do province industrial complex area. J Environ Health Sci 2016; 42(3):213-223 (Korean).
3. Yom YK, Ji SK, Li SH, Cho TJ, Jeon HI, Jang BK, et al. Concentra-tion of heavy metals in air and soil around the d iron-manufactur-ing company area in Chungnam, Korea. J Environ Sanit Eng 2009; 24(1):25-32 (Korean).
4. Lee MS. The principles and values of health promotion: building upon the Ottawa charter and related WHO documents. Korean J Health Educ Promot 2015;32(4):1-11 (Korean).
5. Kim SH, Jo MW, Ahn J, Shin S, Ock M, Park J, et al. The valuation of EQ-5D-5L health states in Korea. Value Health 2014;17(7): A753.
6. Nam HS, Kim KY, Kwon IS, Koh KW, Poul K. EQ-5D Korean val-uation study using time trade-off method [cited 2016 Aug 28]. Available from http://cdc.go.kr/CDC/info/CdcKrInfo0301. jsp?menuIds=HOME001-MNU1154-MNU0005-MNU0037-MNU1380&cid=12449 (Korean).
7. Jo MW, Lee SI. Validity and reliability of Korean EQ-5D valuation study using the time-trade off method. Korean J Health Promot Dis Prev 2007;7(2):96-103 (Korean).
8. Jo DG. A spatial analysis of sociodemographic correlates of health related QoL. Korea J Popul Stud 2009;32(3):1-20 (Korean). 9. Kim HR. Health-related QoL and its affecting factors among the
aged in one Korean community. Korean J Health Serv Manag 2013;7(4):167-178 (Korean).
10. Chung Y, Cho YH. Gender difference in QoL after controlling for related factors among Korean young-old and old-old elderly. J Ag-ric Med Community Health 2014;39(3):176-186 (Korean). 11. Lee HS. The factors influencing health-related QoL in the elderly:
focused on the general characteristics, health habits, mental health, chronic diseases, and nutrient intake status: data from the fifth Korea National Health and Nutrition Examination Survey (KNHANES
V), 2010-2012. Korean J Community Nutr 2014;19(5):479-489 (Korean).
12. Ranft U, Miskovic P, Pesch B, Jakubis P, Fabianova E, Keegan T, et al. Association between arsenic exposure from a coal-burning pow-er plant and urinary arsenic concentrations in Prievidza District, Slovakia. Environ Health Perspect 2003;111(7):889-894.