Printed in the Republic of Korea
Chemical Compositions and Lead Isotope Ratios of Some Glass Beads from
Seokga-tap, Gyeongju
Hyung-tae Kang* and Eun-young Yun
Conservation Science Team, National Museum of Korea, 135 Seobinggo-ro, Yongsan-gu, Seoul 140-026, Korea
Manuscript received 28 September 2012; revised 23 October 2012; accepted 1 November 2012 ⓒ The Korean Society of Conservation Science for Cultural Heritage 2012
Abstract: Chemical compositions and lead isotope ratios for four glass bead samples of Seokga-tap were analyzed and the results were organized. Among 4 glass beads found in the Seokga-tap, 3 pieces were lead glass. Manufacturing method was to firstly grind pebbles finely and mix lead ore to be melt at 740~760℃. The mixed ratio of silica and lead was 3:7. Moreover, The evaluation on the lead isotope ratio indicated that two lead glass pieces used lead ore from northern Korea. One piece has the direction of southern Korea lead ore, but it requires a further review. One glass bead of Seokga-tap was brown and it was potash lead glass (K2O-PbO-SiO2) System. The mixed ratio was
ap-proximately 50:10:40 for silica, natural saltpeter, and lead, respectively. Lead isotope ratio data fell within the lead ore from northern China. Therefore, it was concluded that potash lead glass found in the Seokga-tap was produced in northern area of China at the end of 10th
century and transferred to the Seokga-tap.
Key words: Seokga-tap, Lead glass, Potash lead glass, Chemical com-position, Lead isotope ratio
*Corresponding author: Hyung-tae Kang E-mail: [email protected]
1. INTRODUCTION
The objects found in the Seokga-tap included gilt-bronze sarira container, silver sarira container, Mugujeonggwang daedharani gyeong (Pure Light Dharani Sutra), and glass beads, designated as the 126th National Treasure, as well as silver plate decorated
with apricot flower, ink stick, cloth of daedharani gyeong, and glass bead fragments (National Museum of Korea, 2009). As conducting an investigation on these objects, number for each material is confirmed.
Among these, glass beads were approximately 740 items and they were various colors including greenish blue, yellow, orange, white, green, brown, and light gray. The specific gravity of glass beads was measured and majority of them showed specific gravity over 3.0.It reflected that glass beads of Seokga-tap had high lead content and were mainly lead glass. If so, why the glass beads in Seokga-tap were mostly lead glass? What were the raw materials
for lead glass and what was the constituent ratio? Should we consider these as domestic products? When were they produced? If we approach to the glass bead of Seokga-tap from these aspects, we will be able to understand the characteristics of Seokga-tap to a certain degree. Glass beads are small and have simple shape and structure. Moreover, they had been manufactured with little changes in production method (Bowman, 1991). Therefore, glass beads have limited power to explain archeologically (Frank, 1982).
To understand glass beads of Seokga-tap, first of all, we have to conduct studies evaluating the type and characteristics of raw materials (Bowman, 1991; Brill et al., 1991a) as well as manufacturing technology (Brill et al., 1991b) through scientific investigation (Kang et al., 2004; 2005) and analysis (Frank, 1982; Henderson, 2000; Lambert, 1998).
Four small fragments among glass beads of Seokga-tap were selected and several scientific analyses (National Museum of Korea, 2009) were performed to find physical (Kang et al., 2008; Kim, 2001) and chemical (Kang et al., 2008; Kim et al., 2006) characteristics. Ten oxide concentrations including major and minor components were determined using Scanning electron microscope equipped with energy dispersive spectrometer (SEM/EDS) (Kim, 2001). Moreover, thermal ionization mass spectrometer (TIMS) was used to estimate the lead isotope ratio of each sample.
From these scientific analysis, we estimated the raw material characteristics (Kim et al., 2007; Kang et al., 2008), manufacturing technology (Koezuka, 1991; Kim et al., 2007), and the origin (Kang et al., 2004; Kim, 2001) of raw material for glass beads found in the Seokga-tap.
2. MATERIALS AND ANALYSIS
2.1. Specific gravitySpecific gravity was determined using digital scale (Mettler Toledo, PR503) as a way to classify the property of Seokga-tap glass beads. The weight of glass beads in ethanol (W2) and that
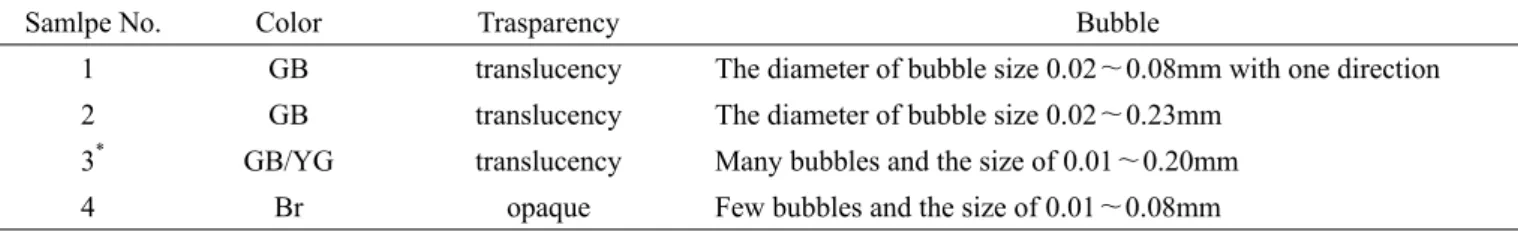
Samlpe No. Color Trasparency Bubble
1 GB translucency The diameter of bubble size 0.02~0.08mm with one direction
2 GB translucency The diameter of bubble size 0.02~0.23mm
3* GB/YG translucency Many bubbles and the size of 0.01~0.20mm
4 Br opaque Few bubbles and the size of 0.01~0.08mm
GB : greenish blue, YG : yellowish green, Br : brown, * Two colors are present in the cross section of glass. Table 1. Physical data of glass beads from Seokga-tap.
No. Color S.G. Na2O MgO Al2O3 SiO2 K2O CaO MnO Fe2O3 CuO PbO Total
1 GB 5.08 0.04 - 0.12 28.0 0.08 0.04 - 0.14 0.89 71.4 100.0
2 GB 5.50 0.02 - 0.11 30.0 0.07 0.03 - 0.07 0.54 69.8 100.0
3 GB/YG 5.18 0.05 0.06 0.13 33.0 0.06 0.05 - 0.08 0.59 66.5 100.0
4 BR 3.14 0.14 0.01 0.14 46.1 11.7 0.09 - 0.11 0.20 35.8 94.3
a
Bulguksa Seokgatap Relics., vol.4, pp.216(2009)
Table 2. Chemical composition and specific gravity of glass beads from Seokga-tapa.
in water (W1) was measured to calculate the specific gravity of glass beads as following; [W1/ (W1-W2)]S, S = the specific gravity of ethanol.
2.2. Energy dispersive spectrometer (SEM-EDS) (Kim, 2001; Kim et al., 2006)
Energy Dispersive Spectrometer (EDS:Kevex Super Dry, USA) attached to Scanning Electron Microscope (SEM: Shimagu, Japan) was used to analyze the chemical compositions of glass beads sample, while analysis condition was set as acceleration voltage 15kV, analyzing time 200sec, and measurement area 60×60μm2.
Four samples were mounted in epoxy resin and ground with diamond and silica suspension and the cross section was analyzed. The sample was washed using ultrasound washer for 5 minutes 3 times between each grinding step not to contaminate the sample. To quantify and acquire a reproducible analysis results, the composition analysis of the ancient glass was measured on the base of standard curves of major and minor concentrations estimated from glass standard sample (R6, RM126A, and PbF2).
2.3. Thermal ionization mass spectrometer (TIMS) SEM-EDS analysis on the glass bead sample showed that all 4 samples were lead glass with high lead content. Approximately 0.05mg fine sample was inserted into a Teflon vial. Then, 2~3ml purified aqua regia was added into the vial and it was heated overnight on 150℃ hot plate. Afterward, it was dried by heating the vial with open lead and 2ml of 6N hydrochloric acid was added to dry it later. Finally, the sample was dissolved into 1N HBr 1ml. The sample was centrifuged and lead was separated using anion
exchange resin (AG1-X8, chloride form, 100-200#) and 1N HBr. The separated lead was set on the Re single filament and isotope ration was measured using thermal ionization mass spectrometer (TIMS, Model: VG Sector 54-30) at the Korea Basic Science Institute, Daejeon. Analysis result was adjusted using the standard material (NBS SRM 981) measurement. The background noise was always approximately 1ng during analysis.
3. RESULTS AND DISCUSSION
3.1. BubbleCross sections of four glass bead samples were observed and visual characteristics including color, bubble, and transparency was presented in the Table 1. As it is shown in the table, actual glass beads are greenishblue and brown and No. 3 sample had greenishblue and yellowish green at the same time. Greenish blue glass beads were all semi -transparent and it contains small and large bubbles, diameter distributing between 0.01 and 0.2mm. The number, size, and direction of bubble in the glass sample are information allowing the manufacturing technique estimation. Especially, No. 3 sample had many bubbles and they were formed due to short cooling period, which does not allow air escaping from the bead (Kang et al., 2008).
3.2. Chemical composition
Specific gravity and composition results of the four bead samples are shown in the Table 2. Three points of each sample were analyzed for each sample. The compositions of glasses showed that they can be divided into two types. In other words,
Serial No.
Original sample
No.
Site Type Color Age Na2O MgO Al2O3SiO2 K2O CaO TiO2MnO Fe2O3CuO PbO
1a GS-15 Dingxian, Hebei glass grapes dark brown 977AD 0.08 0.08 1.11 36.93 8.45 0.36 - - 4.13 - 45.93
2a GS-18 Mixian, Henan glass egg dark red 999AD 0.13 0.31 2.62 33.78 14.78 3.52 - - 3.15 - 40.15
3a GS-19 Mixian, Henan glass egg dark yellow 999AD 0.11 0.3 2.22 31.66 13.75 3.35 - - 4.39 - 41.57
4a GS-20 Mixian, Henan glass goose green 999AD 0.08 0.04 - - 11.45 0.17 - - 0.15 - 47.34
5a GS-24 Mixian, Henan glass calabash green 999AD 0.16 2.26 0.62 30.02 6.08 2.32 - - 0.28 - 57.25
6a 39 Mixian, Henan glass vessel ? 999AD 0.11 0.30 2.22 31.66 13.75 3.35 - - 4.39 - 41.57
7a 41 Lingtai, Gansu glass gourd ? 999AD 0.11 0.10 - 36.32 11.94 0.13 - 0.01 0.16 0.13 50.31 8a GS-11 Lingtai, Gansu glasss bottle green 10C 0.29 0.1 - 36.32 10.09 0.13 - - 0.16 - 50.31 9a 1570 Guan Yin glass buddha turbid colorless 12-17C 0.22 0.05 0.31 44.2 16.6 0.34 - - 2.60 - 36.0 10a 1563 Unknown glass buddha gray 17-19C 0.25 0.12 0.17 40 10.6 0.27 - 0.025 0.15 0.01 48.5 11b QG-2 Unknown jadeite glass turbid green 18C 2.60 - 0.43 38.65 9.59 - - - 0.61 0.37 44.74 12b QG-11 Unknown glass bowl colorless 18-19C 0.19 - 0.08 42.44 14.54 0.03 - - 0.09 - 38.57 13a 1560 Unknown large glass bead bright green 20C(?) 2.38 0.093 0.26 62.1 14.9 1.86 - 0.009 0.17 - 17.8 14a 4102 Unknown carved glass colorless 20C(?) 0.68 0.074 0.13 42.3 10.9 0.76 - 0.15 0.12 - 44.9 a
Scientific Research in Early Chinese Glass(1991) p.18, 30, 57. bJournal of Glass Studies(1993), p.104. Table 3. Chemical composition(wt %) of potash-lead glasses from China and Seokga-tap.
greenish blue glass samples (No. 1, 2, and 3) were all PbO-SiO2
series with PbO content about 70% and specific gravity ranged 5.08~5.50. One brown glass sample (No. 4) was K2O-PbO-SiO2
series containing 11.7% K2O and 35.8% PbO and specific gravity
3.14.
3.2.1. Lead glass (PbO-SiO2)
From the analysis of the glass beads found in the Seokga-tap, Three pieces of greenish blue were found to be lead glass. It was reported that, when the specific gravity is over 4.50, lead content is over 70% (Kang et al., 2003; Brill et al., 1979; Shi et al., 1991). When the specific gravity of approximately 740 glass beads of Seokga-tap was measured, most of them had specific gravity over 4.5. It indicated that majority of them were lead glass. The data in Table 2 showed that Al2O3 content of lead glass was less than
0.20%, which means that it was made from pebbles or quartz with little alumina as raw material of silica. In other words, it was manufactured by grinding pebbles or quartz finely and adding lead ore. It contains 30 % of silica and 70~75% of lead ore. Considering the ratio of silica and lead, melting temperature (Wedepoho et al., 1995) was estimated 740~760℃. As shown, lead glass has strength to be made easily in large quantity, because it is melted in low temperature when lead ore is added to silica as fusing agent. It is believed to be related that most of early glass products in China and Japan are lead glass (Brill et al., 1991a; Koezuka, 2001).
Coloring agents for greenishblue of glass bead is due to the
iron and copper content (Zvigoffer, 1980; Kang et al., 2008). Especially, CuO concentration was 0.9 ~ 1.2% and it is believe that it is the main contributor of the color.
3.2.2. Potash lead glass (K2O-PbO-SiO2)
One Seokga-tap glass bead sample (no. 4) is brown and it is potash lead glass containing 11.7% K2O and 35.8% PbO as shown
in the Table 2. When each component concentration was looked into, MgO content was negligibly low. It was believed that wood or plant materials (Lambert, 1998; Mirti et al., 2001) were not used for potassium but natural saltpeter (KNO3) (Zang, 1991; Shi et
al., 1993) was used. Moreover, it was highly possible that pebbles
or quartz containing little alumina was used as the raw material of silica, since Al2O3 concentration was very low (>0.3%) in Table
2 (Zang, 1991).
In other words, pebbles were ground finely for silicate source and natural saltpeter and lead ore added to it (Lambert, 1998; Brill
et al., 1991b). Then, it was melted to manufacture glass beads.
Moreover, among glass beads found in the Seokga-tap, one can consider glass beads in specific gravity of 3.1∼3.8 as potash lead glass. It is not sure exactly how many of them are brown glass, but there are quite a few.
Almost all of researcher believed that potash lead glass was first invented in China (Koezuka, 2001; Shi et al.,1993). Potash lead glass starts to be found in China from the end of 10th century little by little, and it was produced after 12th century (Koezuka, 1991; 2001). There
Figure 1. Distribution of Chinese potash lead glasses(▲) within the dot line and the position of one potash lead glass(■) of Seokga-tap.
Sample No. Glass system Lead isotope ratio
206/204 207/204 208/204 207/206 208/206
1 PbO-SiO2 17.913 15.934 39.826 0.8895 2.2209
2 PbO-SiO2 18.027 16.081 40.300 0.8919 2.2331
3 PbO-SiO2 20.018 15.861 39.194 0.7923 1.9561
Table 4. Lead isotope ratios of lead glass(PbO-SiO2) from Seokga-tap.
in China during this era was found in excavation sites of Japan (Shi
et al., 1991; Koezuka, 1991). Chemical composition data of Chinese
potash lead glass was extracted from literature and it was compared with those of potash lead glass of Seokga-tap (Table 3).
The relationship between major components in potash lead glass of China was shown in Figure 1. It showed that K2O and PbO
ranged 8~17% and 35~55%, respectively. Seokga-tap potash glass (■) also fell into this range. The potash lead glass found in the Seokga-tap was suggested to be made in China as considering the chemical compositions. It is because potash lead glass has origin of China and Seokga-tap glass bead was in the same composition range. If potash lead glass was domestically made, it would have different composition than those made in China. Alternatively, lead isotope analysis can be applied if the potash lead glass is domestic production or not. And if it was included in Chinese range, we can estimate where the lead ore from which part of China was used. Simply speaking, manufacturing region of potash lead glass can be estimated from compositions and isotope ratio of lead. 3.3. Lead isotope ratio (Brill et al., 1979; Mabuchi et al., 1983)
Lead isotope ratio method is widely used as an effective tool
for provenance study of objects (e.g., bronze, glass, enamel, and pigment) containing lead (Brill et al., 1979; 1991a). It is possible to estimate the origin of the lead ore by comparing the lead isotope ratio of lead ore in a specific area (Mabuchi et al., 1983; 1987) with it of archaeological objects. That says it is an effective tool to suggest where the lead ore came from to make the object or where the object was made (Kang et al., 2008; Kim et al., 2007; Koezuka, 2001). This method also has strength and weakness like all other scientific methods.
Main limitations are (1) sometime lead ore from different regions shows similar lead isotope ratio, although they are expected to show difference and (2) objects are melted together in one crucible to reuse and it can fuse different lead ores. However, it has strength to get lead isotope ratio data from microscopic sample and it is applicable to wide range of archaeological materials containing lead (Mabuchi et al., 1983; Wedepoho et al., 1997).
Lead isotope ratio analysis has firm status as a method to classify lead sources used for making objects into same or different geological groups. As the data is carefully elucidated (Coomans
et al., 1979), it provides a lead to estimate the origin of raw
materials. Moreover, the confidence of results can be improved by interpreting lead isotope ratio based on archaeological and historical evidences (Brill et al., 1979; Mabuchi et al,1983).
3.3.1. Lead glass (PbO-SiO2)
Table 4 showed the lead isotope ratio of Seokga-tap lead glass (no. 1∼3). It calculates the ratio of 4 lead isotopes (Pb-204, Pb-206, Pb-207, and Pb-208). Two axes using 207/206 and 208/206 were used to estimate the origin of lead as shown in ★ Figure 2 (Mabuchi et al., 1983, 1987). It shows the lead ore region (northern Korea ▲, southern Korea ▲, northern China ■, southern China ■, and Japan ⅹ) (Mabuchi et al., 1987)well separated and used for classifying the source of lead.
Lead isotope ratio data of three samples (no. 1∼3) in Table 4 were located on the Figure 2. Two (no. 1 and 2) were located at the northern Korea and one (no. 3) was located at the southern Korea direction, but it was quite apart from lead ore range of southern Korea region.
3.3.2. Potash lead glass (K2O-PbO-SiO2)
Sample no. Site Type Age Lead isotope ratio
206/204 207/204 208/204 207/206 208/206
1a unknown bead(1560) 20C 18.405 15.647 38.487 0.8502 2.0991
2a unknown buddha(1563) 17~19C 18.410 15.638 38.409 0.8494 2.0863
3a Guan Yin buddha(1570) 12~17C 18.444 15.656 38.488 0.8488 2.0868
4b Mixian, Henan glass egg AD 999 17.434 15.486 38.097 0.8883 2.1852
5b Mixian, Henan glass bottle AD 999 18.179 15.655 38.750 0.8612 2.1316
6b Mixian, Henan glaze AD 999 17.743 15.546 38.778 0.8762 2.1856
7b Mixian, Henan glass piece AD 999 17.873 15.580 38.196 0.8717 2.1371
8 Seokga-tap, Gyeongju glass bead AD 8C 18.092 16.012 39.163 0.8850 2.1622
a
Scientific Research in Early Chinese Glass(1991), p.76. bBulletin of the National Museum of Japanese History(2001), No.86, p.246. Table 5. Lead isotope ratios of potash-lead glass(K2O-PbO-SiO2) from China and Seokga-tap.
Figure 2. Territorial map of lead ores of Korea, China and Japan and the position of three lead glasses(●) of Seokga-tap.
Figure 3. Two groups(▲ and ○) for Chinese potash lead glass and the position of potash lead glass(■) of Seokga-tap.
approximately 50 beads were believed to be potash lead glass among Seokga-tap. This glass series was supposed to be Chinese product and firstly invented at the end of 10th century (Koezuka,
2001; Shi et al., 1993). To compare with Seokga-tap glass and Chinese glass, lead isotope ratio data of potash lead glass from China was extracted in the literatures and presented by era in Table 5. Table showed it well by era and region, so it allows comparing the location of lead isotope ratio.
The data was presented at Table 5 and showed clear distinction in Figure 3 with northern China (▲ 0.861~0.888 and 2.131~ 2.186) and southern China (● 0.848~0.850 and 2.086~2.099), respectively.
When it was seen by era in Table 5, it was interesting that only lead ore from northern China was used for production of potash lead glasses (no. 4~7) in AD 999, while lead ore from southern China was used for them (no. 1~3) in AD 12~20 centuries. Figure 3 included potash lead glass (no. 8) of Seokga-tap in Table 5 based on these data. The Seokga-tap glass (■) in Figure 3 indicated that it was included in the northern China lead ore area.
This study only analyzed a potash lead glass of Seokga-tap and it fell exactly in the range of composition and lead isotope ratio
of Chinese potash lead glass. Therefore, the results overall suggested that potash lead glass found in the Seokga-tap was made in China in the end of 10th century and lead was from ore of northern
China.
4. CONCLUSION
Chemical composition and lead isotope ratio for four glass bead samples of Seokga-tap were analyzed and the results were organized.
Lead glass (PbO-SiO2) : Among 4 glass beads found in the
Seokga-tap, 3 pieces were lead glass. Manufacturing method was to firstly grind pebbles finely and mix lead ore to be melt at 740~ 760℃. The mixed ratio of pebbles and lead ore was 22:78. Moreover, lead isotope ratio was analyzed to estimate if the lead glass found in the Seokga-tap was made from domestic raw material or not. The evaluation on the lead isotope ratio indicated that two lead glass pieces (No. 1 and 2) used lead ore from northern Korea. One piece (No. 3) has the direction of southern Korea lead ore, but it requires a further review.
Potash lead glass (K2O-PbO-SiO2) : One glass bead (No. 4) Seokga-tap was brown and it was potash lead glass containing 8.36% K2O and 46.9% PbO. The manufacturing method was to
grind pebbles finely and to melt it at high temperature after adding natural saltpeter and lead ore. The mixed ratio was approximately 45:10:45 for silica, natural saltpeter, and lead ore, respectively. Potash lead glass was invented in China at the end of 10th century
and it was produced and used throughout 12~20th century. When composition of potash lead glass found in the Seokga-tap and China was compared, K2O and PbO fell into the 8~15% and 35~
55% ranges, respectively. Lead isotope ratio data fell within the lead ore from northern China. Therefore, it was concluded that potash lead glass found in the Seokga-tap was produced in northern area of China at the end of 10th century and transferred to the Seokga-tap.
REFERENCE
Bowman, S., 1991, Science and the Past. British Museum Press, p.37~56.
Brill, R.H., Yamasaki, K., Barnes, I.L., Rosman, K.J.R. and Diaz, M., 1979, Lead Isotopes in Some Japanese and Chinese Glasses. ARS ORIENTALIS, 11, Freer Gallery of Art, Smithsonian Institution, Dept of the History of Art, University of Michigan, p.87~109. Brill, R.H. and Martin, J.H., 1991, Scientific Research in Early Chinese
Glass. Proceeding of the Archaeometry Glass Sessions of the 1984 International Symposium on Glass, Beijing, September 7, 1984. Brill, R.H., Stephen, Tong, S.C. and Doris, D, 1991, Chemical Analysis
of Some Early Chinese Glasses, Scientific Research in Early Chinese Glass. Proceeding of the Archaeometry Glass Session of the 1984 International Symposium on Glass, Beijing, September 7, 1984, p.31~58.
Coomans, D. and Massart, D.L., 1979, Optimization by statistical linear discriminant analysis in analytical chemistry, Analytica Chimica Acta, 112 (2), p.97~122.
Frank, S., 1982, Glass and Archaeology, Academic Press, p.104~127. Henderson, J., 2000, The Science and Archaeology of Materials,
Routledge, p.24~43.
Kang, H.T., Kim, S.B., Huh, W.Y. and Kim, G.H., 2003, Application of science for interpreting archaeological materials (Ⅱ) - Production and flow of lead glass from Mireuksa Temple-, MunHwaJae, 36, Nation Research Institute of Cultural Properties, 241~266. Kang, H.T., Chung, G.R., Huh, W.Y., Kim, S.B. and Cho, N.C., 2004.
August, Chemical compositions and Lead Isotope ratios of The Lead glass from Wanggung-ni, Iksan, Chollabuk-do, Journal of Korean Ancient Historical Society, 45, p.31~48.
Kang, H.T., Chung, Y.D., Cho, J.Y. and Kim, H.S., 2005, Analysis of glaze on brick, green-glazed earthenware in Unified Silla period, Seonsa wa Kodae, 22, Korean Association for Ancient studies Korea, p.211~222.
Kang, H.T., Yun, E.Y. and Ahn, J.Y., 2008, Chemical compositions of glass beads from tombs of Chunburi, Ulleung-do, Ulleung-do Site, Report of research of Antiquities of The National Museum of Korea Vol. ⅩⅩⅩⅧ, National Museum of Korea, p.361~372.
Kang, H.T and Cho, N.C., 2008, Application of science for interpreting archaeoloical materials (Ⅲ)-Characterization of some Western Asia glass vessels from South Mound of Hwangnamdaechong, Mun Hwa Jae, 41 (1), National Research Institute of Cultural Heritage, p.5~19. Kim, G.H., 2001, A study of archaeological chemistry on ancient glasses
found in Korea, Ph.D. thesis, Chung-Ang University.
Kim, G.H., Song, U.N. and Kim, N.Y., 2006, Chemical composition of glass bead from Sucheong-dong Site,Osan city, Gyeonggi Institute of Cultural Properties, 113~128.
Kim, G.H., Kang, H.T. and Lee, Y.H., 2007, Characteristics of Glass materials from Tomb of King Muryeong (II), Research Report No. 19, Kongju National Museum, p.103~131.
Koezuka T., 1991, Investigation of Ancient Glasses Found in Japan - Historical evolution of Ancient Glass System, 147~157.
Koezuka, T., 2001, Chemical Composition and Lead Isotope Ratios of Ancient Glass Found in Japan, Bulletin of the National Museum of Japanese History, p.233~249.
Lambert, J.B., 1998, Traces of the Past, Perseus Publishing, p.104~127. Mabuchi, H., and Hirao, Y., 1983. Study of Han-style mirrors by lead
isotope method.Ⅱ, MUSEUM, 382, p.16~26.
Mabuchi, H., and Hirao Y., 1987. Lead isotope ratios of lead ores in East Asia –in relation to bronze artifacts, Kōkogaku zasshi, 73 (2), p.199~245.
Mirti, P., David, P., Gulmini, M. and Sagui L., 2001, Glass fragments from the Crypta Balbi in Rome: The composition of eighth-century fragments, Archaeometry, 43 (4), p.491~502.
National Museum of Korea, 2009, Conservation Treatment and Analysis Bulguksa Seokgatap Relics_Vol.4, National Museum of Korea.
Shi Meiguang et al.,1991, Investigations of Some Ancient Chinese Lead Glasses, Scientific Research in Early Chinese Glass, Proceeding of the Archaeometry Glass Session of the 1984 International Symposium on Glass, Beijing, September 7, 1984, p.30.
Shi Meiguang and Zhou Fuzheng, 1993, Some Chinese Glasses of the Qing Dynasty, Journal of Glass Studies, 35, p.102~105.
Wedepoho, K.H., Krueger, I., and Hartmann, G, 1997, Medieval Lead Glass from Northwestern Europe, Journal of Glass Studies, 37, p.65~82.
Zang F., 1991, Scientific Studies of Early Glasses Excavated in China, 157~165.
Zvigoffer, 1980, Archaeological Chemistry, John Wiley & Sons, p.136~166.