778
-Infrared-to-Visible Up-conversion in Er-Pr-Yb Triply Doped
Oxyfluoride Glass Ceramics
Su-A Song1 and Ki-Soo Lim2*
1Department of Aerospace Engineering, Korea Aerospace University, Goyang 10540, Korea 2Department of Physics, Chungbuk National University, Cheongju 28644, Korea
(Received August 30, 2016 : revised October 17, 2016 : accepted November 29, 2016)
We synthesized Er3+-Yb3+, Pr3+-Yb3+, and Er3+-Pr3+-Yb3+ -doped oxyfluoride glass ceramics containing CaF2 nanocrystals by proper thermal treatments. Spectral characteristics of down- and up-converted emissions
in three kinds of glass ceramics under 365-nm and 980-nm excitations were compared and explained by cross relaxations, excited-state absorptions, and energy-transfer processes between different ions. The huge reduction of up-conversion emission in the triply doped glass ceramics under 980-nm excitation compared to the Er3+-Yb3+ codoped one was explained by the split pump power and the direct energy transfer from Er3+ to Pr3+ ions. Increasing Yb3+ concentration from 2% to 10% in the triply doped glass ceramics showed more than quadratic enhancement of the absorbed power, and we explained it by the enhanced energy-transfer efficiency from Yb3+ to Er3+ ions. We also observed enhanced up-converted emissions of Er3+ and Pr3+ ions in three kinds of glass ceramics under simultaneous excitation at 980 nm and 1550 nm, and suggested detailed up-conversion mechanisms.
Keywords : Glass ceramics, Er, Pr, Yb, Up-conversion
OCIS codes : (160.2540) Fluorescent and luminescent materials; (160.2750) Glass and other amorphous materials; (160.4236) Nanomaterials; (160.5690) Rare-earth-doped materials; (190.7220) Upconversion
*Corresponding author: [email protected]
Color versions of one or more of the figures in this paper are available online.
*
This is an Open Access article distributed under the terms of the Creative Commons Attribution Non-Commercial License (http://creativecommons.org/ licenses/by-nc/3.0/) which permits unrestricted non-commercial use, distribution, and reproduction in any medium, provided the original work is properly cited.
*Copyright 2016 Optical Society of Korea I. INTRODUCTION
Up-conversion materials doped with rare-earth ions have been a significant interest in recent years due to various potential applications, such as biological labeling, three-dimen-sional displays, solar cells, etc. [1-3]. Oxyfluoride glass ceramics have been widely investigated as host materials for rare-earth ions recently, because they have the advantages of not only low phonon energies but also high chemical and mechanical stabilities [4]. CaF2 is a nontoxic optical material with a wide spectral region of transparency, high solubility of rare-earth ions [5], and a good match of refractive index with aluminosilicate glass [6]. Doped rare-earth ions are confined in CaF2 nanocrystals with much less phonon energy, yielding large quantum efficiency [7]. A solar-cell material with a high band gap, such as amorphous silicon, loses the near-infrared
portion of the solar spectrum, above 730 nm, but multiply doped systems may improve up-conversion characteristics, because a rare-earth ion has many absorption levels in the near-infrared. Most previous studies on up-conversion processes have been reported for singly or doubly doped materials. Er3+ ions showing green and red up-conversion emissions are known as the most efficient up-conversion activators [8], and Pr3+ ions have many energy levels close to those of Er3+ ions, enabling energy transfer between these two species. Yb3+ ions are well-known sensitizers that have a high absorption cross section around 980 nm and transfer energy efficiently to Er3+ or Pr3+ ions [9, 10].
There have been only a few investigations of triply doped glass ceramics. The up-conversion properties of a system triply doped with Er3+, Pr3+, and Yb3+ was only investigated in tellurite glass, as far as we know [11]. In the present study, we
FIG. 1. XRD patterns of ErPrYb_GC, ErYb_GC, PrYb_GC, and ErPrYb_Glass.
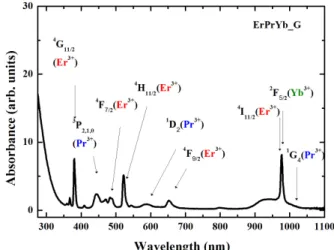
FIG. 2. Absorption spectrum of ErPrYb_Glass.
FIG. 3. Down-conversion emission spectra of ErPrYb_GC, ErYb_GC, PrYb_GC, ErPrYb_G, ErYb_G, and PrYb_G, upon 365-nm excitation.
report the infrared-to-visible up-conversion energy transfers in Er3+, Pr3+, and Yb3+ triply doped transparent glass ceramics containing CaF2 nanocrystals, and compare the results to those in double doped systems under excitation at 980 nm. We also compare the up-conversion emissions of triply doped glass ceramics under excitation at 980 nm to those under simultaneous excitations at 980 and 1550 nm.
II. EXPERIMENTAL
Oxyfluoride glass hosts were prepared with the com-position (in mol%) 45SiO2-22Al2O3-11CaO-22CaF2. Dopants
were 1%Er-2%Yb (ErYb), 1%Pr-2%Yb (PrYb), 1%Er-1% Pr-2%Yb (ErPrYb), and 1%Er-1%Pr-10%Yb (ErPrYb(10)). For each batch, the raw material was mixed and melted in a covered platinum crucible in air at 1400˚C for 1 h, and then cast into an iron mold, followed by annealing at 530˚ C for 10 h to release the inner stress. The temperatures of the glass transition temperature and the onset of crystalli-zation were measured by differential thermal analysis (DTA, SDT2960). The glass samples were then annealed precisely at 760˚C for 4 h to induce crystallization, and polished for optical measurements. Oxyfluoride precursor glass and glass ceramic samples are denoted as G and GC respectively. We confirmed the formation of CaF2 crystal phases by
x-ray diffraction (XRD, RIGAKU, SmartLab) analysis. The up-conversion and down-conversion luminescences were measured with a monochromator (DK240) and photomultiplier tube (PMT) under diode-laser excitations at 365, 980, and 1550 nm.
III. RESULTS AND DISCUSSION
Figure 1 shows the XRD patterns of triply doped samples.
The ErPrYb_G shows broad humps due to the amorphous structure. The background patterns of the ErYb_GC, PrYb_GC, and ErPrYb_GC treated at 760°C show peaks easily assigned to cubic CaF2 (JCPDS 35-0816). We estimate the average nanocrystal size as 40-50 nm from XRD line- broadening measurements, using Sherrer’s equation [12],
cos (1) where D (hkl) is the crystal size in the direction (hkl), λ is the wavelength of the x-rays, θ is the angle of diffraction, β is the full width at half maximum (FWHM) of the diffraction peak, and K is the instrument’s constant (0.9). The absorption spectrum of the glass reveals three kinds of dopants, as shown in Fig. 2. All three ions have absorptions at 980 nm.
The down-conversion spectra of the ErYb_GC, PrYb_GC, and ErPrYb_GC under excitation at 365 nm showed emissions tens of times stronger than those of the glasses with the same dopants, as shown in Fig. 3. The enhancement can
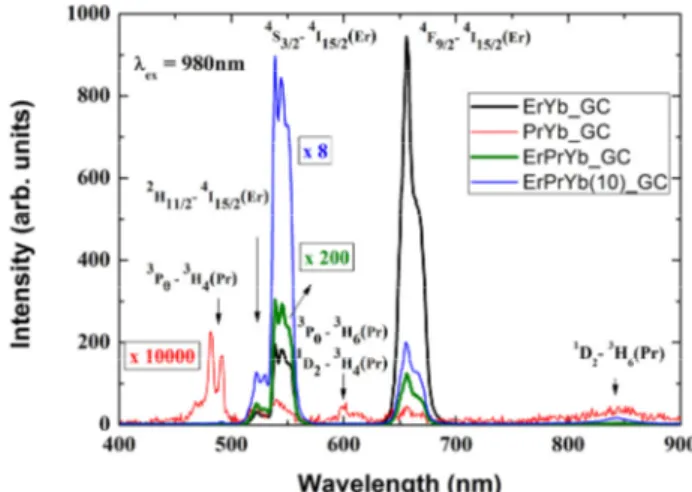
FIG. 4. Up-conversion emission spectra of ErPrYb_GC, ErYb_GC, PrYb_GC, and ErPrYb(10)_GC, upon 980-nm excitation.
FIG. 5. Partial energy-level diagram of ErPrYb_GC and up-conversion mechanisms, under excitation at 980 nm or 980 + 1550 nm.
be attributed to suppressed nonradiative relaxation of rare-earth ions incorporated into CaF2 nanocrystals with very low phonon energy [13]. Besides, the structured spectral shape showing Stark levels in the green and red emissions indicates that Er3+ and Pr3+ ions are mainly located in crystalline domains, rather than glass domains, of the glass ceramics. In addition, the energy transfer among neighboring rare-earth ions inside CaF2 nanocrystals can occur effectively [14], because rare-earth ions reside preferentially inside the nano-crystals rather than in the glass matrix. [15].
The spectrum of Pr3+ ions in glass is known to feature very broad emission in the region of 580-720 nm [16]. Our PrYb_GC also shows a broad red emission from Pr3+ ions, indicating the 3P0→3H6, 3F2 transitions. As we can see in Fig. 3, ErYb_G has negligible red emission, because the 4F9/2 level is populated nonradiatively from the 4S3/2
state, and its emission cross section is smaller than that of
4
S3/2 [17]. However, in ErYb_GC, the green emission of the 2H11/2, 4S3/2→4I15/2 transitions in the region of 520-560 nm and the red emissions of the 4F9/2→4I15/2 transitions show much enhancement, indicating effective energy transfer from the charge-transfer band to the high-energy states of Er3+ ions incorporated in CaF2 nanocrystals. Furthermore, the red emission is stronger than the green. The 4F9/2 emitting state can be also populated by the two cross relaxations (4I11/2→4I15/2 and 4I13/2→4F9/2) and (4F7/2→4F9/2 and 4I11/2→
4
F9/2). Besides, there can be energy transfer from Er3+ to Yb3+ ions via the 4I11/2→4I15/2 (Er3+) and 2F7/2→2F5/2 (Yb3+) transitions. Following the back-transfer process to Er3+ ions by the 4I13/2→4I9/2 (Er3+) and 2F5/2→2F7/2 (Yb3+) transitions can enhance the red emission.
ErPrYb_GC shows strong green (Er3+) and red (Pr3+) emissions. However, the red emission of the Er3+ ions is much reduced. The spectral shapes of the PrYb_GC and ErPrYb_GC are similar, but the difference of two normalized spectra clearly shows only a purely red emission band of Er3+ ions at 660 nm. Very effective energy transfer of the
4
I13/2 (Er3+)→3F3,4 (Pr3+) and 4I11/2 (Er3+)→1G4 (Pr3+) channels reduces the populations of the 4I13/2 and 4I11/2 states of the Er3+ ions. The resultant inactivity of the two cross relaxations that are effective in ErYb_GC produces weak red emission from the 4F9/2 state [18-20].
Besides, the excitation energy at 365 nm is split between the Er3+ and Pr3+ ions, and the 4I11/2→4I15/2 transition energy of the Er3+ is transferred not only to Yb3+ (2F7/2→2F5/2) but also to Pr3+ (3H4→1G4 ). Furthermore, the excited energy of the 2F5/2 state (Yb3+) can be transferred to both Er3+ and Pr3+ ions. Those processes result in the greatly reduced red emission of Er3+ ions in ErPrYb_GC. In contrast, the effective energy transfer from Pr3+ (3P0) to Er3+ (4F7/2) ions [21] contribute to the increasing green emission of Er3+ ions in ErPrYb_GC.
The up-converted emission spectra of ErYb_GC, PrYb_GC, ErPrYb_GC, and ErPrYb(10)_GC excited at 980 nm are shown in Fig. 4. Pr3+ ions showed little absorption at 980 nm, because the oscillator strength of the 1G4 state has its
maximum at 1020 nm. However, Er3+ has a weak absorption band at 980 nm, and Yb3+ has much stronger absorption at this wavelength, because of high oscillator strength [22] and concentration. The up-conversion emission intensity of Er-doped CaF2 was reported to be more than an order of
magnitude weaker than that of Er-Yb codoped CaF2 under
980 nm excitation [23]. In general, efficient energy transfer occurs in Er3+-Yb3+ codoped materials, owing to the large spectra overlap of both absorption and emission between these ions around 980 nm. The up-conversion mechanisms for green and red emissions of Er3+ in Er3+and Yb3+ codoped materials are well known [9], and are described in Fig. 5. Two excited-state absorptions, the ESA-1 (4I13/2→ 4F
9/2) and ESA-2 (4I11/2→4F7/2) transitions, are enabled by
the pump energy at 980 nm, and are responsible for the red and green emissions respectively. Besides, the cross relaxation (CR)-a of (4I11/2→4F7/2) and (4I11/2→4I15/2) populates
the 4F7/2 state, and the CR-b of (4I13/2→4F9/2) and (4I11/2→ 4I
15/2) populates the 4F9/2 state respectively. We expect relatively
4
I13/2 state enables CR-b more than CR-a to increase the population of the 4F9/2 state effectively. This reduced ratio of green:red is also driven by depopulation of the 4F7/2
state and population of the 4F9/2 by the CR-c of (4F7/2→4F9/2) and (4I11/2→4F9/2). However, the contribution of CR-c is relatively small, due to nonradiative relaxation from 4F7/2
to 2H11/2, although the CR-c process in Er-Yb codoped phosphors has been reported [24, 25].
The emission intensity from the PrYb_GC is weak, ~10-5 times as strong as that from the ErYb_GC in Fig. 4. The emission bands at 480, 490, 525, 540, 600, 610, 640, 656, and 850 nm are attributed respectively to the 3P1→3H4, 3P0
→3H4, 3P1→3H5, 3P0→3H5, 1D2→3H4, 3P0→3H6, 3P1→3F2,
3
P0→3F2, and 3P1→1G4 transitions of Pr3+ [26]. The proposed up-conversion mechanism for the emissions of Pr3+ is also displayed in Fig. 5. The energy of excited Yb3+ is transferred to Pr3+ by (2F5/2→2F7/2) (Yb3+) and (3H4→1G4) (Pr3+). The subsequent processes for Pr3+ are ESA-3 (3F3,4→1D2) and ESA-4 (1G4→3P0). However, energy transfer from Yb3+ to Pr3+ ions is less efficient than that from Yb3+ to Er3+ [27] at 980 nm, resulting in weak visible emission from Pr3+.
The ErPrYb_GC shows significant, yet weaker by a factor of over 400, up-conversion emission than the ErYb_GC, under 16-mW excitation at 980 nm. In the ErPrYb_GC, pump energy is mainly shared by Er3+ and Yb3+ ions, and their excitation energies are transferred to each other via Yb3+-Er3+ [9], Er3+-Pr3+ [19, 21], and Yb3+-Pr3+ [27] interactions. Reduced energy transfer from Yb3+ to Er3+ in ErPrYb_GC, due to another transfer channel from Yb3+ to Pr3+ [27], weakens the ESA-1 and ESA-2 processes of Er3+. Besides, as mentioned, for down-conversion in ErPrYb_GC under 365-nm excitation, two efficient energy-transfer channels from Er3+ to Pr3+ ions [18], 4I13/2(Er3+) + 3H4(Pr3+) → 4I15/2(Er3+) + 3F3,4(Pr3+) and 4I11/2 (Er3+) + 3H4(Pr3+) → 4I15/2(Er3+) + 1G4(Pr3+), make the ESA-1 and ESA-2 processes negligible. As we can see from the spectrum of PrYb_GC in Fig. 4, Pr3+ ions are not effective at producing up-conversion emission under 980-nm excitation. Thus, both green and red up-conversion emissions from ErPrYb_GC are dramatically reduced.4
However, the ratio of green:red emission of ErPrYb_GC is 10 times as large as that of ErYb_GC, which differs from the down-conversion seen in Fig. 3. The increased ratio of green:red emission in ErPrYb_GC can be explained mainly by suppression of the CR-b and ESA-1 processes, because of the reduced population of 4I13/2 due to energy transfer from Er3+ (4I13/2) to Pr3+ (3F3,4) [19]. In addition, the population of the 1G4 state (Pr3+) can be increased by energy transfer from Yb3+(2F5/2) and Er3+(4I11/2). The probability of energy transfer from the 4I9/2 or 4F9/2 state of Er3+ is very low, because the large energy differences of those states from 1G4 (Pr3+) require many phonons to be involved. Increased population of the 1G4 state enables the ESA-4 process to populate the 3P0 (Pr3+) state, followed by energy transfer from it to the 4F7/2 (Er3+) state [21], resulting in enhanced green emission. Thus, the ratio of green:red emission can be enhanced.
Figure 4 also shows that the green (540 nm), red (656 nm), and near-infrared (850 nm) emissions of ErPrYb(10)_GC with 10 mol% Yb3+ ions respectively increase by factors of 90, 40, and 150compared to those of ErPrYb_GC with 2 mol% Yb3+ ions. Our up-conversion emission in the green and red regions showed no line broadening, even in 2%Er3+-10%Yb3+ codoped glass ceramics, indicating no additional inhomogeneous broadening caused by a doping concentration five times as high.
The huge enhancement seen just by increasing Yb3+ concentration by a factor of 5 is not easily understood. Moreover, in ErPrYb(10)_GC the ratio of green:red emission is improved more than twofold. Chen et al. [9] reported that the ratio of green:red emission in the ErYb system decreases with Yb3+ concentration, down to almost zero for 10% Yb3+ concentration, under 980-nm excitation in codoped ZrO2 nanocrystals. The ratio of green:red emission for ErYb_GC in Fig. 4 is twice as large as in their report, for the 1%Er-2%Yb system. The Stark-splitting levels of Er3+ and Pr3+ are revealed in the emission bands, indicating that Er3+ and Pr3+ ions are located in the crystalline phase.
The up-conversion channels in ErPrYb(10)_GC are assumed to be about the same as in ErPrYb_GC. The huge enhance-ment of two emissions are ascribed to electrons accumulating in the 2F5/2 state of highly concentrated Yb3+ ions, which are energy providers and intermediates, because they do not have any excited state in the visible except for 2F5/2.
In general, Yb3+ ions have been reported as proper dopants for up-conversion, with concentrations as high as 10-25 mol% in materials such as CaF2 [28], PbF2 [29], and NaLuF4
crystals [30], without concentration quenching under 980-nm excitation. The emission intensity is proportional to In, where I is excitation intensity and n is the number of pump photons required.
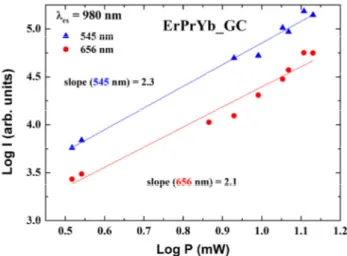
The power dependence of the green and red emissions of ErPrYb_GC is shown in Fig. 6. The slope of 2.1 for the red emission implies that it originates mainly from a two-photon process, in the present power range. The slope of 2.3 for the green emission suggests that it has not only the two-photon channel of 4I15/2→4I11/2 and ESA-2, but also the three-photon channel of 4I15/2→4I11/2, ESA-1, and ESA-2 transitions, including nonradiative relaxations [31]. Energy transfer from the 3P0 (Pr3+) to 4F7/2 (Er3+) states follows another three-photon channel, consisting of the 3H4→1G4, ESA-3, and ESA-4 transitions [21]. Thus the slope of the green emission is less than 3.
Increasing the concentration of Yb3+ ions from 2% to 10% corresponds to a fivefold increase in absorption at 980 nm. The factor of 70 enhancement in up-conversion intensity seen in Fig. 6 may be explained by a more than quadratic dependence on the absorbed power. Moreover, we expect more efficient energy transfer from Yb3+ to Er3+ ions at higher concentrations in CaF2, because the average distance between Yb3+ and Er3+ ions is reduced, and the rate of energy transfer between ions is increased [32].
FIG. 6. Log-log plot of the power dependence of the green (545 nm) and red (656 nm) up-conversion intensities for ErPrYb_GC, upon 980-nm excitation.
FIG. 7. Up-conversion emission spectra of ErPrYb_GC and PrYb_GC upon single excitation at 980 nm, and dual excitation at 980 and 1550 nm.
and ErPrYb _GC did not show any visible up-conversion emission. However, upon double excitation at both 980 nm (16 mW) and 1550 nm (8 mW), the ErPrYb_GC showed enhanced emissions from both Er3+ and Pr3+ ions, compared to those under single excitation at 980 nm, as shown in Fig. 7. The enhancement is assumed to originate from GSA (3H4→3F3,4) and ESA (1D2→3P2) processes of 1550 nm
excitation of Pr3+, as shown in Fig. 6. The relatively large enhancement of 850-nm emission (1D2→3H6) in PrYb_GC
under double excitation may be due to a more populated
1D
2 state, thanks to 3H4→3F3,4 and ESA-3 transitions.
IV. CONCLUSIONS
In down-conversion emission under excitation at 365 nm, two cross relaxations of (4I11/2→4I15/2 and 4I13/2→4F9/2 )
and (4F7/2→4F9/2 and 4I11/2→4F9/2 ) in ErYb_GC decreased the ratio of green:red emission of Er3+ ions. In contrast, the inactivity of two cross relaxations in ErPrYb_GC, due to energy transfer from Er3+ to Pr3+, increased the ratio. In up-conversion emission under 16-mW excitation at 980 nm, the strong up-conversion emission seen in ErYb_GC was reduced by more than a factor of 400 in ErPrYb_GC. This reduction was explained by diminished energy transfer from Yb3+ to Er3+, because of an additional energy-transfer channel from Yb3+ to Pr3+, on top of the direct energy transfer from Er3+ to Pr3+. Energy transfer from Pr3+(3P0) to Er3+(4F7/2) contributes to an increase in the green:red emission ratio. A huge enhancement of up-conversion intensity by increasing Yb3+ concentration fivefold was explained by quadratic dependence on the absorbed power plus enhanced efficiency in energy transfer from Yb3+ to Er3+, due to reduced Er3+-Yb3+ distance. We also compared the up-conversion emission of excitation at 980 nm to those of simultaneous excitations at 980 nm and 1550 nm in triply doped glass ceramics, and detailed up-conversion mechanisms were suggested, based on the observations.
ACKNOWLEDGMENT
This research was supported by the Basic Science Research Program through the National Research Foundation of Korea (NRF), funded by the Ministry of Science, ICT and Future Planning (2013R1A1A2007224).
REFERENCES
1. F. Wang, D. Banerjee, Y. Liu, X. Chen, and X. Liu, “Upconversion nanoparticles in biological labeling, imaging, and therapy,” Analyst 135, 1839-1854 (2010).
2. T. R. Hinklin, S. C. Rand, and R. M. Laine, “Transparent, polycrystalline upconverting nanoceramics: towards 3-D displays,” Adv. Mater. 20, 1-4 (2008).
3. S. Ivanova1 and F. Pellé, “Evaluating upconversion materials developed to improve the efficiency of solar cells: reply to comment,” J. Opt. Soc. Am. B 27, 1356-1358 (2010). 4. Y. Wang and J. Ohwaki, “New transparent vitroceramics
codoped with Er3+ and Yb3+ for efficient frequency upconversion,” Appl. Phys. Lett. 63, 3268-3270 (1993). 5. A. J. Stevenson, H. S.-Brault, P. Gredin, and M.
Mortier, “Fluoride materials for optical applications: single crystals, ceramics, glasses, and glass-ceramics,” J. Fluorine Chem. 132, 1165-1173 (2011).
6. X. Qiao, X. Fan, J. Wang, and M. Wang, “Luminescence behavior of Er3+ ions in glass-ceramics containing CaF2
nanocrystals,” J. Non-Cryst. Solids 351, 357-363 (2005). 7. J. P. Srivastava and R. D. Singh, “Infrared lattice vibrational
spectrum of CaF2,” J. Phys. C: Solid State Phys. 4, L47-49
(1971).
8. X. Zhang, X. Wang, Y. Qiao, and H. Guo, “Synthesis and photoluminescent properties of Gd3O4Br:Er3+ phosphors prepared
by solid-state reaction method,” Opt. Mater. 32, 216-220 (2009).
9. G. Chen, G. Somesfalean, Y. Liu, Z. Zhang, and Q. Sun, F. Wang, “Upconversion mechanism for two-color emission in rare-earth-ion-doped ZrO2 nanocrystals,” Phy. Rev. B 75,
195204 (2007).
10. C. Ming, F. Song, and L. Yan, “Spectroscopic study and green upconversion of Pr3+/Yb3+-codoped NaY(WO4)2 crystal,”
Opt. Commun. 286, 217-220 (2013).
11. Y. Dwivedi, A. Rai, and S. B. Rai, “Intense white upconversion emission in Pr/Er/Yb codoped tellurite glass,” J. Appl. Phys. 104, 043509 (2008)
12. H. P. Klug and L. E. Alexander, X-ray Diffraction Procedures, 2nd ed. (Wiley, New York, USA, 1974). 13. J. Tua, S. A. FitzGeralda, J. A. Campbellb, and A. J.
Sievers, “Glass-like properties observed in low-frequency Raman scattering of mixed fluorite crystals,” J. Non-Cryst. Solids 203, 153-158 (1996).
14. S. A. Song, D. S. Kim, H. M. Jeong, and K. S. Lim, “Upconversion in Nd-Tm-Yb triply doped oxyfluoride glass-ceramics containing CaF2 nanocrystals,” J. Lumin. 152, 75-78 (2014).
15. W. J. Park, C. Liu, and J. Heo, “Direct imaging of the distribution of Nd3+ ions in glasses containing PbS quantum dots,” J. Am. Ceram. Soc. 98, 2074-2077 (2015). 16. M. Rozanski, K. Wisniewski, J. Szatkowski, C. Koepke,
M. Sroda, “Effect of thermal treatment on excited state spectroscopy of oxyfluoride borosilicate glass activated by Pr3+ ions,” Opt. Mater. 31, 548-553 (2009).
17. A. Lupei, V. Lupei, C. Gheorghe, and A. Ikesue, “Excited states dynamics of Er3+ in Sc2O3 ceramic,” J. Lumin. 128,
918-920 (2008).
18. S. H. Park, D. C. Lee, J. Heo, and D. W. Shin, “Energy transfer between Er3+ and Pr3+ in chalcogenide glasses for dual-wavelength fiber-optic amplifiers,” J. Appl. Phys. 91, 9072-9077 (2002).
19. Gongxun Bai, J. D., Lili Tao, Kefeng Li, Lili Hu, Yuen H. Tsang, “Efficient 2.7 micron emission from Er3+/Pr3+ codoped oxyfluorotellurite glass,” J. Non-Cryst. Solids 358, 3403-3406 (2012).
20. D. J. Coleman, P. Golding, and T. A. King, “Spectroscopic and energy-transfer parameters for Er3+-doped and Er3+, Pr3+-codoped GeGaS glasses,” J. Opt. Soc. Am. 19, 1982-1989 (2002).
21. F. Zhang, Z. Bi, A. Huang, and Z. Xiao, “Visible luminescence properties of Er3+/ Pr3+ codoped fluorotellurite glasses,”
Opt. Mater. 41, 112-115 (2015).
22. M. P. Hehlen, N. J. Cockroft, T. R. Gosnell, and A. J. Bruce, “Spectroscopic properties of Er3+ and Yb3+ doped soda-lime silicate and aluminosilicate glasses, Phys. Rev. B 56, 9302- 9318 (1997).
23. Z. Hu, Y. Wang, E. Ma, D. Chen, and F. Bao, “Micro-structures and upconversion luminescence of Er3+ doped and Er3+/Yb3+ co-doped oxyfluoride glass ceramics,” Mater. Chem. Phys. 101, 234-237 (2007).
24. T. Wang, J. Zhou, S. Shi, B. Li, and R. Zong, “Preparation of size-controlled nanocrystalline infrared-to-visible upconverting phosphors Gd2O3: Yb, Er by using a water-in-oil
micro-emulsion system,” J. Electroceram. 21, 765-769 (2008). 25. W. Lu, L. Cheng, H. Zhong, J. Sun, J. Wan, Y. Tian, and
B. Chen, “Dependence of upconversion emission intensity on Yb3+ concentration in Er3+/Yb3+ co-doped flake shaped Y2(MoO4)3 phosphors,” J. Phys. D: Appl. Phys. 43, 085404
(2010).
26. R. S. Yadav, R. K. Verma, A. Bahadur, S. B. Rai, “Structural characterizations and intense green upconversion emission in Yb3+, Pr3+ co-doped Y2O3 nano-phosphor,” Spectrochim. Acta Part A 137, 357-362 (2015).
27. S. Q. Man, H. L. Zhang, Y. L. Liu, J. X. Meng, E. Y. B. Pun, and P. S. Chung, “Energy transfer in Pr3+/Yb3+ codoped tellurite glasses,” Opt. Mater. 30, 334-337 (2007).
28. J. Cai, X. Wei, F. Hu, Z. Cao, L. Zhao, Y. Chen, C. Duan, and M. Yin, “Up-conversion luminescence and optical thermometry properties of transparent glassceramics containing CaF2:Yb/Er nanocrystals,” Ceram. Int. 42, 13990-13995 (2016).
29. S. Haas, A. Hoell, R. Wurth, C. Rüsel, P. Boesecke, and U. Vainio, “Analysis of nanostructure and nanochemistry by ASAXS: Accessing phase composition of oxyfluoride glass ceramics doped with Er3+/Yb3+,” Phys. Rev. B 81, 184207 (2010).
30. Y. C. Suling, Zhao, Zhiqin Liang, Meng Han, Zheng Xu, “Optimized upconversion emission of NaLuF4:Er,Yb nanocrystals codoped with Gd3+ ions and its mechanism,” J. Alloys Comp. 593, 30-33 (2014).
31. Z. Liu, B. Mei, J. Song, and W. Li, “Fabrication and optical characterizations of Yb, Er codoped CaF2 transparent ceramic,” J. Eur. Ceram. Soc. 34, 4389-4394 (2014). 32. L. A. Diaz-Torres, O. Meza, D. Solis, P. Salas, and E. D.
Rosa, “Visible upconversion emission and non-radiative direct Yb3+ to Er3+ energy transfer processes in nanocrystalline ZrO2:Yb3+, Er3+,” Opt. Laser. Eng. 49, 703-708 (2011).