저작자표시-비영리-변경금지 2.0 대한민국 이용자는 아래의 조건을 따르는 경우에 한하여 자유롭게 l 이 저작물을 복제, 배포, 전송, 전시, 공연 및 방송할 수 있습니다. 다음과 같은 조건을 따라야 합니다: l 귀하는, 이 저작물의 재이용이나 배포의 경우, 이 저작물에 적용된 이용허락조건 을 명확하게 나타내어야 합니다. l 저작권자로부터 별도의 허가를 받으면 이러한 조건들은 적용되지 않습니다. 저작권법에 따른 이용자의 권리는 위의 내용에 의하여 영향을 받지 않습니다. 이것은 이용허락규약(Legal Code)을 이해하기 쉽게 요약한 것입니다. Disclaimer 저작자표시. 귀하는 원저작자를 표시하여야 합니다. 비영리. 귀하는 이 저작물을 영리 목적으로 이용할 수 없습니다. 변경금지. 귀하는 이 저작물을 개작, 변형 또는 가공할 수 없습니다.
A Thesis
for the Degree of Master of Science
Effect of Trace Mineral Levels on Growth
Performance, Blood Profile, Pork Quality, and
Economic Analysis in Growing to Finishing
Pigs
미량 광물질 첨가 수준이
육성 - 비육돈의 성장성적, 혈액성상, 돈육품질 및
경제성분석에 미치는 영향
February, 2019
By
Choi, Myeong Jae
School of Agricultural Biotechnology
Effect of Trace Mineral Levels on Growth
Performance, Blood Profile, Pork Quality, and
Economic Analysis in Growing to Finishing
Pigs
미량 광물질 첨가 수준이
육성 - 비육돈의 성장성적, 혈액성상, 돈육품질 및
경제성분석에 미치는 영향
지도교수
김 유 용
이 논문을 농학석사 학위논문으로 제출함
2019 년 2 월
서울대학교 대학원 농생명공학부
최 명 재
최명재의 농학석사 학위논문을 인준함
2019 년 2 월
위 원 장 (인)
부위원장 (인)
위 원 (인)
Summary
In Korea, many swine feed companies are adding excessively large amount of trace mineral, because some experts argue that the requirements stipulated by the NRC (1998, 2012) are extremely scarce compared to actual farm situation. However, there is a lack of scientific evidence to support their insistence. This opinion leads to an increase in feed costs, resulting in increasing cost of production at swine farm. Different levels of trace mineral feeding is based on the finding whether the amount of trace mineral used are appropriate or it can bring about a maximum growth of the growing-finishing pigs. Also, the role of different levels of trace mineral impacts on efficiency of feed utilization has not been assessed. Consequently, the present study was conducted in order to evaluate the effects of trace mineral levels in diet on growth performance, blood profiles, pork quality, and economic analysis in pigs from growing to finishing. A total of 140 growing pigs ([Yorkshire × Landrace] × Duroc), 28.22 ± 4.065 kg in average body weight, were assigned into four treatment groups. Each treatment group provided different dietary mineral and treatment as followed 1) M 1: supplementation of trace mineral met the NRC (2012) requirement, 2) M 3: supplementation of trace mineral met the 3 times of NRC (2012) requirement, 3) M 6: supplementation of trace mineral met the 6 times of NRC (2012) requirement, 4) M 9: supplementation of trace mineral met the 9 times of NRC (2012) requirement. In feeding trials, the different levels of trace mineral feeding in growing-finishing pigs had no significant difference on BW and ADFI compared with NRC (2012) requirement. However, ADG was increased by additional supplementation of trace mineral in finishing period (P=0.03). Gain
to feed ratio was also improved (P<0.01) as trace mineral was increased in experimental diet. The blood concentration of Fe, Cu, Zn and IgG were not affected by trace mineral supplementation and pH, color, water holding capacity, cooking loss, shear force, and proximate analysis of longissimus muscle did not show difference among treatments. In TBARS (2-thiobarbituric acid reactive substances) was increased after cooking (P<0.01) and its value was decreased in proportional to increasing of dietary mineral. Total feed cost tended to increase as dietary mineral was higher. This experiment demonstrated that ADG and G:F ratio were increased by additional supplementation of trace mineral in finishing period. However, considering the whole experimental period, excessive trace mineral feeding did not cause a positive effect on growth performance, blood profile, pork quality and economical profits in growing-finishing pigs. Moreover, excessive trace mineral in swine diet may result in higher mineral content in manure subsequently it cause an environmental pollution eventually. Therefore, dietary supplementation level of trace mineral in swine diet of NRC (2012) recommendation is enough for normal growth of growing pigs and avoiding environmental pollution.
Keywords : Trace mineral, Growing·finishing pig, Growth performance, Pork
Contents
page Summary ··· ⅰ Contents ··· ⅲ List of Tables ··· ⅴ List of Figures ··· ⅶ List of Abbreviations ··· ⅷ Ⅰ. Introduction ··· 1 Ⅱ. Literature Review ··· 3 1. Introduction1.1 Recent situation of swine industry in Korea ··· 3 1.2 Indiscriminate use of trace mineral in domestic swine industry ··· 5
2 Trace mineral
2.1 Mineral requirements for pigs ··· 6 2.2 Metabolic roles of mineral in pigs ··· 8 2.3 Overdosing symptoms of mineral in pigs ··· 12
3. Effect of different levels of trace mineral in growing-finishing pig
3.1 Dietary trace mineral addition ··· 15 3.2 Effect of trace mineral on growth performance ··· 16 3.3. Effect of trace mineral on pork quality ··· 17
Ⅲ. Effect of Different Levels of Trace Mineral on Growth Performance, Blood
Profile, Pork quality and Economic Analysis in Pigs from Growing to Finishing
Abstract ··· 19
Introduction ··· 21
Materials and Methods ··· 23
Results and Discussion ··· 28
Conclusion ··· 36
Ⅳ. Literature Cited ··· 49
List of Tables
Ⅱ. Review of literature
Table 1. Changes in production output by year ··· 4 Table 2. The top 5 items in agriculture production and importance ··· 4 Table 3. The productivity of pig selected countries ··· 5 Table 4. Dietary mineral requirements of growing pigs allowed feed ad libitum ··· 8
Ⅲ. Experiment
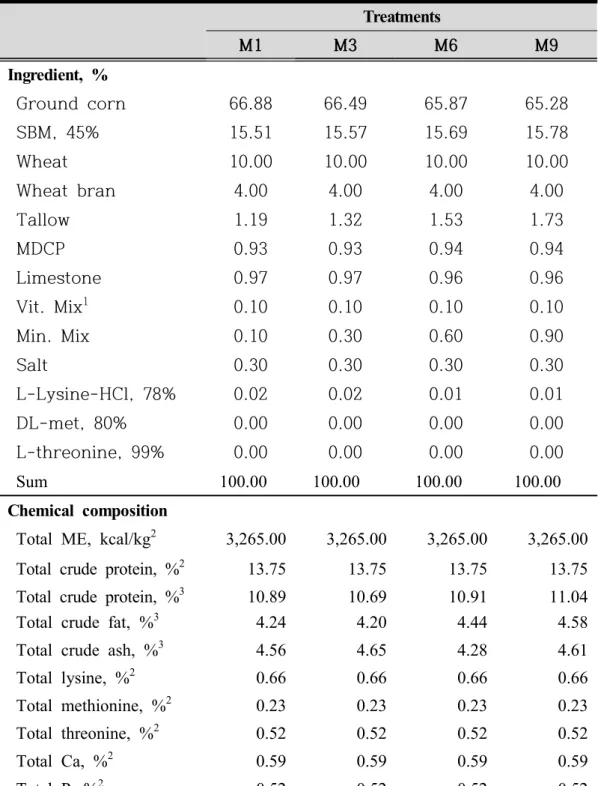
Table 1. Formula and chemical composition of experiment diets in growing phase1 ··· 37 Table 2. Formula and chemical composition of experiment diets in growing
phase2 ··· 38 Table 3. Formula and chemical composition of experiment diets in finishing
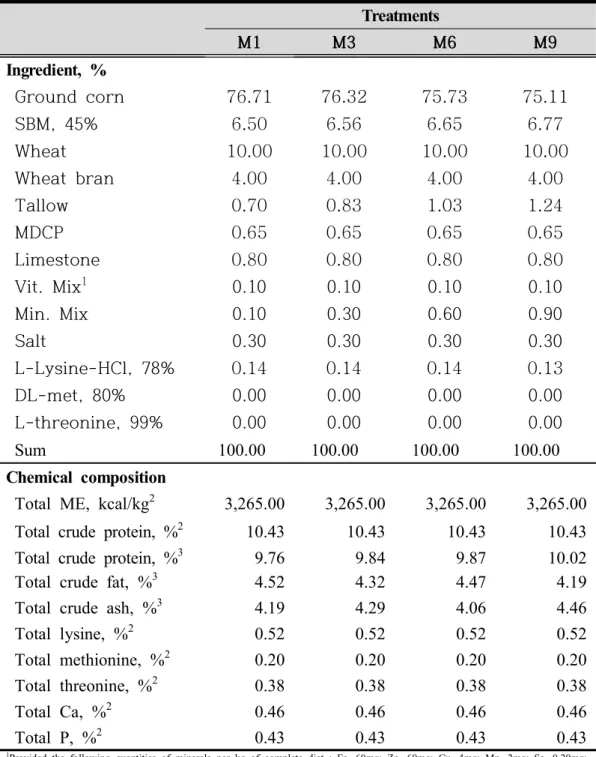
phase1 ··· 39 Table 4. Formula and chemical composition of experiment diets in finishing
phase2 ··· 40 Table 5. Trace mineral content of trace mineral in experiment diets ··· 41 Table 6. Effect of trace mineral levels on growth performance in
growing-finishing pigs ··· 42 Table 7. Effect of trace mineral levels on blood profiles in
growing-finishing pigs ··· 43 Table 8. Effect of trace mineral levels on pork pH after slaughter ··· 44 Table 9. Effect of trace mineral levels on pork color after slaughter ··· 45
Table 10. Effect of trace mineral levels on pork quality of longissimus muscle ··· 46 Table 11. Effect of trace mineral levels on pork 2-thiobarbituric acid
reactive substances ··· 47 Table 12. Effect of trace mineral levels on economic benefits ··· 48
List of Figures
Ⅲ. Experiment
Figure 1. Reactive color of MDA and TBA at different cooking method in trace mineral levels··· 34
List of Abbreviation
AA Amino acid
ADFI Average daily feed intake
ADG Average daily gain
AOAC Association of official analytical chemists
BW Body weight
CP Crude protein
DM Dry matter
EU European union
KREI Korea Rural Economic Institute LSY Litters per Sow per Year
MAFRA Ministry of Agriculture, Food and Rural Affairs
MSY Marketted-pigs per Sow per Year
NRC National research council
PSY Piglet per Sow per Year
RCB Randomized complete block
I. Introduction
Korea swine industry has been struggled not only feed cost but also strength of environmental regulation. Furthermore, more than 85% of feed ingredients have to be imported from foreign countries because of poor agricultural production of feed grain in domestic agriculture. Climate change and unpredictable trade conflict lead to rapidly increased price of feed ingredients. For that reason, feed cost makes up approximately 60 ~ 70% of total cost of swine production (KREI, 2016). Furthermore, when compared domestic swine industry with European swine industry, the domestic swine industry has lower productivity. Therefore, we are more sensitive to these risks.
Currently, domestic feed companies are adding excessive amount of trace mineral in the feed. Such excessive mineral result in a high level of mineral excretion (Bao et al., 2007) and it is one factor of the price increase of the feed. It is important to provide pigs with the expensive micronutrient they need optimally, although the problem is to figure out how much of which minerals pig need. There have been efforts to reduce feed costs by deleting trace mineral in swine diet (Edmonds and Arentson, 2001; Shaw et al., 2002) but, deleting vitamin-trace mineral in finishing pig diets can impair pork stability during storage, even thought it may reduce diet cost and pollution problems from manure (Choi et al., 2001). Therefore, optimum level of mineral in swine diet is unknown.
Consequently, the present study was conducted in order to evaluate the effects of trace mineral levels in diet on growth
performance, blood profiles, pork quality, and economic analysis in pigs from growing to finishing.
II. Literature Review
1. Introduction
1.1 Recent situation of swine industry in Korea
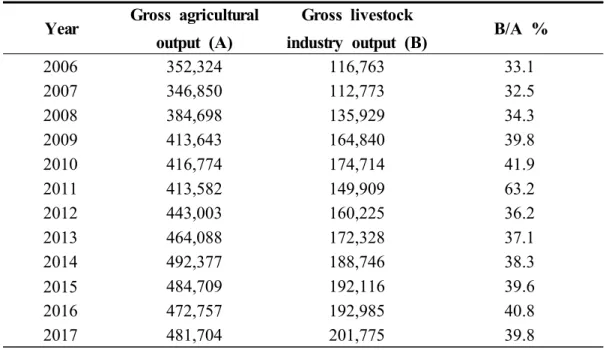
In Korea Livestock industry is one of the most important industry. Almost 40% of the total production is in the livestock area (Table 1). This index means the livestock industry leads agriculture. The livestock industry plays a central role in the agriculture of Korea. In addition, as a single item, the swine industry took the first ranking from 2016 (Table 2).
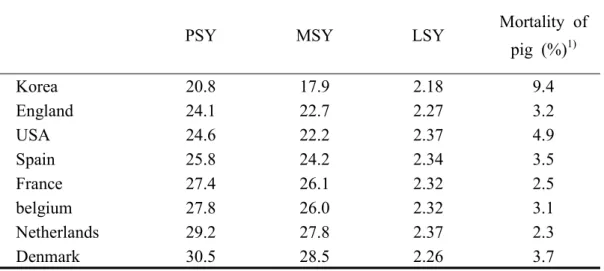
Behind these bright side, domestic swine industry has struggled with an feed price because corn and soybean meal have been widely used as feed ingredients in Korea, and more than 85% of those ingredients have to be imported form foreign countries. these results contribute to increased production costs and feed cost makes up approximately 60 ~ 70% of total cost of swine production. Furthermore, there is a big difference in the productivity of domestic pig farms compared to the average results of the farms in European countries, which have achieved the best farm performance in the world (Table 3). Therefore, in domestic swine industry continuous efforts to improve productivity and reduce unnecessary raw materials to reduce feed cost. With these efforts, the domestic swine industry will become competitive.
Table 1. Changes in production output by year (unit: billions)
Year Gross agricultural
output (A)
Gross livestock
industry output (B) B/A %
2006 352,324 116,763 33.1 2007 346,850 112,773 32.5 2008 384,698 135,929 34.3 2009 413,643 164,840 39.8 2010 416,774 174,714 41.9 2011 413,582 149,909 63.2 2012 443,003 160,225 36.2 2013 464,088 172,328 37.1 2014 492,377 188,746 38.3 2015 484,709 192,116 39.6 2016 472,757 192,985 40.8 2017 481,704 201,775 39.8 (MAFRA, 2018)
Table 2. The top 5 items in agriculture production and importance (unit: billions)
2015 2016 2017
Ranking
1 Rice 76,972 Pig 67,565 Pig 73,380 (14.5%) 2 Pig 69,671 Rice 63,919 Rice 66,196 (13.1%) 3 Hanwoo 44,409 Hanwoo 48,110 Hanwoo 44,388 (8.8%) 4 Milk 22,851 Milk 21,751 Chicken 23,767 (4.7%) 5 Chicken 19,095 Chicken 19,986 Milk 21,280 (4.2%) (MAFRA, 2018)
Table 3. The productivity of pig selected countries
PSY MSY LSY Mortality of pig (%)1) Korea 20.8 17.9 2.18 9.4 England 24.1 22.7 2.27 3.2 USA 24.6 22.2 2.37 4.9 Spain 25.8 24.2 2.34 3.5 France 27.4 26.1 2.32 2.5 belgium 27.8 26.0 2.32 3.1 Netherlands 29.2 27.8 2.37 2.3 Denmark 30.5 28.5 2.26 3.7
(HANDON FARMS, 2016 and INTERPIG Report, 2014)
1) Mortality of pig : Korea is mortality after weaning but selected countries is mortality after 11 weeks.
1.2 Indiscriminate use of trace mineral in domestic swine industry
Trace mineral are essential for the support of normal maintenance and performance. The requirements for vitamins and mineral can vary widely due to environmental conditions such as temperature (Lucas and Calder, 1957), humidity (Coehlo, 1991), management and secerity of stresses on pig (Cunha, 1982), and the physiological status of pig (Mahan and Kim, 1999). So it is difficult to determine the optimum requirements of trace minerals. Some researchers pointed out that the National Research Council (NRC, 1998; 2012) has been established trace mineral requirements for pigs based on experimental condition in which stressors on the pig were minimized (Tian et al., 2001). Cline and Mahan (1972) reported that deficiencies
of vitamins and mineral caused low growth rate when they compared various vitamin and mineral levels in diets for growing-finishing pigs. Based in these studies, the swine feed industry started to add an excessive amount of trace mineral.
2. Trace mineral
2.1 Trace mineral requirements for pigs
Minerals are an inorganic nutrient that is only about 3 ~ 5% in animal body but, it has important functions such as formation of skeleton, maintenance of acid-base balance, maintenance of osmotic pressure, prevention of anemia, improvement of appetite, growth, reproduction, and immune. The rate absorption and utilization of minerals may vary depending on the interaction between inorganic and organic nutrients, animal species, breed, age, supply of minerals, physico-chemical properties of feed, management of specifications, hereditary capacities, and nutritional status of animals. Limited supply can cause deficiency which may compromise the normal functioning of other minerals because of their mutual interactions.
Pigs have a dietary requirement for macro-minerals such as calcium (Ca), phosphorus (P), potassium (K) and sulfur (S), and micro minerals such as chromium (Cr), cobalt (Co), chloride (Cl), iodine (I), iron (Fe), magnesium (Mg), manganese (Mn), selenium (Se), copper (Cu), and zinc (Zn) (NRC, 2012). They have a same importance as they are components of soft tissues and enzymes, and play important
role in the regulation of physiological and biological processes. The most scientifically accurate way to estimate the requirements of minerals for pigs would be to develop mathematical models, which would take into account the pig`s body weight, its accretion rate of lean (protein) tissue, gender, and various environmental factors, as have been done for energy and amino acid requirements. The mineral requirements for rapidly growing pig. genotype may be higher than current recommendations, since most of the work related to mineral requirements was carried out in the 1960s and 1970s and only small changes have been addressed in the last review of NRC (Close, 2002). Several factors that influence the mineral requirement of pigs and that should be taken into account when formulating diet include the bioavailability of the mineral, the content of other minerals in the diet because of possible interactions between minerals, the content of phytic acid and the protein level and source (NRC, 2012). The mineral requirements of NRC are based on dietary concentrations, not daily amounts of minerals, and therefore if animals do not consume the amount of feed predicted, higher percentages are needed to meet the requirements.
Table 4 Dietary mineral requirements of growing pigs allowed feed Ad
Libitum (90% dry matter)
Body weight (kg) 25-50 50-75 75-100 100-135 Mineral elements Sodium (%) 0.10 0.10 0.10 0.10 Chlorine (%) 0.08 0.08 0.08 0.08 Magnesium (%) 0.04 0.04 0.04 0.04 Potassium (%) 0.23 0.19 0.17 0.17 Copper (mg/kg) 4.00 3.50 3.00 3.00 Iodine (mg/kg) 0.14 0.14 0.14 0.14 Iron (mg/kg) 60 50 40 40 Manganese (mg/kg) 2.00 2.00 2.00 2.00 Selenium (mg/kg) 0.20 0.15 0.15 0.15 Zinc (mg/kg) 60 50 50 50 (NRC, 2012)
2.2 Metabolic roles of mineral in pigs
Iron
Iron fuctions in the body as a component of hemoglobin of erythrocyte and myoglobin of muscle for oxygen and carbon dioxide capture and storage transport and in the enzymes catalase, peroxidase, cytochrome oxidase, succinic dehydrogenase, aconitase, and xanthine oxidase in cellular metabolism (Gardner et al., 1995). Hence, Fe is vital to cellular and whole body energetics. The presence of Fe in the body in ferritin and hemosiderin for Fe storage (Quintana et al., 2006),
in transferrin for plasma Fe transport (Gruenheid et al., 1999), in uteroferrin for placental Fe transport (Ducsay et al., 1984), and in transferrin and lactoferrin in milk for Fe transfer to the suckling pig is also Important (Furugouri, 1977).
Copper
Cu is required for the activity of enzymes associated with Fe metabolism, elastin and collagen formation, melanin production, and integrity of the central nervous system (Arredondo et al., 2005). It is required for normal red blood cell formation (hematopoiesis), apparently by allowing normal Fe absorption from the gastrointestinal tract and release of Fe form the reticuloendothelial system and the liver parenchymal cells to the blood plasma (Slot et al., 1986). This function appears to be related to the required oxidation of Fe from the ferrous the ferric state for transfer from tissue to plasma. Ceruloplasmin is the Cu-containing enzyme required for this oxidation. Cu is required for normal bone formation by promoting structural integrity of bone collagen and for normal elastin formation in the aorta and the remainder of the cardiovascular system. this appears to be related to the presence of Cu in lysyl oxidase (LOX), the enzyme required for removal of the ε-amino group of lysine in the normal formal formation of desmosine and isodesmosine, key cross-linkage group in elastin (Miller and Fullmer, 1966). Cu is required for normal myelination of the brain cells and spinal cord as a component of the enzyme cytochrome oxidase which is essential for myelin formation. Numerous enzymes, including lysyl oxidase, cytochrome c oxidase,
and tyrosinase are Cu dependent (Underwood, 1977; Miller et al., 1979).
Zinc
Zinc functions in the body as a constituent of numerous metalloenzymes (Vallee and Falchuk, 1993), including carbonic anhydrase, carboxypeptidases (Lindskog and Malmström, 1962), several dehydrogenases, alkaline phosphatase, ribonuclease, DNA polymerase, and as a component of insulin. Zn activates some enzymes and plays a role in the configuration of DNA and RNA (Chester, 1978). As such, Zn influences protein, amino acid, nucleic acid, carbohydrate, lipid, and vitamin A metabolism. Zinc play a role in diverse functions such as taste and smell acuity, immunocompetence, growth, reproduction, lactation, and behavior (Miller et al., 1979).
Manganese
Mn is essential for formation of chondroitin sulfate, a component of mucopolysaccharides of bone formation. There is a requirement for Mn+2 by glycosyltransferase enzymes in this synthesis (Leach, 1971). In view of the importance of the chondroitin sulfate protein complex in the maintenance of the rigidity of connective tissue, the skeletal deformities that occur with Mn deficiency seem logical (Frost et al., 1959). Mn is necessary for prevention of ataxia and poor equilibrium in newborn pigs. Mn is a component of the metalloenzyme pyruvate carboxylase and activates phosphoenol pyruvate carboxykinase and it plays a role in carbohydrate metabolism (Kaneko et al., 2008).
Selenium
Se is a component of the enzyme glutathione peroxidase (GSH-Px) and in this role is involved in catabolism of peroxides arising from tissue lipid oxidation (Rotruck et al., 1973). Thus it plays a central role in maintaining the integrity of cellular membranes. GSH-Px is present in all tissues, with activity highest in liver and red blood cells; intermediate in heart, kidney, lung, stomach, adrenal, glands, pancreas, and adipose tissue; and lowest in brain, skeletal muscle, eye lens, and testis (Ganther et al., 1976). Se is a constituent of other enzymes in microorganisms, so eventually it may be showm to perform additional functions in animals, Se also is required for normal pancreatic morphology and through this effect on pancreatic lipase production is responsible for normal absorption of lipids and tocopherols from the gastrointestinal tract.
Iodine
I is in the synthesis of the thyroid hormones thyroxine (T4) and
triiodothyronine (T3). Theses thyroid hormones are under the control of
the thyroid stimulating hormone (TSH) of the pituitary, which in turn is released under the action of the thyrotropin releasing factor (TRF) of the hypothalamus. Adequate circulating levels of T4 and T3 inhibit
release of both TRF and TSH (Underwood, 1977). The thyroid hormones function in regulating metabolic rate and, indirectly, cell differentiation and growth, particularly in early life. Thus, there is a vital role of I in reproduction.
2.3 Overdosing symptoms of mineral in pigs
Excessive supply of the minerals can cause a decrease in performance, toxicity and possible environmental pollution.
Iron
Iron is a component of hemoglobin and myoglobin in the body and plays an important role in the transport of oxygen to tissue cells and in the production of ATP as a constituent of cytochrome-based enzymes involved in oxidation-reduction reactions in the mitochondrial electron transport system (Aisen et al., 2001). Iron is an essential trace mineral in the body but, excess in the cell promotes the formation of free radicals, Lipid peroxidation, protein modification, and DNA damage. In addition, it has been reported to be associated with degenerative iron and degenerative neurological diseases such as diabetes, cancer, cardiovascular disease and Parkinson's or Alzheimer's disease (Swanson, 2003; Levenson and Tassabehji, 2004). The pregnancy is more prone to oxidative damage due to the mitochondrial-rich placenta (Casanueva and Viteri, 2003). Iron accumulation from the mother to the placenta through the fetus also increases rapidly at the end of pregnancy. In addition, oxidative stress in the placenta is known to be a pathogenesis of pre-eclampsia. Increased oxidative stress during pregnancy increases the amount of 8-hydroxydeoxyguanosine (8-OH-dG), an oxidant, due to intracellular DNA damage, and the concentration of malondialdehyde (MDA), a lipid peroxide, and the birth weight of the newborn was decreased
(Kim et al., 2005). Serum and placental MDA levels were significantly higher in preeclamptic pregnant women than in normal pregnant women, and superoxide dismutase (SOD), placental glutathione peroxidase (GPx) and glutathione (GSH) levels were significantly decreased (Atamer et al., 2005; Vanderlelie et al., 2005). In addition, excess iron consumes a large amount of reactive oxygen species (ROS) through Fenton reaction or Haber-Weiss reaction. When ROS is damaged in the mitochondrial inner membrane, cytochrome c or apoptosis inducing factor (AIF) is released from the mitochondria, and the caspase enzymes are sequentially activated and cell death progresses (Sorenson, 2004).
Copper
Copper toxicity has been produced by feeding high concentrations (greater than 250 ppm) of copper throughout the nursery and/or growing-finishing periods especially when the diet contains low concentrations of zinc and iron. Extra zinc and iron may help to prevent the effects of excess copper. Signs of toxicity include impaired growth, anemia, jaundice, and eventual death (Flemming and Trevors, 1989; Gaetke and Chow, 2003)
Zinc
Zinc toxicity can result from feeding high concentrations of zinc for an extended period of time. Symptoms include growth depression, inflammation of the gastrointestinal tract, joint, and bone problems and hemorrhages (Brink et al., 1959). A greater proportion of zinc is
absorbed from some forms of zinc than others making toxicity possible when pharmacological concentrations are fed for long periods of time. The form, amount in the diet and amount of dietary copper and iron influence the potential toxicity.
Manganese
Manganese is one of the least toxic of the trace elements to mammals and birds. Inhaled manganese is not metabolized in the liver and moves directly to the brain. Symptoms due to manganese toxicity usually appear slowly over several years and can cause permanent neurological disorders with Parkinsonism-like symptoms such as tremors, gait disturbances, and facial muscle spasms. This syndrome is sometimes preceded by psychiatric symptoms such as irritability, aggressiveness, and even hallucinations (Gavin et al., 1999).
Selenium
Selenium toxicity has been produced by 5 ppm to 8 ppm of selenium in the diet (20 to 30 times the required level). Toxicity is characterized by reduced feed intake, depressed growth, loss of hair, stiffness and pain upon movement, separation of the hooves at the coronary band, erosion of the joints, atrophy of the heart, cirrhosis of the liver, anemia, and impaired embryo development (Panter et al., 1996).
Iodine
administration of iodine at a dose of 10 mg/kg per day. Intoxications with marked and mild clinical manifestations are induced by daily iodine doses of 2.2 mg/kg and 0.4 mg/kg, respectively (Mangkoewidjojo et al., 1980). In adult cows weighing about 600 kg, the daily iodine requirement for synthesis of thyroid hormones is approximately 10 mg (Convey et al., 1978), i.e. 0.016 mg/kg BW. In practice, intoxication results from the prolonged intake of higher iodine doses ranging from 70 to 600 mg per animal and day (Wallace, 1975; Hillman and Curtis, 1980; Olson et al., 1984).
3. Effect of different levels of trace mineral in
growing-finishing pigs
3.1. Dietary trace mineral addition
From the 1990s to the early 2000s, there has been considerable interest in evaluating the effect of vitamin and trace mineral supplement deletions from both swine and poultry diets (Edmonds and Arentson, 2001). There are several researches (Mavromichlis et al., 1999; McGlone, 2000), demonstrating no adverse effect on growth performance and pork quality of pigs when trace mineral was omitted during the last 3 to 6 weeks before marketing. Mavromichalis et al. (1999) reported that removing trace mineral from diets during late finishing period had no effect on rate and efficiency of growth and pork quality in terms of color, marbling, and firmness while Edmonds and Arentson (2001) demonstrated that deleting trace minerals during the finishing period markedly lowered
the nutritional quality of pork. Chea et al. (2000) also demonstrated that additional levels of trace minerals over NRC (1998) requirements improved the growth performance and pork stability in finishing pigs. Deleting trace mineral in finishing pig diets can impair pork stability during storage. For this reason, trace mineral additions in growing-finishing pig`s diet have always been accompanied.
3.2. Effect of trace mineral on growth performance
Effort to find the optimum requirement of trace mineral have been extensively studied (Partridge, 1980). Tian et al. (2001) reported that there was a trend for better overall growth performances when the level of trace minerals were increased, and a reduction in the level of trace minerals in diet to 50% of control reduced growth performance compared with the 200% trace mineral supplemented. Chae et al. (2000) also reported that increasing dietary vitamin and trace mineral in growing pigs had positive effects on average daily gain. Feed conversion ratio was also improved as the vitamin and trace mineral was increased by 150-250% of NRC (1998) requirements. Despite an increase in vitamin and trace mineral levels, there was no effect on feed intake. In contrast, some researcher (Patience and Gillis, 1995, 1996; Mavromichalis et al., 1999) observed no effect on growth performance of pigs when vitamin and trace mineral were omitted during the last 3 to 5 week before market. Thus, there is a lack of scientific research on the
level of trace mineral used in the actual industry.
3.3 Effect of trace mineral on pork quality
As mentioned above, trace mineral and pork quality are related to each other because pork quality had negative effect when the previous research to remove trace mineral. Additional trace mineral supplements over the requirements suggested by NRC (1988 and 1998) improve pork quality (Edmon and Arentson, 1999). Chae et al. (2000) also demonstrated that additional levels of vitamin and mineral over NRC (1998) requirements improved the pork stability in finishing pig. Some studies also reported that the addition of vitamin E and selenium at the high levels could reduce the drip loss and lipid oxidation in pork and improve the meat color and quality (Asphar et al., 1991; Monohan et al., 1994; Buckley et al., 1995; Munoz et al., 1996; Mahan and Kim, 1999). selenium have antioxidant effects in the body and animal products (Halliwell and Gutteridge, 1986; Hsieh and Kinsella, 1989; Mahan and Kim, 1999). In contrast, some researcher (Patience and Gillis, 1995, 1996; McGlone, 2000) observed no effect on pork quality of pigs when vitamin and trace mineral were omitted during the last 3 to 5 week before market. Mavromichalis et al. (1999) reported that removing vitamin and trace mineral from diets during late finishing period had no effect on rate and efficiency of pork quality in term of color, marbling, and firmness, Edmon and Arentson (2001) also demonstrated that deleting vitamin and trace minerals during the
finishing period markedly lowered the nutritional quality of pork. Deleting mineral in finishing pig diets can impair pork stability during storage so, it must be added.
Ⅲ.
Effects of Trace Mineral Levels on
Growth Performance, Blood Profile, Pork
Quality, and Economic Analysis in
Growing to Finishing Pigs
Abstract:
This experiment was conducted to evaluate the effects oftrace mineral levels on growth performance, blood profiles, pork quality, and economic analysis in growing to finishing pigs. A total of 140 growing pigs ([Yorkshire × Landrace] × Duroc), 28.22 ± 4.065 kg in average body weight, were assigned into four treatment groups. Each treatment group provided different dietary mineral and treatment as followed 1) M 1: supplementation of trace mineral met the NRC (2012) requirement, 2) M 3: supplementation of trace mineral met the 3 times of NRC (2012) requirement, 3) M 6: supplementation of trace mineral met the 6 times of NRC (2012) requirement, 4) M 9: supplementation of trace mineral met the 9 times of NRC (2012) requirement. In feeding trials, the different levels of trace mineral feeding in growing-finishing pigs had no significant difference on BW and ADFI compared with NRC (2012) requirement. However, ADG was increased by additional supplementation of trace mineral in finishing period (P=0.03). Gain to feed ratio was also improved (P<0.01) as trace mineral was increased in experimental diet. The blood
concentration of Fe, Cu, Zn and IgG were not affected by trace mineral supplementation and pH, color, water holding capacity, cooking loss, shear force, and proximate analysis of longissimus muscle did not show difference among treatments. In TBARS (2-thiobarbituric acid reactive substances) was increased after cooking (P<0.01) and its value was decreased in proportional to increasing of dietary mineral. Total feed cost tended to increase as dietary mineral was higher. This experiment demonstrated that ADG and G:F ratio were increased by additional supplementation of trace mineral in finishing period. However, considering the whole experimental period, excessive trace mineral feeding did not cause a positive effect on growth performance, blood profile, pork quality and economical profits in growing-finishing pigs. Moreover, excessive trace mineral in swine diet may result in higher mineral content in manure subsequently it cause an environmental pollution eventually. Therefore, dietary supplementation level of trace mineral in swine diet of NRC (2012) recommendation is enough for normal growth of growing pigs and avoiding environmental pollution.
Keywords : Trace mineral, Growing·finishing pig, Growth performance,
Introduction
In Korea, many swine feed companies are adding excessively large amount of trace mineral, because some experts argue that the requirements stipulated by the NRC (1998, 2012) are extremely scarce compared to actual farm situation (Edmon and Arentson, 1999). Also, commercial farm animals are more susceptible to mineral deficiencies because industrial farm animals are exposed to more stressful situations (Islam et al., 2004). However, there is a lack of scientific evidence to support their insistence. This opinion leads to an increase in feed costs, resulting in increasing cost of production at swine farm. And other opinion that the requirements for trace mineral can vary widely due to environmental conditions such as temperature (Lucas and Calder, 1957), humidity (Coehlo, 1991), management, secerity of stresses (Cunha, 1982), and the physiological status (Mahan and Kim, 1999) in pigs. Therefore, it is difficult to determine the optimum requirements of trace minerals. Even the preceding studies have measured only 50% to 250% of the required amount of trace mineral (Jorgensen et al., 1992; Chae et al., 2000; Choi et al., 2001; Tian et al., 2001; Gowanlock et al., 2013; Gowanlock et al., 2015). Therefore, higher supplementation of trace mineral addition experiment should be performed.
Different levels of trace mineral feeding experiments were conducted to determine whether the amount of trace mineral are appropriate or it can lead to maximum growth of the growing-finishing pigs. Also, the role of different levels of trace mineral has not been
assessed. Therefore, the present study was conducted to evaluate the effect of trace mineral levels on growth performance, blood profile, pork quality, and economic analysis in growing-finishing pigs.
Materials and Methods
Animal Use and Care
All experimental procedures involving animals were conducted in accordance with the Animal Experimental Guidelines provided by the Seoul National University Institutional Animal Care and Use Committee (SNUIACUC;SNU-180813-1).
Experimental animals and management
A total of 140 growing pigs ([Yorkshire × Landrace] × Duroc) with 28.22 ± 4.065 kg in average body weight were used for 11 weeks feeding trial at experimental farm of Seoul National University. Pigs were assigned in four treatments considering sex and initial body weight in 5 replicated with 7 pigs per pen in a randomized complete block (RCB). All pigs were housed in an environmentally controlled building with 100% solid concrete floors facility (2.60 × 2.84 m2) during growing to finishing periods. Feed and water were provided ad
libitum during the whole experimental period by a 4 hole stainless
feeder and a nipple installed in each pen.
Experimental design and diet
Dietary treatments were: 1) M 1: supplementation of trace mineral met the NRC (2012) requirement, 2) M 3: supplementation of trace mineral met the 3 times of NRC (2012) requirement, 3) M 6: supplementation of trace mineral met the 6 times of NRC (2012) requirement, 4) M 9: supplementation of trace mineral met the 9 times
of NRC (2012) requirement. All nutrients of experimental diets except amino acid (AA) was met the nutrient requirement of NRC (2012). AA acid was determined to meet NRC 1998. Formula and chemical composition of experimental diet were presented in Tables 1, 2, 3 and 4.
Growth performance
Body weight and feed intake were measured at 0, 3, 6, 9 and 11 weeks to analyze average daily gain (ADG), average daily feed intake (ADFI), and gain to feed ratio (G:F ratio).
Blood sampling and analysis
Blood samples were taken from the jugular vein of four pigs near average body weight in each treatment after 3 hours fasting for measuring serum Fe, Cu, Zn, and IgG when the body weights were recorded. Collected blood samples were centrifuged for 15 min at 3,000 rpm on 4 ℃ (Eppendorf centrifuge 5810R, Germany). The sera were carefully transferred to 1.5 ml plastic tubes (Serum tubes, BD vacutainerⓇ SSTTM Ⅱ advance, UK) and stored at –20 ℃ until analysis. Fe concentration in blood was measured by colorimetry using cobas 8000 (C702, Roche, Germany). Blood Cu and Zn was measured by ICP-MS (Inductively coupled plasma-mass spectrometry) using ICP-MS (ELAN DRCe, PerkinElmer, Germany). To investigate the degree of immunity, the TIA (Turbidimetric immunoassay) metod using modular Analytics (Tina-quant IgG Gen.2, Roche, Germany).
Pork quality
In each treatment, 2 gilts and 2 barrows slaughtered for the pork analysis. Longissimus muscles were used from nearby 10th rib on right side of carcass. Because of chilling procedure, 30 minutes after slaughter was regarded as initial time. The time to measure pH and pork color were in 0, 3, 6, 12 and 24 hour. The pH was determined by pH meter (Model, Themo Orion, Massachusetts, U.S.A) and pork color was determined by CIE color L*, a* and b* value using a CR300 (Minolta Camera Co., Osaka, Japan). Proximate of pork samples analyzed by the method of AOAC (1995). Centrifuge method was used for water holding capacity of pork (Abdullah and Najdawi, 2005). Longissimus muscle samples were grounded and sampled in filter tube, and heated in water bath at 80℃ for 20 min and centrifuged for 10 min at 2,000 rpm and 10℃ (Eppendorf centrifuge 5810R, Germany). Then after that, to calculate the cooking loss, longissimus muscles were packed with polyethylene bag and heated in water bath until core temperature reached 72℃ and weighed before and after cooking. After heated, samples were cored (0.5 inch in diameter) parallel to muscle fiber and the cores were used to measure the shear force using as alter (Warner Bratzler Shear, USA). Cooking loss, shear force, and water holding capacity of pork were analyzed by animal origin food science laboratory, Seoul National University.
2-thiobarbituric acid reactive substances (TBARS)
Lipid oxidation was measured for TABRS value by using a spectrophotometer (X-ma 3100, Human Co. Ltd., Seoul, Korea). Each
sample (5 g) was homogenized with 15 mL of DDW and 7.2% butylated hydroxyl toluene in ethanol at 9,600 rpm for 30 s (T25, Ika Works, Staufen, Germany). After homogenization, 2 mL of the homogenates were transferred to 15 mL falcon tubes and added 4 mL of 20 mM TBA in 15% TCA. The tubes were heated in a laboratory water bath at 90°C for 30 min, cooled, and centrifuged at 2,265 for 15 min (HM-150IV, Hanil Co. Ltd., Incheon, Korea). The samples were measured before and after cooking which was boiled in water bath at 90°C for 8 min. The absorbance of supernatant was measured at 532 nm. The TBARS value was expressed as mg MDA/kg meat sample.
Chemical Analyses
Diets were ground by a Cyclotec 1093 Sample Mill (Foss Tecator, Hillerod, Denmark) and ground diets were analyzed. All analyses were performed in duplicate samples and analyses were repeated if results from duplicate samples varied more than 5% from the mean. Experimental diet was analyzed for contents of dry matter (procedure 930.15; AOAC, 1995), crude ash (procedure 942.05; AOAC, 1995), ether extract (procedure 920.39; AOAC, 1995), N by using the Kjeldahl procedure with Kjeltec (KjeltecTM 2200, Foss Tecator, Sweden).
Economical analysis
As the pigs were reared in the same environmental condition, economical efficiency was calculated using only the feed cost without considering other factors. The total feed cost and feed cost (won) per
body weight gain (kg) were calculated using amount of the total feed intake and feed price. Calculation of estimated feed cost was done as follows;
Estimated feed cost (won) =
The days to market weight (110 kg) was estimated from the body weight at the end of feeding trial at 11 weeks.
Statistical analysis
The experimental data was analyzed as a randomized complete block design using the General Linear Model (GLM) procedure of SAS. For data on growth performance and economic analysis a pen was considered as an experimental unit, while individual pig was used as an unit for data on blood profiles, immune response, pork quality and economic analysis. Linear and quadratic effects for equally spaced treatment were assessed by measurement of orthogonal polynomial contrast. The differences were declared significant at P < 0.01.
Total feed cost from 28 to 95kg BW +
feed cost from 95 to 110kg BW
× (110kg–final BW) weight gain from 95 to 110kg BW
Results and Discussion
Growth performance
The effect of trace mineral levels on growth was presented in Table 6. During early finishing period (7-9 weeks) and whole finishing phase (7-11 weeks) was increased (P=0.03) in ADG with increasing level of trace mineral supplementation. During late finishing period (10-11 weeks) and whole finishing phase (7-11 weeks) also increased (P=0.04, P=0.01, respectively) in G:F ratio with increasing level of trace mineral supplementation. The result of current study was in agreement with previous researches which observed trace mineral improving ADG and G:F ratio of pigs (Chae et al., 2000; Choi et al., 2001; Tian et al., 2001). These results can explain that total amount of trace mineral in the feed ingredients used in the study appear to meet the requirements of pigs, additional minerals are needed due to their low availability in the plant source of feedstuffs (Chae et al., 2000). Instance of minerals, the copper of plant source feed ingredients is only about 50% as available as that in animal source feeds (Baker and Ammerman, 1995), and trace mineral in the finishing period in actual farm feeding trial, there are many stress factors which increase the requirements of these micronutrients. These include temperature of farm, stock density, degree of contamination, transport of pigs, and hygiene in swine farm (Cunha, 1977; Stahley et al., 1997; Moro et al., 1998; Letellier et al., 1999; Hartung, 2003).
significant difference during the whole period (0-11 weeks) and growing period (0-6 week). It means that it absorbs the proper amount in growing-finishing pig body and excretes extra trace mineral to outside of the body (Low, 1980; Buff et al., 2005; Kies et al., 2005).
Consequently, the current study demonstrated ADG and G:F ratio increased with supplementation of trace mineral during the finishing period (7-11 weeks), nevertheless supplementation of trace mineral met the 3 times of NRC (2012) requirement is sufficient. However, considering the whole period (0-11 weeks), excessive trace mineral feeding did not affect on growth performance in growing-finishing pigs.
Blood profiles
The effect of trace mineral levels on serum Fe, Cu, Zn and IgG were shown in Table 7.
During whole experimental period, there was no significant difference in Serum Fe, Cu and Zn. Serum iron concentration is generally low in both iron deficiency (Kolb, 1963; Furugouri, 1972; Halvorsen and Halvorsen, 1973; Mollerberg et al., 1975; Harvey et al., 1982; Weiser and Kociba, 1983; Harvey et al., 1987a) and with inflammation (Kolb, 1963; Feldman et al., 1981b; Smith and Cipriano, 1987; van Miert et al., 1990; Borges et al., 2007). It may also be decreased when demands for erythropoiesis exceed the iron flow from the diet and storage pools, such as might occur with erythropoietin administration (Brugnara et al., 1993; Cowgill et al., 1998; Pak et al., 2006). Serum iron concentration is decreased following glucocorticoid
administration to cattle and goats (Maddux et al., 1988; Weeks et al., 1989a). Supplementation of trace mineral met the NRC (2012) requirement did not show deficiency in growing-finishing pigs because it satisfies serum iron requirements well.
DeGoey et al. (1971) reported that pigs receiving rations with copper had slightly higher serum copper concentrations and considerably higher liver copper levels however, there was no significant difference in this experiment. Zinc concentrations in blood serum and liver also increased when supplemental zinc was fed. Based on gel-filtration studies, Evans and Winter (1975) hypothesized that zinc was transported in rats from the intestine to the liver in portal blood bound to transferrin, hence interfering with Fe transport and Cox and Hale (1962) also reported that pig fed 4,000 ppm Zn from ZnO had less hepatic Fe than those fed 2,000 ppm but in this study Zn did not affect Fe. Excessive trace mineral feeding did not show significant difference on serum copper and zinc in growing-finishing pigs. Likewise, Supplementation of trace mineral met the NRC (2012) requirement did not show deficiency in growing-finishing pigs because it also satisfies serum copper and zinc requirements well.
IgG is generally considered to be the most common type of antibody in blood circulation and plays an important role in controlling bacterial infections in the body (Haye and Karenegay, 1979; Hankins et al., 1994). As a result, there was no significant difference in IgG. It suggested that excessive trace mineral were not digested in growing-finishing pigs and excreted in the feces and urine.
diet did not affect serum Fe, Cu, Zn, and IgG in growing-finishing pigs. Therefore, It is sufficient to supplementation of trace mineral met the NRC (2012) requirement to prevent deficiency.
Pork quality
The effect of trace mineral levels on pork quality of longissimus muscle (LM) was shown in Table 8, 9, 10.
The effect of different levels of trace mineral diet on meat pH of growing-finishing pigs was shown in Table 7. The pH change of pork after slaughter is an important factor in determining the quality of pork, which affects the freshness, water holding capacity, softness, color, and storage of pork (Brewer and McKeith, 1999; Binder et al., 2004). Also Palansky and Nosal (1991) reported that cooking loss is decreased when the pH is increased. The initial pH and the final pH after slaughter are used as criteria for determining the meat quality of pork (Brewer et al., 1999). The initial pH is the predicted value of PSE meat, and the final pH is recognized as the predicted value of DFD (Monin and Sellier, 1985). When the blood supply to the posterior muscle is stopped, the anaerobic glycolysis stored in the muscle increases lactic acid production and decreases the pH of the muscle. These pH reductions were reported to be affected by handling status before and after slaughter, the genetic capabilities of individuals (Warriss et al., 1987), and the rate of Anaerobic glycolysis (Bendall and Swatland, 1988). Rapid pH drop of pork modifies protein structure of muscles to promote juice outflow, juicy outflow of surface causes light to scatter, making pork appear pale, resulting in PSE meat.
Normally, within 45 minutes after slaughter, if the pH is less than 5.6, it judged as PSE and pH is 6.8 or higher, it judged to be DFD (Enfält et al., 1993). Tian et al. (2001) reported that vitamin and trace mineral did not affect the meat pH. The result of current study was in agreement with previous researches which there is a no significant differences in meat pH.
The effect of different levels of trace mineral diet on meat color (CIE value) of growing-finishing pigs was shown in Table 8. Consumer consider meat color as an important parameter for freshness (Pathare et al., 2013). Thus, meat color has the greatest impacts on consumer’s decision tin the market. Choi et al. (2001) reported that trace mineral did not affect the Hunter L*, a*, and b* values of pork and Tian et al. (2001) also found Hunter a* and b* value had no relation with trace mineral supplementation of growing-finishing pigs. The result of current study was in agreement with previous research which there is a no significant differences in meat color.
The effect of different levels of trace mineral diet on pork quality of longissimus muscle (LM) were shown in Table 9. In the present study, there were no differences in proximate analysis of the meat after slaughter among treatments.
The water holding capacity (WHC) of meat products is a very important quality attribute which has an influence on product yield, which in turn has economic implications, but it is also important in terms of eating quality (Cheng et al., 2008). Heat loss is one of the indirect indicators of water holding capacity, which is generally known to have a negative correlation with water holding capacity (Qiao et al.,
2001; Karhu et al., 2011). Shear force is a mechanical measure of the degree of toughness of meat and it is known to be related to water holding capacity (Hamm, 1986).
In conclusion, physiochemical property, we can not found any significant difference in WHC, cooking loss, and shear force.
2-thiobarbituric acid reactive substances (TBARS)
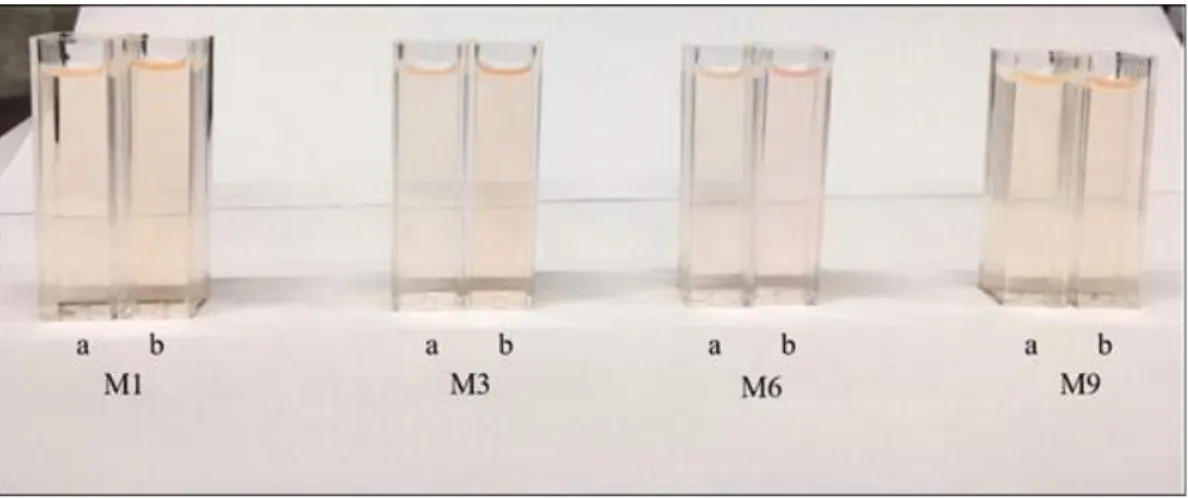
The effect of trace mineral levels on pork 2-thiobarbituric acid reactive substances (TBARS) was shown in Table 11 and Figure 1.
TBARS value was indicator for lipid oxidation in meat and meat products, and this related to meat quality deterioration such as color, flavor, texture, and nutritive value (Jakobsen and Bertelsen, 2000). Malondialdehyde (MDA) which was lipid metabolite in meat was quantified for TBARS assay as combination of 2-thiobarbituric acid (TBA) and MDA (Shaw et al., 2002).
In before cooking, there was no significant difference among treatment. TBARS result of pork meat before cooking was similar to Choi et al. (2001) that pork meat of diet vitamin-trace mineral (consist of vitamin E, Se) feeding trial for 4 weeks was no significant difference after slaughter (0 day of storage time). However, 5 and 10 days of storage time for pork meat of same samples were significantly increased TBARS value. In present study, samples before cooking which was no change for lipid oxidation could be affected with no storage period among the treatment.
After cooking and compared before and after cooking were increased (P<0.01) than before cooking one. And Kwon et al. (2008)
studied for TBARS value, cooking meat, and pork TBARS was increased (P<0.01) after cooking. Therefore, increased value for pork meat after cooking could be affected heat treatment. Therefore, trace mineral diet for pork meat was not affected lipid oxidation right after slaughter, and just affected heating treatment. In after cooking treatment, M9 treatment showed lowest TBARS value and M3 treatment showed the highest TBARS value. This can be explained by the antioxidant effect of selenium in the trace mineral (Asphar et al., 1991; Monohan et al., 1994; Buckley et al., 1995; Munoz et al., 1996; Mahan and Kim, 1999). However, it means that all treatments were not affected by trace mineral supplementation because all treatments did not reach the quality deterioration value (0.6 mg/kg, Guo et al., 2003).
Figure 1. Reactive color of MDA and TBA at different cooking method in trace mineral levels.
M 1: supplementation of trace mineral met the NRC (2012) requirement, M 3: supplementation of trace mineral met the 3 times of NRC (2012) requirement, M 6: supplementation of trace mineral met the 6 times of NRC (2012) requirement, M 9: supplementation of trace mineral met the 9 times of NRC (2012) requirement.
Economic analysis
The effect of trace mineral levels on feed cost per weight gain, total feed cost per pig, estimated total feed cost per pig, and day to market weight (110kg) form initial weigh (28.22kg) days was presented in Table 12.
There was no significant difference in feed cost per weight gain, total feed cost per pig, estimated total feed cost per pig, and day to market weight (110kg) form initial weigh (28.22kg) days. Tian et al. (2001) reported that during the growing period (21 to 53 kg), total feed cost per pig was litter higher in the control than the other treatment group, but the difference was not significant and feed cost per kg weigh gain among treatments did not showed significant difference.
In day to market days decreased numerically when trace mineral added.
In conclusion, the different levels of trace mineral feeding seems to have no positive effect on the economical benefits of to swine producers but, excessive levels of trace mineral showed a numerically increased in production cost.
Conclusion
The different levels of trace mineral feeding by NRC requirement had no significant difference on BW, ADG, ADFI, and G:F ratio among treatment. In TBARS value, after cooking had significant difference among the treatment, however, the value were not affected the meat deterioration.
In conclusion, ADG and G:F ratio were increased by additional supplementation of trace mineral in finishing period. However, considering the whole experimental period, excessive trace mineral feeding did not cause a positive effect in growing-finishing pigs. Moreover, excessive trace mineral in swine diet may result in higher mineral content in manure subsequently it cause an environmental pollution eventually. Therefore, dietary supplementation level of trace mineral in swine diet of NRC (2012) recommendation is enough for normal growth of growing pigs and avoiding environmental pollution.
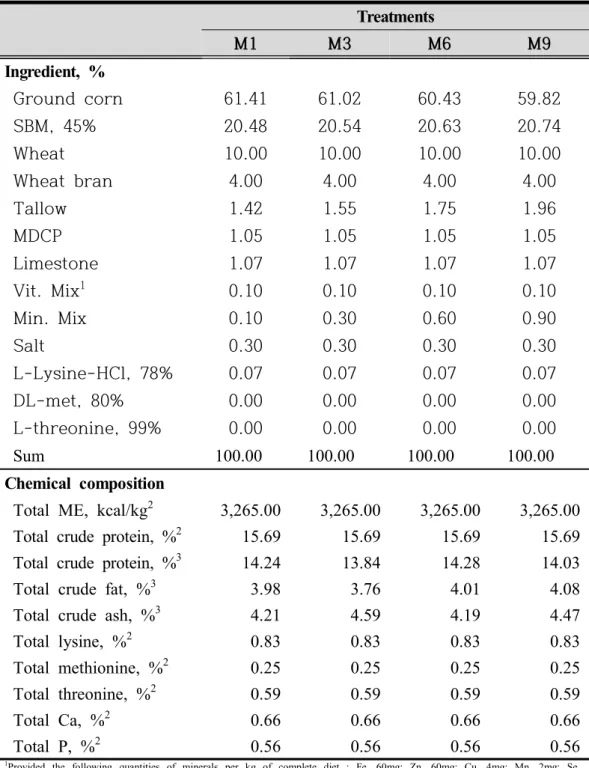
Table 1. Formula and chemical composition of experiment diets in growing phase1 (0-3 week). Treatments M1 M3 M6 M9 Ingredient, % Ground corn 61.41 61.02 60.43 59.82 SBM, 45% 20.48 20.54 20.63 20.74 Wheat 10.00 10.00 10.00 10.00 Wheat bran 4.00 4.00 4.00 4.00 Tallow 1.42 1.55 1.75 1.96 MDCP 1.05 1.05 1.05 1.05 Limestone 1.07 1.07 1.07 1.07 Vit. Mix1 0.10 0.10 0.10 0.10 Min. Mix 0.10 0.30 0.60 0.90 Salt 0.30 0.30 0.30 0.30 L-Lysine-HCl, 78% 0.07 0.07 0.07 0.07 DL-met, 80% 0.00 0.00 0.00 0.00 L-threonine, 99% 0.00 0.00 0.00 0.00 Sum 100.00 100.00 100.00 100.00 Chemical composition
Total ME, kcal/kg2 3,265.00 3,265.00 3,265.00 3,265.00 Total crude protein, %2 15.69 15.69 15.69 15.69 Total crude protein, %3 14.24 13.84 14.28 14.03 Total crude fat, %3 3.98 3.76 4.01 4.08 Total crude ash, %3 4.21 4.59 4.19 4.47 Total lysine, %2 0.83 0.83 0.83 0.83 Total methionine, %2 0.25 0.25 0.25 0.25 Total threonine, %2 0.59 0.59 0.59 0.59 Total Ca, %2 0.66 0.66 0.66 0.66 Total P, %2 0.56 0.56 0.56 0.56
1Provided the following quantities of minerals per kg of complete diet : Fe, 60mg; Zn, 60mg; Cu, 4mg; Mn, 2mg; Se,
0.20mg; I, 0.14mg.
2 Calculated value 3 Analyzed value
Table 2. Formula and chemical composition of experiment diets in growing phase2 (4-6 week). Treatments M1 M3 M6 M9 Ingredient, % Ground corn 66.88 66.49 65.87 65.28 SBM, 45% 15.51 15.57 15.69 15.78 Wheat 10.00 10.00 10.00 10.00 Wheat bran 4.00 4.00 4.00 4.00 Tallow 1.19 1.32 1.53 1.73 MDCP 0.93 0.93 0.94 0.94 Limestone 0.97 0.97 0.96 0.96 Vit. Mix1 0.10 0.10 0.10 0.10 Min. Mix 0.10 0.30 0.60 0.90 Salt 0.30 0.30 0.30 0.30 L-Lysine-HCl, 78% 0.02 0.02 0.01 0.01 DL-met, 80% 0.00 0.00 0.00 0.00 L-threonine, 99% 0.00 0.00 0.00 0.00 Sum 100.00 100.00 100.00 100.00 Chemical composition
Total ME, kcal/kg2 3,265.00 3,265.00 3,265.00 3,265.00 Total crude protein, %2 13.75 13.75 13.75 13.75 Total crude protein, %3 10.89 10.69 10.91 11.04 Total crude fat, %3 4.24 4.20 4.44 4.58 Total crude ash, %3 4.56 4.65 4.28 4.61 Total lysine, %2 0.66 0.66 0.66 0.66 Total methionine, %2 0.23 0.23 0.23 0.23 Total threonine, %2 0.52 0.52 0.52 0.52 Total Ca, %2 0.59 0.59 0.59 0.59 Total P, %2 0.52 0.52 0.52 0.52
1Provided the following quantities of minerals per kg of complete diet : Fe, 60mg; Zn, 60mg; Cu, 4mg; Mn, 2mg; Se, 0.20mg;
I, 0.14mg.
2 Calculated value 3 Analyzed value
Table 3. Formula and chemical composition of experiment diets in finishing phase1 (7-9 week). Treatments M1 M3 M6 M9 Ingredient, % Ground corn 71.88 71.49 70.90 70.30 SBM, 45% 10.89 10.95 11.04 11.14 Wheat 10.00 10.00 10.00 10.00 Wheat bran 4.00 4.00 4.00 4.00 Tallow 0.91 1.04 1.24 1.44 MDCP 0.77 0.77 0.77 0.77 Limestone 0.88 0.88 0.88 0.88 Vit. Mix1 0.10 0.10 0.10 0.10 Min. Mix 0.10 0.30 0.60 0.90 Salt 0.30 0.30 0.30 0.30 L-Lysine-HCl, 78% 0.17 0.17 0.17 0.17 DL-met, 80% 0.00 0.00 0.00 0.00 L-threonine, 99% 0.00 0.00 0.00 0.00 Sum 100.00 100.00 100.00 100.00 Chemical composition
Total ME, kcal/kg2 3,265.00 3,265.00 3,265.00 3,265.00 Total crude protein, %2 12.13 12.13 12.13 12.13 Total crude protein, %3 10.17 10.02 10.34 10.66 Total crude fat, %3 4.40 4.48 4.42 4.39 Total crude ash, %3 4.56 4.60 4.39 4.47 Total lysine, %2 0.66 0.66 0.66 0.66 Total methionine, %2 0.21 0.21 0.21 0.21 Total threonine, %2 0.44 0.44 0.44 0.44 Total Ca, %2 0.52 0.52 0.52 0.52 Total P, %2 0.47 0.47 0.47 0.47
1Provided the following quantities of minerals per kg of complete diet : Fe, 60mg; Zn, 60mg; Cu, 4mg; Mn, 2mg; Se,
0.20mg; I, 0.14mg.
2 Calculated value 3 Analyzed value
Table 4. Formula and chemical composition of experiment diets in finishing phase2 (10-11 week). Treatments M1 M3 M6 M9 Ingredient, % Ground corn 76.71 76.32 75.73 75.11 SBM, 45% 6.50 6.56 6.65 6.77 Wheat 10.00 10.00 10.00 10.00 Wheat bran 4.00 4.00 4.00 4.00 Tallow 0.70 0.83 1.03 1.24 MDCP 0.65 0.65 0.65 0.65 Limestone 0.80 0.80 0.80 0.80 Vit. Mix1 0.10 0.10 0.10 0.10 Min. Mix 0.10 0.30 0.60 0.90 Salt 0.30 0.30 0.30 0.30 L-Lysine-HCl, 78% 0.14 0.14 0.14 0.13 DL-met, 80% 0.00 0.00 0.00 0.00 L-threonine, 99% 0.00 0.00 0.00 0.00 Sum 100.00 100.00 100.00 100.00 Chemical composition
Total ME, kcal/kg2 3,265.00 3,265.00 3,265.00 3,265.00 Total crude protein, %2 10.43 10.43 10.43 10.43 Total crude protein, %3 9.76 9.84 9.87 10.02 Total crude fat, %3 4.52 4.32 4.47 4.19 Total crude ash, %3 4.19 4.29 4.06 4.46 Total lysine, %2 0.52 0.52 0.52 0.52 Total methionine, %2 0.20 0.20 0.20 0.20 Total threonine, %2 0.38 0.38 0.38 0.38 Total Ca, %2 0.46 0.46 0.46 0.46 Total P, %2 0.43 0.43 0.43 0.43
1Provided the following quantities of minerals per kg of complete diet : Fe, 60mg; Zn, 60mg; Cu, 4mg; Mn, 2mg; Se, 0.20mg;
I, 0.14mg.
2 Calculated value 3 Analyzed value
Table 5. Trace mineral content of trace mineral in experiment diets. Treatments M1 M3 M6 M9 Trace mineral, mg/kg Iron, mg/kg %1 60.00 180.00 360.00 540.00 Zinc, mg/kg %1 60.00 180.00 360.00 540.00 Copper, mg/kg %1 4.00 12.00 24.00 36.00 Maganese, mg/kg %1 2.00 6.00 12.00 18.00 Selenium, mg/kg %1 0.20 0.60 1.20 1.80 Iodine, mg/kg %1 0.14 0.42 0.84 1.26 1 Calculated value
Table 6. Effect of trace mineral levels on growth performance in growing-finishing pigs1) Criteria Treatments 2) SEM3) P-value M1 M3 M6 M9 Lin. Quad. Body weight, kg4) Initial 28.20 28.23 28.21 28.22 0.887 0.22 0.39 3 week 40.47 40.26 41.22 40.65 1.157 0.73 0.11 6 week 60.14 58.11 59.66 59.16 1.611 0.17 0.24 9 week 76.97 76.61 78.81 79.01 2.082 0.69 0.14 11 week 93.74 93.72 95.90 95.61 2.220 0.60 0.23 ADG, g 0-3 weeks 584 572 620 592 15.23 0.78 0.09 4-6 weeks 870 769 820 809 26.02 0.07 0.40 0-6 weeks 757 713 742 728 18.21 0.15 0.32 7-9 weeks 801b 865ab 912a 935a 27.78 0.03 0.16 10-11weeks 1,163 1,222 1,220 1,186 22.97 0.35 0.93 7-11 weeks 934b 1,008ab 1,036a 1,035a 22.41 0.03 0.36 0-11 weeks 837 829 857 870 20.82 0.91 0.44 ADFI, kg 0-3 weeks 1.35 1.34 1.33 1.36 0.037 0.77 0.93 4-6 weeks 2.34 2.13 2.26 2.37 0.060 0.17 0.41 0-6 weeks 1.85 1.73 1.80 1.87 0.042 0.18 0.48 7-9 weeks 2.81 2.88 2.99 2.98 0.083 0.39 0.43 10-11weeks 3.38 3.16 3.37 3.47 0.071 0.10 0.11 7-11 weeks 3.10 3.02 3.18 3.23 0.072 0.90 0.13 0-11 weeks 2.62 2.55 2.58 2.67 0.053 0.21 0.30 G:F ratio 0-3 weeks 0.43 0.43 0.45 0.44 0.008 0.17 0.26 4-6 weeks 0.37 0.36 0.36 0.34 0.007 0.60 0.95 0-6 weeks 0.41 0.41 0.41 0.39 0.005 0.78 0.74 7-9 weeks 0.29 0.30 0.31 0.31 0.004 0.60 0.09 10-11weeks 0.34 0.39 0.36 0.34 0.008 0.04 0.21 7-11 weeks 0.30 0.34 0.33 0.32 0.004 0.01 0.52 0-11 weeks 0.32 0.33 0.33 0.33 0.005 0.24 0.67
1) A total 140 cossbred pigs was fed from average initial body 28.22 ± 4.065 kg and the average final body weight was
94.65 kg.
2) M 1: trace mineral requirement of NRC (2012) 1 time, M 3: trace mineral requirement of NRC (2012) 3 times, 3) M 6: trace
mineral requirement of NRC (2012) 6 times, 4) M 9: trace mineral requirement of NRC (2012) 9 times.
3) Standard error of the means.
4) Values are means for five pens of seven pigs per pen.