Feedwater Flow Measurement Using Transit-time Ultrasonic Flow Meter
in Nuclear Power Plant
Jae Hong Ha, Woo Hyeun Jang, Byung Jin Lee, Hee Han Han, Hang Bae Kim
Korea Power Engineering Company, Inc., 150 Deokjin-Dong, Yuseong-Gu, Daejeon, Korea, 305-353
1. Introduction
The flow measurement technology using ultrasonic has been developed rapidly enough to substitute the conventional flow measuring technology such as venturi, flow nozzle and orifice. As one of Projects supported by MOCIE (Ministry of Commerce, Industry and Energy), the feedwater flow measurement technology using ultrasonic flow meter (UFM) is developed to recover the electrical power loss, which is considered to be attributed to the overestimated feedwater flow rate due to a anomaly in the venturi throat, known as the venture fouling [1]. In this paper, some key developments of the project are presented to show the applicability of clamp-on transit-time UFM for feedwater flow measurement in Nuclear Power Plant.
2. Flow Measurement using transient-time UFM
The clamp-on transit-time flowmeter has the advantages of being non-intrusive and easy to install and operate. In this section, the UFM configuration and the velocity correction factor are introduced.
2.1 Hardware configuration
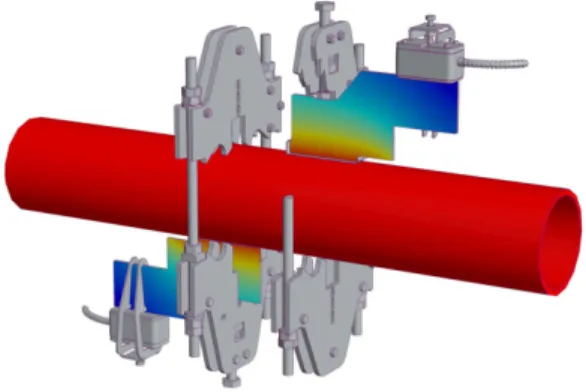
The special mounting fixture “WaveInjector” as illustrated in Figure 1 is used for measuring feedwater that the fluid temperature is over 230 oC. The coupling
plate which plays a role in the waveguide radiates the heat to maintain the transducer temperature low. To reduce the signal attenuation, no internal reflection is produced. The Pb couplant was used because of its flexibility and low melting point.
Figure 1. WaveInjector for high temperature application
2.2 Velocity Correction Factor Calculations
The ultrasonic flow meter calculates the flow with the average velocity along the ultrasonic traveling path, which necessitates a correction factor, called K-factor. The K-factor reflects the actual flow profile and adjusts the UFM measured flow velocity to the area-averaged velocity. The K-factor resulting from actual flow profile is a function of Reynolds and pipe inside roughness, and can be estimated theoretically or empirically. Comparisons between the test results and numerical analysis results are also made for fully developed flows. Activity to determine an appropriate K-factor has been performed for this project [2].
3. Uncertainty Analysis
The possible uncertainty factors presented in ASME MFC-5M [3] are evaluated for application. The critical uncertainty parameters are flow profile, ultrasonic sound transit time in fluid and WaveInjector, propagation time difference, pipe dimensions (pipe outer diameter and thickness), fluid density, viscosity and acoustical calibration factor. Human errors due to installation error and misoperation are included in reproducibility /repeatability error and can be reduced by well-established procedure and training.
4. Performance Verification
The performance verification to identify the meter accuracy was done with the following two different conditions, laboratory test (calibration facilities) and field (power plant).
4.1 Laboratory Tests
Several tests were performed to verify the accuracy and reproducibility/ repeatability at calibration facilities. The test at LBME (Germany) showed that the measurement uncertainty was less than ±0.3%, for which test conditions are 900m3/h in maximum flow
and 300mm in pipe diameter. The purpose of Alden Research Laboratory test is to identify the accuracy and to estimate the K-factor from comparing ultrasonic meter to reference flow. The measurement accuracy was ±0.12% and the test conditions are 4,037m3/h in
maximum flow and 406mm in pipe diameter. The purpose of KRISS (Korea Research Institute Standards and Science) test was to verify the accuracy,
Transactions of the Korean Nuclear Society Autumn Meeting Busan, Korea, October 27-28, 2005
reproducibility and repeatability, and pipe configuration effects. Among the reproducibility/repeatability tests were transducer removing/replacing, mounting fixture removing/replacing, mounting fixture rotation, couplant changes, etc. The reproducibility and repeatability error was less than ±0.23%.
4.2 Field Tests
The ultrasonic flow meter was tested at nuclear power plant to verify the applicability at normal operating condition. . In KSNP (Korean Standard Nuclear Power Plant) and Wolsong nuclear power plant, the straight line in feedwater pipe is over 40 D for upstream after elbow (25D after straightener, two phase double elbow for Wolsong unit 2) and over 12D for downstream before Venturi meter (flow nozzle for Wolsong unit 2), which means that the asymmetric flow profile due to elbow is not likely to be established. However the measurement was performed with two different cross sections assuming the flow profile may not be the perfect symmetric profile. The reproducibility and repeatability error was less than ± 0.27%. Figure 3 shows the test result from KSNP.
-5 495 995 1495 1995 2495 2995 3495 3995 0 20 40 60 80 100 120 Mesurement Number Flow ( m 3/h)
Figure 2. Field test. Sensor’s removing/replacing test. Blue line with circle symbol for plant flow and red solid line for UFM measured flow.
5. Future Applications
Figure 3 illustrates that the roughness has a sensitive effect on the velocity correction factor [2], which means the accurate roughness measurement improve the flow measurement accuracy. However, the pipe roughness measurement is not easy during operation, and the pipe roughness can change with time. Therefore, the actual roughness is indirectly estimated if the roughness in the vicinity of venturi meter can be measured during outage. As the roughness data is accumulated and classified plant by plant with time history to trace the roughness trend, the estimation will be improved.
Figure 3. Velocity Correction Factor vs. Relative Roughness (Empirical)
6. Conclusion
Our results demonstrate that the transit-time ultrasonic flowmeter investigated in our project have a sufficient capability to accurately measure the feedwater flow rate in nuclear power plant. The performance of UFM has been verified by uncertainty analysis and various tests. The measurement results from accurate UFM are expected to contribute to recovering the lost plant power due to the anomaly in the venturi flow measurement.
REFERENCES
[1] Andrei V. Gribok, et al., Regularization of feed water flow rate evaluation for venturi meter fouling problem in nuclear power plants, Nuclear Technology, Vol. 134, Apr. 2001.
[2] Ho Cheol Jang, et al., “13th international Conference on Nuclear Engineering, ICONE13-50222, Beijing, China, May, 2005,
[3] ANSI/ASME MFC-5M, “Measurement of Liquid Flow in Closed Conduits Using Transient-Time Ultrasonic Flowmeters”, American Society of Mechanical Engineers, 1985.
![Figure 3 illustrates that the roughness has a sensitive effect on the velocity correction factor [2], which means the accurate roughness measurement improve the flow measurement accuracy](https://thumb-ap.123doks.com/thumbv2/123dokinfo/4972761.53301/2.892.105.425.551.743/illustrates-roughness-sensitive-velocity-correction-roughness-measurement-measurement.webp)
