저작자표시-비영리-변경금지 2.0 대한민국 이용자는 아래의 조건을 따르는 경우에 한하여 자유롭게 l 이 저작물을 복제, 배포, 전송, 전시, 공연 및 방송할 수 있습니다. 다음과 같은 조건을 따라야 합니다: l 귀하는, 이 저작물의 재이용이나 배포의 경우, 이 저작물에 적용된 이용허락조건 을 명확하게 나타내어야 합니다. l 저작권자로부터 별도의 허가를 받으면 이러한 조건들은 적용되지 않습니다. 저작권법에 따른 이용자의 권리는 위의 내용에 의하여 영향을 받지 않습니다. 이것은 이용허락규약(Legal Code)을 이해하기 쉽게 요약한 것입니다. Disclaimer 저작자표시. 귀하는 원저작자를 표시하여야 합니다. 비영리. 귀하는 이 저작물을 영리 목적으로 이용할 수 없습니다. 변경금지. 귀하는 이 저작물을 개작, 변형 또는 가공할 수 없습니다.
Changes in Serum Histologic Surrogate Markers and
Procollagen III N-Terminal Peptide as Independent
Predictors of HBeAg Loss in Patients with Chronic
Hepatitis B during Entecavir Therapy
by
Jee Hoon Koo
Major in Medicine
Department of Medical Sciences
The Graduate School, Ajou University
Changes in Serum Histologic Surrogate Markers and
Procollagen III N-Terminal Peptide as Independent
Predictors of HBeAg Loss in Patients with Chronic
Hepatitis B during Entecavir Therapy
by
Jee Hoon Koo
A Dissertation Submitted to The Graduate School of
Ajou University in Partial Fulfillment of the Requirements for the Degree
of Master of Medicine
Supervised by
Jae Youn Cheong, M.D.
Major in Medicine
Department of Medical Sciences
The Graduate School, Ajou University
This certifies that the dissertation
Of Jee Hoon Koo is approved.
SUPERVISORY COMMITTEE
Jae Youn Cheong
Sung Won Cho
Jin Hong Kim
The Graduate School, Ajou University
December, 20th, 2011
Acknowledgements
This study was supported by a grant from the Korea Health 21 R&D project, Ministry of Health, Welfare and Family Affairs, Republic of Korea (No. A050021).
i
- ABSTRACT -
Changes in Serum Histologic Surrogate Markers and Procollagen
III N- Terminal Peptide as Independent Predictors of HBeAg Loss
in Patients with Chronic Hepatitis B during Entecavir Therapy
Objectives: The aims of this study were to determine the changes in serum histologic surrogate markers and to identify the serum markers predicting treatment response in patients with chronic hepatitis B (CHB) during entecavir treatment.
Design and Methods: Sixty CHB patients who received entecavir for > 12 months were included. We assessed serum markers of liver fibrosis and/or inflammation at baseline and after 12 months of entecavir treatment
Results: The procollagen III N-terminal peptide (PIIINP) and TIMP1, MMP2, hyaluronic acid and cytokeratin 18 fragment levels were significantly decreased and the haptoglobin level was significantly increased from baseline after entecavir treatment. Multivariate analysis identified PIIINP (P=0.028) and the initial virologic response (P=0.019) as independent predictors of HBeAg loss.
Conclusion: During entecavir treatment, most serum markers of liver fibrosis and inflammation improved in patients with CHB. The PIIINP level at baseline and the initial virologic response are independent predictors of HBeAg loss.
Key words: procollagen III N-terminal peptide, serum marker, treatment response, chronic hepatitis B, entecavir
ii
TABLE OF CONTENTS
ABSTRACT ··· i
TABLE OF CONTENTS ··· ii
LIST OF FIGURES ···iii
LIST OF TABLES ··· iv
. Ⅰ INTRODUCTION ··· 1
. Ⅱ METHODS ··· 3
A. Patients and treatment ··· 3
B. Laboratory measurements ··· 4
C. Liver stiffness measurement by Fibroscan ··· 5
D. Statistical analysis ··· 5
. Ⅲ RESULTS ··· 6
A. Baseline characteristics of patients ··· 6
B. Changes in non-invasive serum markers after 12 months of entecarvir therapy 8
C. Factors associated with ALT normalization, HBeAg loss or seroconversion, and HBV DNA negativity after 12 months of entecarvir treatment ··· 11
. Ⅳ DISCUSSION ··· 16
Ⅴ. CONCLUSION ··· 20
REFERENCES ··· 21
iii
LIST OF FIGURES
Fig. 1. Changes in serum histology surrogate markers after 12 months of
entecavir therapy. ··· 10
Fig. 2. Receiver operating characteristic (ROC) curve of PIIINP as a
iv
LIST OF TABLES
Table 1. Baseline characteristics of patients ··· 7
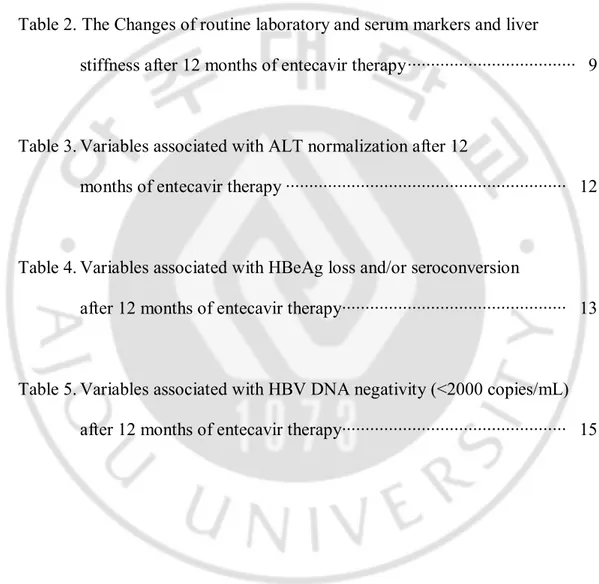
Table 2. The Changes of routine laboratory and serum markers and liver
stiffness after 12 months of entecavir therapy ··· 9
Table 3. Variables associated with ALT normalization after 12
months of entecavir therapy ··· 12
Table 4. Variables associated with HBeAg loss and/or seroconversion
after 12 months of entecavir therapy ··· 13
Table 5. Variables associated with HBV DNA negativity (<2000 copies/mL)
after 12 months of entecavir therapy ··· 15
1
-I. INTRODUCTION
Chronic hepatitis B (CHB) is one of the most common infections worldwide, progressing to cirrhosis, end-stage liver disease, and hepatocellular carcinoma (HCC) (Lai et al, 2003). Patients with significant liver inflammation and fibrosis are at the highest risk of developing cirrhosis or related complications.
Liver biopsy is the gold standard for assessing liver fibrosis and necroinflammatory activity, but the procedure is limited by sampling error, risk of complications, patient discomfort, and inter-observer variation (Poynard et al, 2000; Regev et al, 2002; Bedossa et al, 2003). For these reasons, the usefulness of a liver biopsy as the follow-up method for patients receiving antiviral therapy is quite limited. Non-invasive assessment of liver fibrosis has become an area of clinical interest in the past decade. A number of serum markers have been evaluated for the assessment of hepatic fibrosis. Some of those markers have been widely validated in patients with chronic liver disease (Wai et al, 2003; Wai et al, 2006; Poynard et al, 2007; Guha et al, 2008; Mayo et al, 2008; Nobili et al, 2009; Parkes et al, 2010).
Prolonged antiviral therapy can prevent progression to cirrhosis and HCC in patients with CHB (Chen et al, 2006; Iloeje et al, 2006). Among the oral antiviral agents available for hepatitis B virus (HBV) infection, entecavir has been shown to have one of the best therapeutic and resistance profiles, and the cumulative proportion of patients with undetectable HBV DNA increased to 81% and 93% after 1 and 5 years of therapy, respectively (Tenney et al, 2009). However, entecavir treatment has limited success in achieving durable end-points, especially hepatitis B e antigen (HBeAg) loss and/or
2
-seroconversion to anti-HBe (Gish et al, 2007). Predictors of HBeAg loss in patients treated with entecavir are not known.
It is important to identify patients with chronic viral hepatitis for whom antiviral treatment will be beneficial. Previously, improvement in hepatic histology has been shown to occur with 48 weeks of entecavir treatment in patients with HBeAg-negative chronic hepatitis B (Lai et al, 2006). In clinical practice, it is difficult to evaluate the treatment response by paired liver biopsies. Therefore, the changes in serum fibrosis markers or liver stiffness during antiviral therapy are emerging as alternative parameters to determine the outcome of HBV infections.
At present, little information is available regarding the effect of entecavir treatment on serum fibrosis and/or necroinflammation indices in patients with CHB and the relationship between pre-treatment factors and treatment response in patients with CHB who are treated with entecavir (Gish et al, 2007). The purpose of this study was to evaluate the changes in the serum markers of liver fibrosis and/or inflammation, and to identify the predictive factors for treatment response in patients with CHB during entecavir treatment.
3
-II. METHODS
A. Patients and treatment
This was a retrospective study that included 60 patients who were diagnosed with CHB between October 2006 and June 2009 and received 0.5 mg of oral entecavir (Bristol-Myers Squibb, New York, NY, USA) daily for > 12 months. None of the patients received interferon or other antiviral therapy for at least 6 months before enrollment in the study.
CHB was defined as positive hepatitis B surface antigen (HBsAg), detectable serum HBV DNA, and abnormal serum alanine aminotransferase (ALT levels; normal range, 0-40 IU/L) for > 6 months. Entecarvir was prescribed to patients with serum ALT levels > twice the upper normal limit or moderate-to-severe liver fibrosis (F2-4) on liver biopsy in whom the HBV DNA level was > 20,000 IU/mL with positive HBeAg or > 2,000 IU/mL with negativeHBeAg. Patients with compensated liver cirrhosis and abnormal ALT levels received entecavir if the HBV DNA level was > 2,000 IU/mL. Patients with decompensated liver cirrhosis and detectable HBV DNA received entecavir regardless of the ALT level.
We measured routine biochemical markers of liver function, specific markers of the extracellular matrix (ECM), serologic markers of HBV infection, and HBV DNA levels at baseline and different time points during treatment. All the patients underwent a Fibroscan® (Echosens, Paris, France) at baseline and 12 months of therapy. The data from the first 12 months of therapy were analyzed.
This study was approved by the Institutional Review Board for Human Research at Ajou University Hospital (AJIRB-CRO-08-221). Informed consent to participate in the study was obtained from all of the study subjects.
4
-B. Laboratory measurements
Serum ALT, aspartate aminotransferase (AST), gamma glutamyl transpeptidase (GGT), and albumin levels, and prothrombin times were determined using standard procedures.
Serum HBsAg, HBeAg, anti-HBe, and anti-HBc were determined using an ELISA kit (Abbot Laboratories, Chicago, IL, USA). Serum HBV DNA levels were quantitatively determined using the b-DNA method (Versanttm 3.0, lowest detectable limit = 2,000 copies/mL; Bayer Healthcare, LLC, New York, NY, USA) between October 2006 and December 2008, and the real-time PCR method (COBAS TaqManTM HBV test, lowest detectable limit = 50 copies/mL; Roche Diagnostics, Branchburg, NJ, USA) between January 2009 and June 2009. The serum procollagen-III-N-terminal peptide (PIIINP) level was assessed using a UniQ PIIINP radioimmunoassay (Orion Diagnostica, Espoo, Finland), with a reference range of 2.3-6.4 μg/L. The serum tissue inhibitor of metalloproteinase 1 (TIMP1) and matrix metallopeptidase 2 (MMP2) levels were determined using Quantikine Immunassay kits (R & D Systems, Minneapolis, MN, USA). The serum hyaluronic acid (HA) was measured using a Corgenix HA quantitative test kit (Corgenix, Westminster, CO, USA), with a reference range of 10-800 ng/mL. The apoptosis-associated cytokeratin 18 (CK18) concentration was measured using M30-Apoptosense® ELISA and M65-ELISA kits (PEVIVA AB, Bromma, Sweden). The serum haptoglobin level was assessed using an immunoturbidimetric assay on a Roche COBAS Integra 800 automated chemistry analyzer (Roche Diagnostic), with a reference range of 30 - 200 mg/dL. Each value was measured at baseline and 12 months of entecavir therapy. Loss of HBeAg and HBeAg seroconversion to anti-HBe, normalization of the serum ALT level, and undetectable serum HBV DNA (< 2000 copies/mL) were assessed for the therapeutic efficacy at 12 months of therapy.
5
-C. Liver stiffness measurement by FibroScan
To assess liver stiffness, all patients underwent a Fibroscan at baseline and 12 months of therapy. Fibroscans were performed on the right lobe of the liver with the probe placed in an intercostal space, and the patients lying on their back with the right arm raised behind the head. The obtained elasticity value was determined as the median of 10 acquisitions. The results are expressed in kilopascals (kPa).
D. Statistical analysis
Data are expressed as the mean ± SD for continuous variables and frequency with percentage for categorical variables. The homogeneity of variance was tested by Levene’s test. A paired t-test was used to compare the levels of biochemical markers between at baseline with 12 months of treatment. Univariate analysis was used to identify significant variables affecting the treatment response. Multivariate analysis was performed with significant variables revealed by univariate analysis to identity independent predictive variables for treatment response. A P value < 0.05 was considered statistically significant.
6
-III. RESULTS
A. Baseline characteristics of patients
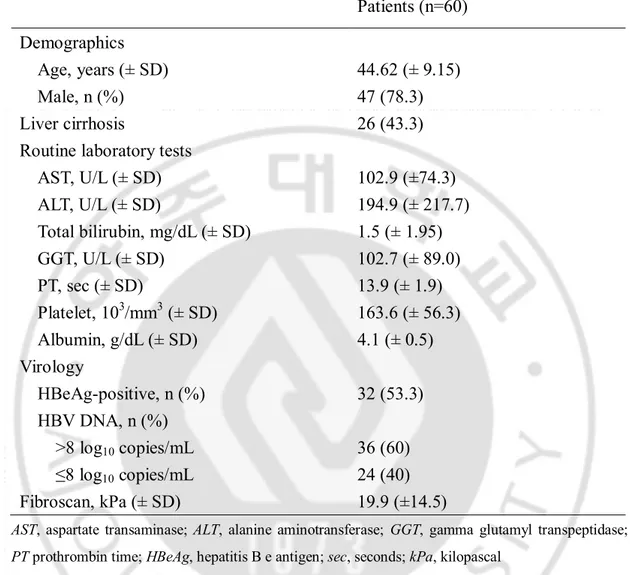
The baseline characteristics of the enrolled patients are summarized in Table 1. Sixty patients were included (47 men and 13 women) between 23 and 62 years of age (mean, 44.62 ± 9.15 years). HBeAg was positive in 32 patients (53.3%) and 26 patients (43.3%) had cirrhosis. The mean ALT level was 194.9 ± 315.2 IU/L and 36 patients (60%) had > 8 log10 copies/mL of HBV DNA. The mean fibroscan score was 19.9 (± 14.5) kPa.
7
-Table 1. Baseline characteristics of patients
Patients (n=60)
Demographics
Age, years (± SD)
44.62 (± 9.15)
Male, n (%)
47 (78.3)
Liver cirrhosis
26 (43.3)
Routine laboratory tests
AST, U/L (± SD)
102.9 (±74.3)
ALT, U/L (± SD)
194.9 (± 217.7)
Total bilirubin, mg/dL (± SD)
1.5 (± 1.95)
GGT, U/L (± SD)
102.7 (± 89.0)
PT, sec (± SD)
13.9 (± 1.9)
Platelet, 10
3/mm
3(± SD)
163.6 (± 56.3)
Albumin, g/dL (± SD)
4.1 (± 0.5)
Virology
HBeAg-positive, n (%)
32 (53.3)
HBV DNA, n (%)
>8 log
10copies/mL
36 (60)
≤8 log
10copies/mL
24 (40)
Fibroscan, kPa (± SD)
19.9 (±14.5)
AST, aspartate transaminase; ALT, alanine aminotransferase; GGT, gamma glutamyl transpeptidase; PT prothrombin time; HBeAg, hepatitis B e antigen; sec, seconds; kPa, kilopascal
8
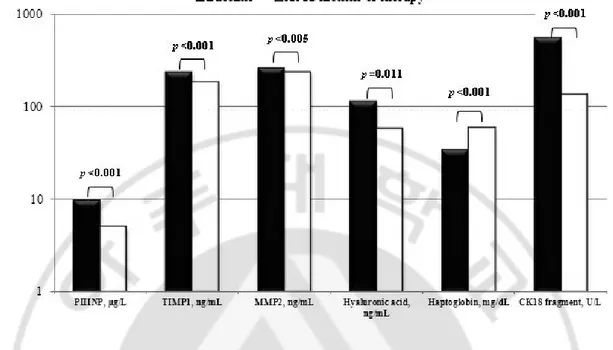
-B. Changes in non-invasive serum markers after 12 months of entecavir therapy The changes of routine laboratory and serum markers and liver stiffness after 12 months of entecavir therapy were shown in Table 2. The AST, ALT, total bilirubin, and GGT levels and PT at 12 months of therapy were decreased from baseline, and the differences were significant for AST, ALT, and GGT levels and PT [102.9 (±74.3) vs. 29.6 (±15.4) U/L, p=0.000; 194.9 (±217.7) vs. 37.0 (±30.5) U/L, p=0.000; 102.7 (±89.0) vs. 47.1 (±30.7) U/L, p=0.000; 13.9 (±1.9) vs. 12.4 (±1.0) seconds, p=0.016, respectively]. The platelet count and albumin level at 12 months of therapy were increased from baseline, and the difference was significant for the albumin level [4.1 (±0.5) vs. 4.5 (±0.5) g/dL, p=0.000]. All of the measured serum histologic surrogate markers at 12 months of therapy were improved from baseline and statistically significant. The PIIINP, TIMP1, MMP2, hyaluronic acid, and CK18 levels at 12 months of therapy were decreased from baseline and the differences were significant [9.8 (±6.6) vs. 5.0 (±1.6) g/L, p=0.000; 237.6 (±73.7) vs. 185.4 (±46.9) ng/mL, p=0.000; 263.0 (±65.7) vs. 237.2 (±56.1) ng/mL, p=0.005; 114.4 (±185.3) vs. 57.9 (±64.5) ng/mL, p=0.011; 557.5 (±495.5) vs. 137.4 (±109.2) U/L, p=0.000, respectively](Figure 1).
The haptoglobin level at 12 months of therapy was increased from baseline and the difference was significant [33.9 (±26.6) vs. 59.2 (±42.0) mg/dL, p=0.000]. The mean liver stiffness measurement value at 12 months of therapy was decreased from baseline and the difference was also significant [19.9 (±14.5) vs. 10.7 (±5.9) kPa, p=0.000]. After treatment, 51 patients (85%) had an initial virologic response (IVR), which was defined as a decrease in the serum HBV < 4 log10 copies/mL after 6 months of entecavir treatment. At 12 months of therapy, 20 of 32 HBeAg-positive patients lost HBeAg, and 7 patients achieved seroconversion to anti- HBe.
9
-Table 2. The Changes of routine laboratory and serum markers and liver stiffness after 12 months of entecavir therapy
Baseline
At 12 months
of therapy
p value
Routine laboratory tests
AST, U/L (SD)
102.9 (±74.3)
29.6 (±15.4)
0.000
ALT, U/L (SD)
194.9 (±217.7) 37.0 (±30.5)
0.000
Total bilirubin, mg/dL (SD)
1.5 (±2.0)
1.0 (±0.6)
0.095
GGT, U/L (SD)
102.7 (±89.0)
47.1 (±30.7)
0.000
PT, sec (SD)
13.9 (±1.9)
12.4 (±1.0)
0.016
Platelet, 10
3/mm
3(SD)
163.6 (±56.3)
168.5 (±56.8)
0.258
Albumin, g/dL (SD)
4.1 (±0.5)
4.47 (±0.5)
0.000
Serum markers
PIIINP, µg/L (SD)
9.8 (±6.6)
5.0 (±1.6)
0.000
TIMP1, ng/mL (SD)
237.6 (±73.7)
185.4 (±46.9)
0.000
MMP2, ng/mL (SD)
263.0 (±65.7)
237.2 (±56.1)
0.005
Hyaluronic acid, ng/mL (SD) 114.4 (±185.3) 57.9 (±64.5)
0.011
CK18 fragment, U/L(SD)
557.5 (±495.5) 137.4 (±109.2)
0.000
Haptoglobin, mg/dL (SD)
33.9 (±26.6)
59.2 (±42.0)
0.000
Mean fibroscan, kPa (SD)
19.9 (±14.5)
10.7 (±5.9)
0.000
PT prothrombin time; PIIINP, procollagen III N-terminal peptide; TIMP1, tissue inhibitor of
metalloproteinase 1; MMP2, matrix metallopeptidase 2; CK18, cytokeratin 18; sec, seconds; kPa, kilopascal
- 10 -
Fig. 1. Changes in serum histology surrogate markers after 12 months of entecavir therapy. Serum markers of liver fibrosis and serum apoptosis marker (cytokeratin 18 fragments) showed statistically significant improvements. PIIINP, procollagen III N-terminal peptide; TIMP1, tissue inhibitor of metalloproteinase 1; MMP2, matrix metallopeptidase 2
- 11 -
C. Factors associated with ALT normalization, HBeAg loss or seroconversion, and HBV DNA negativity after 12 months of entecavir treatment
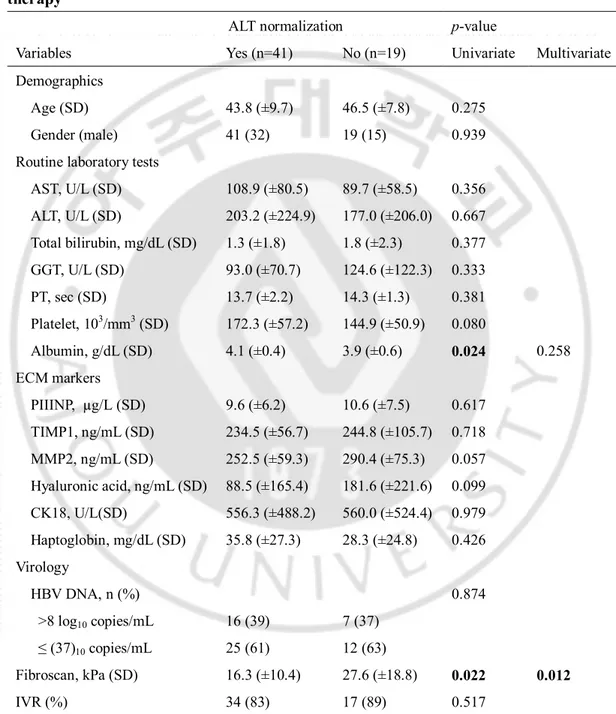
Forty-one patients (68.3%) had ALT normalization by 12 months of entecavir treatment. Based on univariate analysis, the albumin level was significantly higher and the fibroscan value was significantly lower in patients with ALT normalization. Multivariate logistic regression analysis by stepwise forward selection identified fibroscan value (p=0.012) as an independent predictor of ALT normalization (Table 3).
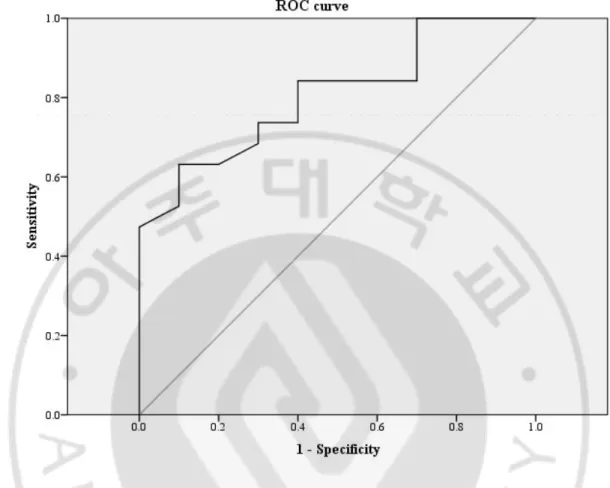
Loss of HBeAg occurred in 20 of 32 patients (62.5%) and HBeAg seroconversion occurred in 7 of 32 patients (21.9%) after 12 months of entecavir therapy. Univariate analysis revealed that the AST, PIIINP, and CK18 levels were significantly different between the patients with and without HBeAg loss. Multivariate logistic regression analysis by stepwise forward selection identified the PIIINP level (p=0.028) and the IVR (p=0.019) as independent predictors of HBeAg loss (Table 4). The baseline serum PIIINP concentration in the HBeAg loss group was higher than the non-HBeAg loss group (p=0.006). Based on receiver operating characteristic curve analysis, the PIIINP level was shown to be a good discrimination factor for HBeAg loss at 12 months of therapy (area under the curve = 0.805). An optimal cut-off value of the PIIINP level was 10.1 μg/L and at this value, the sensitivity and specificity were 63% and 90%, respectively (Figure 2).
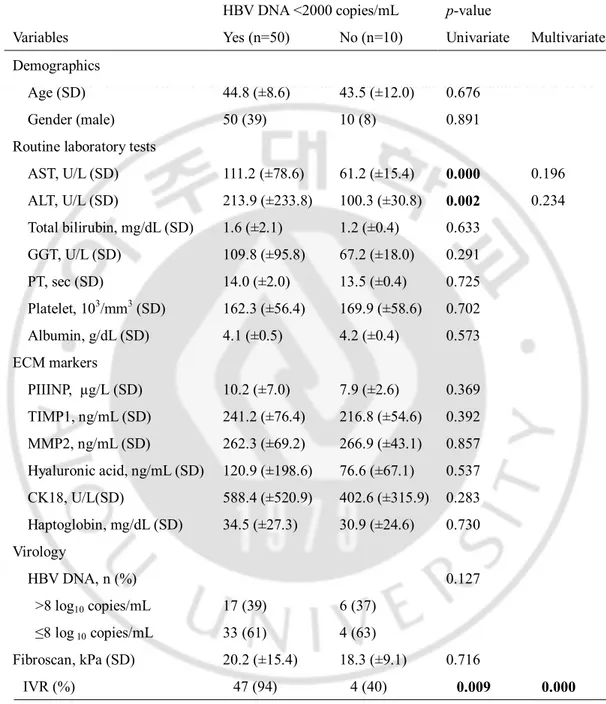
The IVR was achieved in 51 of 60 patients (85%). After 12 months, entecavir reduced HBV DNA to an undetectable level by the bDNA method in 51 of 60 patients (85%) who had an IVR. Univariate analysis revealed that the AST and ALT levels were significantly higher in the HBV DNA-undetectable group after 12 months of ETV therapy. Furthermore, the IVR was more frequent in the HBV DNA-undetectable group after 12 months of ETV therapy. Multivariate analysis identified the IVR (p=0.000) as an independent predictor of
- 12 -
HBV DNA negativity after 12 months of entecavir therapy (Table 5).
Table 3. Variables associated with ALT normalization after 12 months of entecavir therapy
ALT normalization p-value
Variables Yes (n=41) No (n=19) Univariate Multivariate Demographics
Age (SD) 43.8 (±9.7) 46.5 (±7.8) 0.275
Gender (male) 41 (32) 19 (15) 0.939
Routine laboratory tests
AST, U/L (SD) 108.9 (±80.5) 89.7 (±58.5) 0.356 ALT, U/L (SD) 203.2 (±224.9) 177.0 (±206.0) 0.667 Total bilirubin, mg/dL (SD) 1.3 (±1.8) 1.8 (±2.3) 0.377 GGT, U/L (SD) 93.0 (±70.7) 124.6 (±122.3) 0.333 PT, sec (SD) 13.7 (±2.2) 14.3 (±1.3) 0.381 Platelet, 103/mm3 (SD) 172.3 (±57.2) 144.9 (±50.9) 0.080 Albumin, g/dL (SD) 4.1 (±0.4) 3.9 (±0.6) 0.024 0.258 ECM markers PIIINP, µg/L (SD) 9.6 (±6.2) 10.6 (±7.5) 0.617 TIMP1, ng/mL (SD) 234.5 (±56.7) 244.8 (±105.7) 0.718 MMP2, ng/mL (SD) 252.5 (±59.3) 290.4 (±75.3) 0.057 Hyaluronic acid, ng/mL (SD) 88.5 (±165.4) 181.6 (±221.6) 0.099 CK18, U/L(SD) 556.3 (±488.2) 560.0 (±524.4) 0.979 Haptoglobin, mg/dL (SD) 35.8 (±27.3) 28.3 (±24.8) 0.426 Virology HBV DNA, n (%) 0.874 >8 log10 copies/mL 16 (39) 7 (37) ≤ (37)10 copies/mL 25 (61) 12 (63) Fibroscan, kPa (SD) 16.3 (±10.4) 27.6 (±18.8) 0.022 0.012 IVR (%) 34 (83) 17 (89) 0.517
PT prothrombin time; PIIINP, procollagen III N-terminal peptide; TIMP1, tissue inhibitor of
metalloproteinase 1; MMP2, matrix metallopeptidase 2; CK18, cytokeratin 18; sec, seconds; kPa, kilopascal
- 13 -
Table 4. Variables associated with HBeAg loss and/or seroconversion after 12 months of entecavir therapy
HBeAg loss or seroconversion p-value
Variables Yes (n=20) No (n=12) Univariate Multivariate Demographics
Age (SD) 42.6 (±7.9) 43.0 (±9.9) 0.900
Gender (male) 20 (15) 12 (11) 0.209
Routine laboratory tests
AST, U/L (SD) 121.7 (±87.4) 66.7 (±33.3) 0.018 0.426 ALT, U/L (SD) 198.7 (±176.8) 124.5 (±83.2) 0.184 Total bilirubin, mg/dL (SD) 1.4 (±1.1) 1.1 (±0.3) 0.396 GGT, U/L (SD) 96.0 (±86.9) 82.7 (±25.5) 0.701 PT, sec (SD) 14.5 (±1.7) 13.1 (±0.2) 0.260 Platelet, 103/mm3 (SD) 153.7 (±52.3) 190.4 (±60.8) 0.080 Albumin, g/dL (SD) 3.9 (±0.6) 4.2 (±0.4) 0.062 ECM markers PIIINP, µg/L (SD) 11.5 (±4.4) 6.9 (±2.8) 0.006 0.028 TIMP1, ng/mL (SD) 247.3 (±64.9) 202.3 (±38.9) 0.056 MMP2, ng/mL (SD) 269.2 (±80.6) 260.5 (±49.8) 0.761 Hyaluronic acid, ng/mL (SD) 145.6 (±221.5) 67.2 (±66.8) 0.312 CK18, U/L(SD) 760.5 (±582.6) 310.9 (±182.6) 0.004 0.772 Haptoglobin, mg/dL (SD) 25.5 (±21.0) 29.9 (±18.6) 0.626 Virology HBV DNA, n (%) 0.660 > 8 log10 copies/mL 10 (50) 7(58.3) ≤ 8log10 copies/mL 10 (50) 5(41.7) Fibroscan, kPa (SD) 19.8 (±12.5) 17.5 (±9.3) 0.572 IVR (%) 18 (90) 6 (50) 0.028 0.019
PT, prothrombin time; PIIINP, procollagen III N-terminal peptide; TIMP1, tissue inhibitor of
metalloproteinase 1; MMP2, matrix metallopeptidase 2; CK18, cytokeratin 18; sec, seconds; kPa, kilopascal
- 14 -
Fig. 2 Receiver operating characteristic (ROC) curve of PIIINP as a predictor of HBeAg loss at 12 months of entecavir therapy. ROC curve analysis revealed PIIINP to be a good discrimination factor for HBeAg loss at 12 months of therapy (area under the curve = 0.805). An optimal cut-off value of PIIINP was 10.1 ng/ml.
- 15 -
Table 5. Variables associated with HBV DNA negativity (<2000 copies/mL) after 12 months of entecavir therapy
HBV DNA <2000 copies/mL p-value
Variables Yes (n=50) No (n=10) Univariate Multivariate Demographics
Age (SD) 44.8 (±8.6) 43.5 (±12.0) 0.676
Gender (male) 50 (39) 10 (8) 0.891
Routine laboratory tests
AST, U/L (SD) 111.2 (±78.6) 61.2 (±15.4) 0.000 0.196 ALT, U/L (SD) 213.9 (±233.8) 100.3 (±30.8) 0.002 0.234 Total bilirubin, mg/dL (SD) 1.6 (±2.1) 1.2 (±0.4) 0.633 GGT, U/L (SD) 109.8 (±95.8) 67.2 (±18.0) 0.291 PT, sec (SD) 14.0 (±2.0) 13.5 (±0.4) 0.725 Platelet, 103/mm3 (SD) 162.3 (±56.4) 169.9 (±58.6) 0.702 Albumin, g/dL (SD) 4.1 (±0.5) 4.2 (±0.4) 0.573 ECM markers PIIINP, µg/L (SD) 10.2 (±7.0) 7.9 (±2.6) 0.369 TIMP1, ng/mL (SD) 241.2 (±76.4) 216.8 (±54.6) 0.392 MMP2, ng/mL (SD) 262.3 (±69.2) 266.9 (±43.1) 0.857 Hyaluronic acid, ng/mL (SD) 120.9 (±198.6) 76.6 (±67.1) 0.537 CK18, U/L(SD) 588.4 (±520.9) 402.6 (±315.9) 0.283 Haptoglobin, mg/dL (SD) 34.5 (±27.3) 30.9 (±24.6) 0.730 Virology HBV DNA, n (%) 0.127 >8 log10 copies/mL 17 (39) 6 (37) ≤8 log 10 copies/mL 33 (61) 4 (63) Fibroscan, kPa (SD) 20.2 (±15.4) 18.3 (±9.1) 0.716 IVR (%) 47 (94) 4 (40) 0.009 0.000
PT prothrombin time; PIIINP, procollagen III N-terminal peptide; TIMP1, tissue inhibitor of
metalloproteinase 1; MMP2, matrix metallopeptidase 2; CK18, cytokeratin 18; sec, seconds; kPa, kilopascal
- 16 -
IV. DISCUSSION
An accurate estimation of the extent of disease progression is important in the management of CHB, and this estimation needs to be interpreted serially in the clinical setting. However, apart from clinical research settings, the on-treatment assessment of fibrosis using serial liver biopsies is not practical. The Fibrotest-Actitest (FT-AT) has been used as a surrogate marker of the impact of treatment on fibrosis and histologic activity. A previous report confirmed that in a large number of patients with paired biopsies FT-AT was accurate for the diagnosis and follow-up of fibrosis stages and necro-inflammatory grades in patients with CHB who were or were not treated CHB (Myers et al, 2003; Poynard et al, 2005; Poynard et al, 2007; Poynard et al, 2009). The current study investigated the effect of entecavir treatment for CHB infection on biomarkers of hepatic fibrosis and/or inflammation. The results confirms the significant impact of entecavir treatment on values of serum markers as previously observed in other studies with paired samples (Poynard et al, 2005; Poynard et al, 2009). Most serum markers evaluated in this study are related to liver fibrosis and inflammation. Thus, possible mechanisms of changes in these markers during entecavir treatment can be either improvement of liver fibrosis or liver inflammation or both.
Entecavir is one of the most potent agents among the currently available anti-HBV drugs. A pivotal phase III randomized lamivudine controlled trial showed that 1 year of entecavir therapy was superior to lamivudine therapy in reducing HBV-DNA (Chang et al, 2006). The HBeAg seroconversion rate was 21% (Chang et al, 2006). In the context of HBeAg serologic responses, 96 weeks of entecavir therapy was comparable to lamivudine therapy (Gish et al, 2007). Extending entecavir therapy to 96 weeks for partial responders at
- 17 -
week 48 resulted in an increase in the rate of HBV DNA negativity to 74%, ALT normalization increased to 79%, and a cumulative HBeAg seroconversion rate of 31% (Gish et al, 2007).
HBeAg seroconversion is considered to be a more reliable marker for durable disease remission than simple loss of HBeAg; however, this is based on minimal evidence and most therapeutic trials have used loss of HBeAg as a therapeutic endpoint. Therefore, HBeAg losses in conjunction with undetectable HBV DNA are reasonable treatment endpoints to measure the efficacy of antiviral treatment, and seroconversion to anti-HBe may not provide further assurance that a virologic response will be sustained (Lok et al, 2001).
The discrimination of clinical variables, which may be associated with treatment response, is of practical importance in clinical settings. Our results have shown that a higher pre-treatment PIIINP level is associated with HBeAg loss during 1 year of entecavir treatment, and a serum baseline concentration >10.1 μg/L may indicate a successful HBeAg response to entecavir treatment in patients with CHB. Conventionally, the PIIINP level is thought to be a useful marker for liver fibrosis in view of the biological function of PIIINP. Given that the PIIINP level is correlated with aminotransferase levels in patients with chronic hepatitis (Trinchet et al, 1991), however, the correlation between the PIIINP and aminotransferase levels may also reflect that PIIINP is a marker of the inflammatory response driven by HBV replication. Thus, the association between baseline PIIINP levels and HBeAg loss may be explained in part by the role of PIIINP in immune response to HBV, although the actual underlying mechanisms are unclear.
An analysis of a phase III trial of telbivudine versus lamivudine showed that clinical efficacy outcomes after 52 weeks of treatment were proportional to HBV DNA levels after
- 18 -
24 weeks of treatment (Lai et al, 2007). HBV DNA levels in serum have been recommended as a means for assessing the efficacy of antiviral therapy, particularly oral nucleoside analogues (Trinchet et al, 1991). In our study, a HBV DNA level < 2,000 copies/mL at 24 weeks of entecavir treatment was also an independent factor predicting HBeAg loss after 1 year of entecavir treatment. The present study extends the findings by Cooksley et al. (Cooksley et al, 2008), who demonstrated that HBeAg loss during antiviral therapy is associated with a profound reduction in the HBV DNA level.
It is recognized that high ALT levels are associated with an increased rate of HBeAg seroconversion, both during the natural history of the disease and with antiviral treatment (Wai et al, 2006). An association between pre-treatment ALT levels and response to entecavir was not apparent in the current study, likely because the number of subjects was too small.
A recent report showed that the liver stiffness values may predict a progressively better clinical outcome for patients with successful virologic and biochemical responses in patients with chronic hepatitis C (Ogawa et al, 2009). In another report, there was a significant decline in the liver stiffness value during entecavir therapy in patients with CHB (Enomoto et al, 2010). Our study demonstrated that a significant improvement in the levels of serum non-invasive markers on antiviral treatment was accompanied by a reduction of the liver stiffness value. Thus, we suggest that the liver stiffness measurement can be used as a follow-up method for patients with CHB receiving antiviral therapy. However, it should be kept in mind that the decline in liver stiffness may be due to the decline in inflammatory activity rather than a true improvement in fibrosis. A large-scale study showing the usefulness of liver stiffness measurement in patients receiving long-term antiviral therapy is
- 19 -
needed.
Several limitations of this study should be discussed. Because the period of follow-up was short and fibrosis was evaluated only by serum marker and liver stiffness measurements, it is unclear whether or not the improvement in serum markers represents a decrease in hepatic fibrosis or necro-inflammation. A study comparing the results of pre- and post-treatment liver biopsy and serum non-invasive markers is necessary. Another limitation of our study was the limited number of patients with HBeAg-positive CHB. More patients are needed to assess the ability of predicting HBeAg loss/seroconversion in patients with HBeAg-positive CHB.
- 20 -
V. CONCLUSION
1 year of entecavir treatment is associated with an improvement in serum histologic surrogate markers and the serum PIIINP level may be a useful adjunct to serum HBV DNA assays to predict the HBeAg response to entecavir therapy in patients with CHB. The correlation between non-invasive serum markers and liver fibrosis after treatment needs to be assessed by comparison with liver biopsies.
- 21 -
REFERENCES
1. Bedossa P, Dargere D, Paradis V. Sampling variability of liver fibrosis in chronic hepatitis c. Hepatology. 38:1449-1457, 2003
2. Chang TT, Gish RG, de Man R, Gadano A, Sollano J, Chao YC. A comparison of entecavir and lamivudine for hbeag-positive chronic hepatitis b. N Engl J Med. 354:1001-1010, 2006
3. Chen CJ, Yang HI, Su J, Jen CL, You SL, Lu SN, et al. Risk of hepatocellular carcinoma across a biological gradient of serum hepatitis b virus DNA level. JAMA. 295:65-73, 2006
4. Cooksley H, Chokshi S, Maayan Y, Wedemeyer H, Andreone P, Gilson R. Hepatitis b virus e antigen loss during adefovir dipivoxil therapy is associated with enhanced virus-specific cd4+ t-cell reactivity. Antimicrob Agents Chemother. 52:312-320, 2008 5. Enomoto M, Mori M, Ogawa T, Fujii H, Kobayashi S, Iwai S, et al. Usefulness of
transient elastography for assessment of liver fibrosis in chronic hepatitis b: Regression of liver stiffness during entecavir therapy. Heparol Res. 40:853-861, 2010 6. Gish RG, Lok AS, Chang TT, de Man RA, Gadano A, Sollano J. Entecavir therapy for
up to 96 weeks in patients with hbeag-positive chronic hepatitis b. Gastroenterology. 133:1437-1444, 2007
7. Guha IN, Parkes J, Roderick P, Chattopadhyay D, Cross R, Harris S. Noninvasive markers of fibrosis in nonalcoholic fatty liver disease: Validating the european liver fibrosis panel and exploring simple markers. Hepatology. 47:455-460, 2008
8. Iloeje UH, Yang HI, Su J, Jen CL, You SL, Chen CJ. Predicting cirrhosis risk based on the level of circulating hepatitis b viral load. Gastroenterology. 130:678-686, 2006
- 22 -
9. Keeffe EB, Dieterich DT, Han SH, Jacobson IM, Martin P, Schiff ER. A treatment algorithm for the management of chronic hepatitis b virus infection in the united states: An update. Clin Gastroenterol Hepatol. 4:936-962, 2006
10. Lai CL, Gane E, Liaw YF, Hsu CW, Thongsawat S, Wang Y. Telbivudine versus lamivudine in patients with chronic hepatitis b. N Engl J Med. 357:2576-2588, 2007 11. Lai CL, Ratziu V, Yuen MF, Poynard T. Viral hepatitis b. Lancet. 362:2089-2094,
2003
12. Lai CL, Shouval D, Lok AS, Chang TT, Cheinquer H, Goodman Z. Entecavir versus lamivudine for patients with hbeag-negative chronic hepatitis b. N Engl J Med. 354:1011-1020, 2006
13. Lok AS, Heathcote EJ, Hoofnagle JH. Management of hepatitis b: 2000--summary of a workshop. Gastroenterology. 120:1828-1853, 2001
14. Mayo MJ, Parkes J, Adams-Huet B, Combes B, Mills AS, Markin RS. Prediction of clinical outcomes in primary biliary cirrhosis by serum enhanced liver fibrosis assay. Hepatology. 48:1549-1557, 2008
15. Myers RP, Tainturier MH, Ratziu V, Piton A, Thibault V, Imbert-Bismut F. Prediction of liver histological lesions with biochemical markers in patients with chronic hepatitis b. J Hepatol. 39:222-230, 2003
16. Nobili V, Parkes J, Bottazzo G, Marcellini M, Cross R, Newman D. Performance of elf serum markers in predicting fibrosis stage in pediatric non-alcoholic fatty liver disease. Gastroenterology. 136:160-167, 2009
17. Ogawa E, Furusyo N, Toyoda K, Takeoka H, Maeda S, Hayashi J. The longitudinal quantitative assessment by transient elastography of chronic hepatitis c patients treated with pegylated interferon alpha-2b and ribavirin. Antiviral Res. 83:127-134, 2009 18. Parkes J, Roderick P, Harris S, Day C, Mutimer D, Collier J. Enhanced liver fibrosis
- 23 -
test can predict clinical outcomes in patients with chronic liver disease. Gut. 59:1245-1251, 2010
19. Perrillo RP, Lai CL, Liaw YF, Dienstag JL, Schiff ER, Schalm SW. Predictors of HBeAg loss after lamivudine treatment for chronic hepatitis b. Hepatology. 36:186-194, 2002
20. Poynard T, Morra R, Halfon P, Castera L, Ratziu V, Imbert-Bismut F. Meta-analyses of fibrotest diagnostic value in chronic liver disease. BMC Gastroenterol. 7:40, 2007; 21. Poynard T, Ngo Y, Marcellin P, Hadziyannis S, Ratziu V, Benhamou Y. Impact of
adefovir dipivoxil on liver fibrosis and activity assessed with biochemical markers (fibrotestactitest) in patients infected by hepatitis b virus. J Viral Hepat. 16:203-213, 2009
22. Poynard T, Ratziu V, Bedossa P. Appropriateness of liver biopsy. Can J Gastroenterol. 14:543-548, 2000
23. Poynard T, Zoulim F, Ratziu V, Degos F, Imbert-Bismut F, Deny P. Longitudinal assessment of histology surrogate markers (fibrotest-actitest) during lamivudine therapy in patients with chronic hepatitis b infection. Am J Gastroenterol. 100:1970-1980, 2005
24. Regev A, Berho M, Jeffers LJ, Milikowski C, Molina EG, Pyrsopoulos NT. Sampling error and intraobserver variation in liver biopsy in patients with chronic HCV infection. Am J Gastroenterol. 97:2614-2618, 2002
25. Tenney DJ, Rose RE, Baldick CJ, Pokornowski KA, Eggers BJ, Fang J. Long-term monitoring shows hepatitis b virus resistance to entecavir in nucleoside-naive patients is rare through 5 years of therapy. Hepatology. 49:1503-1514, 2009
26. Trinchet JC, Hartmann DJ, Pateron D, Laarif M, Callard P, Ville G. Serum type I collagen and n-terminal peptide of type iii procollagen in chronic hepatitis.
- 24 -
Relationship to liver histology and conventional liver tests. J Hepatol. 12:139-144, 1991
27. Tsutsumi M, Urashima S, Matsuda Y, Takase S, Takada A. Changes in type iv collagen content in livers of patients with alcoholic liver disease. Hepatology. 17:820-827, 1993
28. Wai CT, Cheng CL, Wee A, Dan YY, Chan E, Chua W. Non-invasive models for predicting histology in patients with chronic hepatitis b. Liver Int. 26:666-672, 2006 29. Wai CT, Greenson JK, Fontana RJ, Kalbfleisch JD, Marrero JA, Conjeevaram HS, et
al. A simple noninvasive index can predict both significant fibrosis and cirrhosis in patients with chronic hepatitis c. Hepatology. 38:518-526, 2003
30. Yabu K, Kiyosawa K, Mori H, Matsumoto A, Yoshizawa K, Tanaka E. Serum collagen type iv for the assessment of fibrosis and resistance to interferon therapy in chronic hepatitis c. Scand J Gastroenterol.29:474-479, 1994
- 25 -
- 국문 요약 –
만성 B 형 간염환자에서 엔테카비어 치료 후 간섬유화 혈청
표지자의 변화와 E 항원 소실의 독립적인 예측인자로서
procollagen III N-terminal peptide 의 의의
아주대학교 대학원 의학과 구 지 훈 (지도교수: 정 재 연) 배경 및 목적: 간섬유화의 진단에 이용되는 간생검은 침습적인 검사로서 부작용이 흔하고, 검체오류가 빈번하게 나타나는 등의 제한점을 가지고 있다. 이에 최근 비침습적인 간섬유화의 혈청 표지자들이 소개되어 활발히 연구되고 있다. 본 연구의 목적은 만성 B 형 간염환자에서 엔테카비어 치료 후 간섬유화 혈청 표지자의 변화를 조사하고 위 혈청표지자 중 치료반응의 독립적인 예측인자를 밝혀내기 위함이다. 대상 및 방법: 아주대병원에서 최소 12 개월 이상 엔테카비어를 투여 받은 60 명의 만성 B 형 간염환자들을 대상으로 간섬유화 및 염증의 혈청 표지자를 치료 시작시점과 치료 12 개월째에 각각 측정하여 분석하였다.
- 26 -
결과: The procollagen III N-terminal peptide (PIIINP), TIMP1, MMP2, 하이알루론산, 사이토케라틴 18 분절 수치가 치료 이후 유의하게 감소하였고, 합토글로빈 수치가 치료 이후 유의하게 증가하였다. 다변량 분석에서 PIIINP (P=0.028) 와 초기바이러스 반응 (P=0.019) 이 E 항원 소실의 독립적인 예측인자로 나타났다. 결론: 엔테카비어 치료 후, 만성 B 형 간염 환자에서 간섬유화 및 염증의 혈청 표자자들이 대부분 호전되었다. 치료 전 PIIINP 수치와 초기 바이러스 반응은 E 항원 소실의 독립적인 예측인자였다. 핵심어: procollagen III N-terminal peptide, 혈청 표지자, 치료 반응, 만성 B 형 간염, 엔테카비어


![[ 갑상선암 ]](data:image/gif;base64,R0lGODlhAQABAIAAAP///wAAACH5BAEAAAAALAAAAAABAAEAAAICRAEAOw==)