DOI: 10.1126/scitranslmed.3001423
, 77ra30 (2011);
3
Sci Transl Med
et al.
Jiong Tao
Editor's Summary
dividing cancer cell may act as a GPS that directs researchers down a new therapeutic avenue for gastric cancer. of this fusion gene as a drug target or prognostic tool will require more studies, but this particular mistake made by a cancer-driving genes, although the protein could also augment other cancer-promoting genetic aberrations. The utility implication of an overexpressed metabolism-related gene in some gastric tumors may define a new class of
Most other genes that are fused in cancers encode kinase enzymes or transcriptional regulatory proteins. The phenotype.
amounts of SLC1A2 than did wild-type cells, suggesting that this aberrant protein may trigger a pro-oncogenic fusion gene had higher
CD44-SLC1A2
cells. And in a final set of incriminating evidence, tumor cells that sported the
existed in higher concentrations in gastric cancer cells and cell lines than in normal
−−
can act as a growth regulator
which
−−
enhanced these traits. Consistent with the function of SLC1A2 as a transporter of glutamate, the amino acid and overexpression of the pruned protein
−−
hallmarks of cancer cells
−−
dividing and invading soft substrates
yes. Cells in which shortened SLC1A2 expression was silenced with small interfering RNA were less proficient at the truncated SLC1A2 contributes to gastric cancer development, and their evidence suggested that the answer is
But an abnormal protein that lives in tumor cells can be an innocent bystander. So, the authors asked whether cancers created by the authors through overexpression of the fusion gene in normal gastric cells.
inversion. The fusion gene generated a truncated SLC1A2 protein in the original tumors and in a new group of gastric , likely the result of a chromosome
CD44
probably the strong transcriptional promoter of its neighboring gene,
(which encodes a glutamate transporter) to what is
SLC1A2/EAAT2
chimeric gene fused most of the coding region of
established gastric tumor cell lines and pinpointed a common breakpoint in three and one, respectively. The resulting The authors analyzed copy number variations of genes in more than 100 primary gastric tumors and 27
gastric tumor cells and may contribute to the development of cancer.
cell lung cancers. Now, Tao and her co-workers have documented a fusion gene that forms in a small percentage of target for therapy. Gene fusions in solid cancers are not so easy to spot, but have been located in prostate and small
gene drives chronic myelogenous leukemia and has proven to be a vulnerable
BCR-ABL
example, the fused aberrant
fused to part of another, sometimes forming peculiar hybrid proteins that contribute to the cancer cell phenotype. For in the process. One result of this chaos is the birth of chimeric genes, wherein one gene segment gets erroneously
It's ironic, but cancer cells are notoriously bad at cell division, losing bits and rearranging chunks of the genome Bad Drivers Steer Scientists Toward New Drug Targets
http://stm.sciencemag.org/content/3/77/77ra30.full.html
can be found at:
and other services, including high-resolution figures, A complete electronic version of this article
http://stm.sciencemag.org/content/suppl/2011/04/04/3.77.77ra30.DC1.html
can be found in the online version of this article at: Supplementary Material
http://www.sciencemag.org/about/permissions.dtl
in whole or in part can be found at: article
permission to reproduce this of this article or about obtaining
reprints Information about obtaining
last week in December, by the American Association for the Advancement of Science, 1200 New York Avenue (print ISSN 1946-6234; online ISSN 1946-6242) is published weekly, except the
Science Translational Medicine
on November 26, 2013 stm.sciencemag.org Downloaded from on November 26, 2013 stm.sciencemag.org Downloaded from
C A N C E R
CD44-SLC1A2 Gene Fusions in Gastric Cancer
Jiong Tao,1,2 Nian Tao Deng,2 Kalpana Ramnarayanan,3Baohua Huang,1Hue Kian Oh,3 Siew Hong Leong,4Seong Soo Lim,5Iain Beehuat Tan,2,6Chia Huey Ooi,2Jeanie Wu,3 Minghui Lee,3 Shenli Zhang,2Sun Young Rha,7Hyun Cheol Chung,7Duane T. Smoot,8 Hassan Ashktorab,8 Oi Lian Kon,4Valere Cacheux,5Celestial Yap,1
Nallasivam Palanisamy,5* Patrick Tan1,2,3,5,9†
Fusion genes are chimeric genes formed in cancers through genomic aberrations such as translocations, am-plifications, and rearrangements. To identify fusion genes in gastric cancer, we analyzed regions of chromo-somal imbalance in a cohort of 106 primary gastric cancers and 27 cell lines derived from gastric cancers. Multiple samples exhibited genomic breakpoints in the 5′ region of SLC1A2/EAAT2, a gene encoding a gluta-mate transporter. Analysis of a breakpoint-positive SNU16 cell line revealed expression of aCD44-SLC1A2 fusion transcript caused by a paracentric chromosomal inversion, which was predicted to produce a truncated but functionalSLC1A2 protein. In primary tumors, CD44-SLC1A2 gene fusions were detected in 1 to 2% of gas-tric cancers, but not in adjacent matched normal gasgas-tric tissues. When we specifically silencedCD44-SLC1A2, cellular proliferation, invasion, and anchorage-independent growth were significantly reduced. Conversely, CD44-SLC1A2 overexpression in gastric cells stimulated these pro-oncogenic traits. CD44-SLC1A2 silencing caused significant reductions in intracellular glutamate concentrations and sensitized SNU16 cells to cisplatin, a commonly used chemotherapeutic agent in gastric cancer. We conclude that fusion of theSLC1A2 gene coding region toCD44 regulatory elements likely causes SLC1A2 transcriptional dysregulation, because tumors expressing highSLC1A2 levels also tended to be CD44-SLC1A2–positive. CD44-SLC1A2 may represent a class of gene fusions in cancers that establish a pro-oncogenic metabolic milieu favoring tumor growth and survival.
INTRODUCTION
Gastric adenocarcinoma, or gastric cancer (GC), is a leading cause of global cancer mortality, with a 5-year survival rate of ~20% (1, 2). Par-ticularly prevalent in several Asian countries (3), most GC patients present with advanced-stage disease, although in Japan and Korea screening programs with barium photofluorography or endoscopy al-low earlier detection (4, 5). Current strategies for treating GC patients are far from optimal, with conventional surgery and chemotherapy reg-imens conferring modest survival benefits and median survival times of 7 to 10 months (6).
Clinical risk factors for GC include a high-salt diet, Helicobacter pylori infection, and smoking (2). Although familial patterns of GC incidence have been reported, most GC cases are sporadic. Studies investigating the genetic basis of GC have identified germline poly-morphisms in cytokine genes (for example, interleukin 1b and TLR4) (7, 8) and mutations in cell junction genes (CDH1) as inherited GC risk factors (9). In gastric tumors, somatic mutations in oncogenes
and tumor suppressor genes such as p53, RUNX3, andb-catenin have been reported (10–12), along with signature genomic amplifications (7q, 8p, 17q, and 20q) and deletions (5q, 6p, and 18q) (13). Identifying additional molecular aberrations in GC could provide further mech-anistic insights into GC pathogenesis and highlight opportunities for early detection and new therapies.
Fusion genes are hybrid genes formed by the combination of two normally separate and distinct genes. In cancers, fusion genes can be produced by genomic amplifications, translocations, and rearrange-ments (14), resulting in juxtaposition of oncogenic proteins with strong promoters (for example, IgH-Myc) (15) or chimeric proteins with on-cogenic signaling potential (for example, BCR-ABL) (16). Because of their cancer-specific nature, fusion genes have the potential to act as useful diagnostic and therapeutic targets. To date, the vast majority of cancer-related fusion genes have been identified primarily in hem-atological malignancies, where they have been used to identify partic-ular cancer subtypes (for example, PML-RARa in acute promyelocytic leukemia) and used as drug targets [for example, BCR-ABL in chronic myelogenous leukemia (CML)] (17, 18).
In contrast to the hematological malignancies, in solid epithelial cancers, very few fusion genes have been identified. In these cancers, higher genomic complexity and clonal heterogeneity can confound standard cytogenetic assays (19). Nevertheless, recent discoveries of TMPRSS2-ERG in prostate cancer (20) and EML4-ALK in non–small cell lung cancer (21) have confirmed the existence of recurrent fusion genes in solid tumors and shown that these can be identified with high-resolution genomic approaches. Previously, we have used transcrip-tome sequencing to identify BRAF-related gene fusions in GC, providing evidence for this important class of molecular aberrations in gastrointestinal (GI) cancers (22). Here, we adopted an alternative strategy to discover a recurrent fusion gene in GC.
1
Department of Physiology, Yong Loo Lin School of Medicine, National University of Singapore, 5 Lower Kent Ridge Road, Singapore 119074, Singapore.2Cancer and Stem Cell Biology, Duke-NUS Graduate Medical School, 8 College Road, Singapore 169857, Singapore. 3
Cellular and Molecular Research, National Cancer Centre of Singapore, 11 Hospital Drive, Singapore 169610, Singapore.4Division of Medical Sciences, National Cancer Centre of Singapore, Singapore 169610, Singapore.5Genome Institute of Singapore, 60 Biopolis Street, Genome 02-01, Singapore 138672, Singapore.6Division of Medical Oncology, National Cancer Centre of Singapore, Singapore 169610, Singapore.7Department of Internal Medicine, Yonsei Cancer Center, Yonsei University College of Medicine, 134 Shinchon-Dong, Seodaemun-Ku, Seoul 120-752, South Korea.8Department of Medicine and Cancer Center, Howard University College of Medicine, 2041 Georgia Avenue, Washington, DC 20060, USA.9Cancer Science Institute of Singapore, Yong Loo Lin School of Medicine, National University of Singapore, Singapore 119074, Singapore.
*Present address: Michigan Center for Translational Pathology and Department of Pathology, University of Michigan, Ann Arbor, MI 48109, USA.
†To whom correspondence should be addressed. E-mail: [email protected]
on November 26, 2013
stm.sciencemag.org
RESULTS
Analysis of GC copy number alterations identifies recurrentSLC1A2/EAAT2 genomic breakpoints
We hypothesized that a detailed fine-scale survey of genomic copy number alterations (CNAs) in GC might reveal potential genes dis-rupted by fusion events. Using high-density array-based comparative genomic hybridization (aCGH) microarrays, we profiled a discovery cohort of 133 GCs (106 primary tumors and 27 cell lines). In a valida-tion of the aCGH data, we successfully reidentified several previously described genomic aberrations in GC, including amplifications in c-Myc (23), HER2 (24), RAB23 (25), and PTEN deletions (26) (fig. S1). To
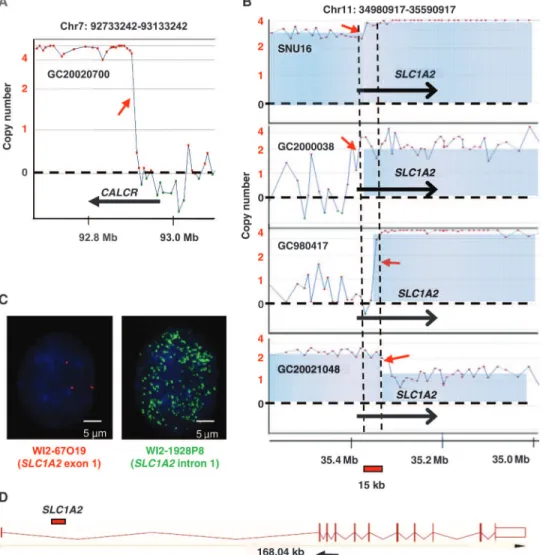
nominate potential fusion genes, we used a technique called genomic breakpoint analysis (GBA), previously used to identify fusion genes in leukemia (27). In this strategy, putative chromosomal breakpoints were identified by examining closely spaced microarray probes displaying prominent transitions in copy number status, from low to high copy number or vice versa. Figure 1A provides a representative example of a genomic breakpoint in the CALCR gene. In total, we identified 99 ge-nomic breakpoints occurring in genes such as CALCR, PERLD1, and CKAP5 (table S1).
For most genes exhibiting genomic breakpoints in multiple samples (for example, CRKRS and TTC25), the breakpoints were randomly scat-tered throughout the gene body, consistent with a random breakage dur-ing chromosomal amplification. However, 4 of 133 GCs (three primary tumors and one cell line—GC980417, GC20021048, GC2000038, and SNU16) exhibited ge-nomic breakpoints specifically localized to the 5′ region of the SLC1A2/EAAT2 gene, encoding a high-affinity glutamate trans-porter (hereafter referred to as SLC1A2) (Fig. 1B). To validate the SLC1A2 break-point region, we performed fluorescence in situ hybridization (FISH) analysis using fosmid probes that mapped upstream or downstream of the putative breakpoint (WI2-67O19 and WI2-1928P9). Support-ing the aCGH data, the WI2-67O19 upstream probe (35384118-35427600) cov-ering the first exon of SLC1A2 showed three to four signals in SNU16 nuclei (Fig. 1C, left), confirming previous stu-dies that SNU16 is a naturally tetraploid cell line (28). In contrast, the downstream WI2-1928P9 probe (35323126-35359663) located at SLC1A2 intron 1 showed mul-tiple hybridization signals (>50 copies), indicating a large amplification event (Fig. 1C, right).
SLC1A2 breakpoint characterization reveals aCD44-SLC1A2 gene fusion Integrating the SLC1A2 breakpoint re-gions from the aCGH and the FISH data, we defined a 15- to 24-kb minimal com-mon breakpoint window in the SLC1A2 first intron (Fig. 1, B and D, red bar). We hypothesized that chromosomal aberra-tions affecting this region might disrupt the SLC1A2 gene and result in potential fusion partners. To test this possibility, we performed 5′ RNA ligase–mediated rap-id amplification of complementary DNA (cDNA) ends (RLM-RACE) to character-ize SLC1A2 transcript sequences upstream of SLC1A2 exon 2. A 250–base pair (bp) 5′ RACE product was identified in breakpoint-positive SNU16 cells, but not in other GC
Fig. 1. Genomic breakpoint analysis of gastric cancer. (A) Representative example of a genomic breakpoint. aCGH profile of gastric cancer (GC) tumor GC20020700 exhibiting a genomic breakpoint in the CALCR gene on chromosome 7q12. X axis, physical chromosomal coordinates; y axis, log2-transformed smoothened values (that is, dotted line at 0 indicates copy number equal to 2). Red arrow, breakpoint of interest; dot, a microarray probe. (B) Genomic breakpoints in the 5′ region of SLC1A2 in four GCs (three primary tumors and one cell line: GC2000038, GC980417, GC20021048, and SNU16). Red arrows, breakpoints of interest. (C) FISH validation of SLC1A2 breakpoints. Probes WI2-67O19 (red) and WI2-1928P9 (green) cover SLC1A2 exon 1 or intron 1, respectively. (D) Genomic organization of the SLC1A2 gene. Vertical bars represent SLC1A2 exons connected by intervening introns. Total length of the SLC1A2 gene is 168 kb. Red bar, minimal com-mon recurrent breakpoint region in SLC1A2 intron 1 (15 to 24 kb); black arrow, location of oligonucleotide primer used for 5′ RLM-RACE analysis.
on November 26, 2013
stm.sciencemag.org
cell lines without SLC1A2 breakpoints (AGS, YCC1, YCC9, and N87) (Fig. 2A). Sequenc-ing of the amplified SNU16 product re-vealed a CD44-SLC1A2 fusion transcript, formed by the juxtaposition of CD44 exon 1 to SLC1A2 exon 2 (Fig. 2B). Complemen-tary to the 5′ RACE analysis, a 3′ RACE analysis in SNU16 cells that characterized transcripts downstream of SLC1A2 exon 1 did not identify any additional fusion partners besides wild-type SLC1A2 tran-scripts (fig. S2A). To validate the 5′ RACE results, we designed combination sets of polymerase chain reaction (PCR) primers targeting CD44 exon 1 (forward primer) and SLC1A2 exons 3 to 6 (reverse primers) to directly detect the fusion by reverse transcription–PCR(RT-PCR).CD44-SLC1A2 transcripts were detected in SNU16 cells, but not in other cell lines or in commer-cially available normal gastric (NG) tissue (Fig. 2C and fig. S2B). We confirmed expres-sion of a complete ~1.6-kb CD44-SLC1A2 transcript in SNU16 cells using RT-PCR primers targeting CD44 exon 1 and SLC1A2 exon 11 (the last SLC1A2 exon) (fig. S2C). These results demonstrate the existence of a CD44-SLC1A2 gene fusion in SNU16 cells.
CD44 and SLC1A2 lie adjacent to each other on chromosome 11p13, being sep-arated by only ~19 kb (Fig. 2D). The two genes are transcribed toward each other, indicating that they have distinct promo-ters. Because they lie on opposite strands, it is unlikely that the CD44-SLC1A2 fusion is caused by a transcriptional readthrough event (29). We thus hypothesized that the CD44-SLC1A2 gene fusion might have been caused by a paracentric chromosomal inversion (fig. S3A). Notably, 11p13-15, where CD44 and SLC1A2 are located, has been described as a frequent site of genome rearrangement in gastric and esophageal cancers (30). Spectral karyotyping (SKY) analysis confirmed the presence of at least two 11p13-11p14 genome rearrangements in SNU16 cells: one involving fusion of chro-mosome 1 with chrochro-mosome 11 at band 11p13-14 and the second involving a com-plex chromosomal scenario with rearrange-ments joining chromosomes 5, 10, and 11 (fig. S3B).
We used two different strategies to verify the presence of CD44/SLC1A2 genomic inversions in this region. First, we used fiber-FISH, a high-resolution method for genomic DNA mapping (31). Fosmid
Fig. 2. CD44-SLC1A2 gene fusions. (A) 5′ SLC1A2 RLM-RACE of GC cell lines. (B) CD44-SLC1A2 fusion se-quence. Blue, CD44 exon 1; red, SLC1A2 exon 2; underline, ATG sites. (C) CD44-SLC1A2 RT-PCR. Primers were targeted to CD44 exon 1 (blue arrow) and SLC1A2 exons 3 to 6 (orange arrows). NG, normal stomach; N87, fusion-negative line. (D) Top: CD44 and SLC1A2 chromosomal organization. Bottom: CD44-SLC1A2 relation-ship to CD44 and SLC1A2 parent genes. (E) Fiber-FISH. Top: Probe 1 (Rp1-68d18) covers CD44 (3′ of intron 1) and SLC1A2 (3′ of intron 1). Probe 2 (Rp11-1148l23) covers the 5′ region of SLC1A2 intron 1 and upstream sequence. Bottom: Fiber-FISH images of control CCL159 cells and fusion-positive SNU16 cells. (F) Long-range PCR. Primers were targeted to CD44 exon 1 and the SLC1A2 first intron [black arrows in (E)]. SNU16, fusion-positive; AGS, fusion-negative. Primers are black arrows in (E). (G) Western blot of fusion-positive SNU16 and fusion-negative AGS and SNU5 cells (membrane fractions). Top: Anti-SLC1A2 antibodies. Bottom:a-Tubulin antibody control. (H) CD44-SLC1A2 ectopic expression. Top: CD44-SLC1A2 expression construct carrying a GFP tag. Arrow, promoter. ATG sites in CD44 exon 1 and SLC1A2 exon 2 are shown. Bottom: Immunoblotting with anti-SLC1A2 antibodies.
on November 26, 2013
stm.sciencemag.org
probes Rp1-68d18 (35146316-35329998, covering the CD44 gene and a portion of the SLC1A2 gene) and Rp11-1148l23 (35294107-35461767, covering the SLC1A2 gene only) were hybridized to SNU16 cells or normal lymphoblastoid CCL159 cells. In the control CCL159 cells, we observed a normal chromosome as indicated by two distinct red and green probe signals lying adjacent to one another. In contrast, we detected in SNU16 cells a“split-apart” red-green-red signal, consistent with an inver-sion event occurring between these probes (Fig. 2E). Second, we directly confirmed a CD44/SLC1A2 genomic inversion in SNU16 cells using long-range genomic PCR, followed by end-sequencing of the PCR products. Using primers located to CD44 exon 1 and the SLC1A2 first intron (black arrows in Fig. 2E), we successfully PCR-amplified and sequence-validated a CD44-SLC1A2 inversion product in SNU16 fusion-positive cells but not in AGS cells (Fig. 2F). Collectively, these two alternative methods confirm the presence of a chromosomal inversion event in SNU16 cells between CD44 and SLC1A2.
Sequence analysis of the CD44-SLC1A2 fusion revealed two distinct protein translation patterns (fig. S4A). First, translation initiating from an ATG site in CD44 exon 1 could produce a 65–amino acid protein, comprising 22 amino acids of CD44 and 43 amino acids of novel se-quence. Second, protein translation might also initiate from an alternative ATG site in SLC1A2 exon 2, downstream of the fusion site. Translation from this alternative ATG would produce a 565–amino acid–long trun-cated SLC1A2 protein, which is 17 amino acids shorter than the full-length form, but retaining all functionally relevant domains including transmembrane helices and symporter domains.
To test whether CD44-SLC1A2 might produce a truncated SLC1A2 protein, we performed Western blotting using anti-SLC1A2 antibodies on fusion-positive and -negative GC cells. In SNU16 fusion-positive cells, we detected a smaller-sized SLC1A2 protein compared to fusion-negative AGS and SNU5 cells (Fig. 2G), consistent with translation initiating from SLC1A2 exon 2 in SNU16 cells. To further demonstrate that the alter-native ATG in SLC1A2 exon 2 is capable of initiating protein translation, we cloned and expressed the full-length CD44-SLC1A2 fusion gene in HFE145 gastric cells (32). Western blotting analysis confirmed expression of an immunoreactive SLC1A2 product in CD44-SLC1A2–transfected HFE145 cells of the expected size (Fig. 2H). This result demonstrates that the alternative ATG in SLC1A2 exon 2 is sufficient to initiate translation. CD44-SLC1A2 gene fusion is expressed in primary
gastric cancers
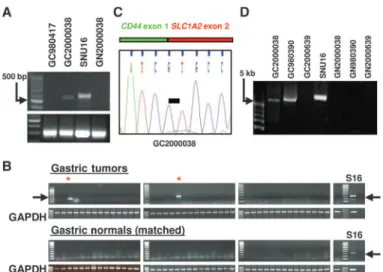
To test whether CD44-SLC1A2 is expressed in clinical specimens, we screened two of the three original index cases exhibiting SLC1A2 ge-nomic breakpoints (Fig. 1B). The third index tumor, GC20021048, had insufficient material available for analysis. CD44-SLC1A2 expression was detected in tumor GC2000038, but not in corresponding matched normal tissue (Fig. 3A). This result demonstrates that CD44-SLC1A2 expression can occur in primary tumors and that it is not a“private” event confined to SNU16 cells alone.
We then performed CD44-SLC1A2 RT-PCR screening in an in-dependent panel of 43 gastric tumors and matched gastric normal tis-sues. Two additional tumors that expressed the CD44-SLC1A2 fusion transcript were identified (Fig. 3B). Similar to the index samples, CD44-SLC1A2 was not expressed in corresponding matched normal samples (Fig. 3B, bottom), supporting the cancer-specific nature of the fusion transcript. Subsequent cloning and sequencing of CD44-SLC1A2 in the fusion-positive tumors revealed that the fusion consistently in-volved the juxtaposition of CD44 exon 1 to SLC1A2 exon 2 (Fig. 3C and fig.
S4B). Analysis of CD44-SLC1A2 DNA sequences 3′ to the fusion junc-tion revealed a silent C/T polymorphism in SLC1A2 exon 4 between fusion-positive SNU16 and GC980390 (fig. S4C), confirming that the CD44-SLC1A2 transcripts are indeed distinct entities. This apparent re-quirement for precise fusion may be because, among the SLC1A2 exons, only exon 2 has a suitable alternative start ATG to initiate translation of a near-complete SLC1A2 protein. Using long-range PCR, we also con-firmed the presence of CD44/SLC1A2 genomic inversions at the DNA level in two fusion-positive clinical specimens (GC980390 and GC2000038) (Fig. 3D). No genomic inversion products were observed in the matched normal gastric samples, indicating that the CD44/SLC1A2 inversion is a cancer-associated somatic event.
CD44-SLC1A2 silencing reduces cancer cell proliferation, invasion, and colony formation
To investigate the functional consequences of inhibiting CD44-SLC1A2 expression, we designed a series of customized small interfering RNAs (siRNAs) targeting the CD44-SLC1A2 fusion site. Treatment of SNU16 cells with fusion-specific siRNAs successfully silenced CD44-SLC1A2 expression, but did not discernibly alter the independent expression of CD44 or SLC1A2 (Fig. 4A). Using SLC1A2 antibodies, we confirmed silencing at the protein level by both Western blotting and immuno-fluorescence assays (Fig. 4B and fig. S5). Similar results were obtained with a second CD44-SLC1A2 targeting siRNA containing overlapping but distinct sequence (fig. S5). These results confirm the efficacy of the fusion-specific siRNAs.
SNU16 cells stably silenced with CD44-SLC1A2 siRNAs resulted in a significant reduction in cell proliferation capacity compared to cells
Fig. 3. CD44-SLC1A2 expression in primary GCs. (A) CD44-SLC1A2 RT-PCR on two index primary GCs (GC980417 and GC2000038) with SLC1A2 ge-nomic breakpoints (see Fig. 1). GN2000038 is the matched normal sample to GC2000038. Fusion-positive SNU16 cells are included as a positive con-trol. (B) CD44-SLC1A2 RT-PCR on 43 gastric tumors and matched NG tissues. Top: Tumors. Red asterisk, CD44-SLC1A2–expressing tumors (GC980390 and GC2000639). Bottom: Matched normal tissue. SNU16 is included as a pos-itive control. GAPDH, glyceraldehyde-3-phosphate dehydrogenase. (C) Sequence of the CD44-SLC1A2 fusion junction in GC2000038. Black bar, fusion junction. (D) Long-range genomic PCR analysis. Primers used are the same as in Fig. 2F. GC2000038 and GC980390 are fusion-positive primary GCs. GN2000038 and GN980390 are matched normal controls.
on November 26, 2013
stm.sciencemag.org
treated with scrambled siRNAs (Fig. 4C; P = 0.002, t test). No effects were observed when the fusion-specific siRNA was applied to AGS cells, which do not express CD44-SLC1A2 (fig. S6, A and B). These results sug-gest that CD44-SLC1A2 may be important for cancer cell proliferation in GC. To assess the tumorigenicity of SNU16 upon CD44-SLC1A2 knock-down, we performed colony formation assays. Fusion-silenced cells ex-hibited a significantly decreased amount of anchorage-independent growth compared to controls (P = 0.01, Fig. 4D; see fig. S7 for enlarged figures). We then conducted Matrigel assays to investigate the effects of
CD44-SLC1A2 on cancer cell invasion. CD44-SLC1A2–silenced SNU16 cells also exhibited a decreased level of cell invasion compared with control cells (Fig. 4E, P = 0.0013), suggesting a potential role for CD44-SLC1A2 in cell motility and invasion.
To determine whether CD44-SLC1A2 expression might be suffi-cient to enhance various pro-oncogenic traits, we stably overexpressed SLC1A2 in HFE145 NG cells. Compared to control cells, CD44-SLC1A2–expressing HFE145 cells exhibited enhanced cell proliferation (P = 0.007), colony formation (P = 0.02), and invasion (P = 7.75 × 10⁻⁵) (Fig. 4, F to H). Collectively, these results suggest that CD44-SLC1A2 is likely re-quired by GC cells to maintain several pro-oncogenic traits, such as prolifera-tion, colony formaprolifera-tion, and invasion.
The observation that CD44-SLC1A2 produces an almost full-length SLC1A2 protein lacking only 17 amino acids raises the possibility that wild-type SLC1A2 might also be pro-oncogenic. Indeed, silencing of wild-type SLC1A2 in AGS cells, which are fusion-negative, resulted in phenotypic ef-fects comparable to those of CD44-SLC1A2 silencing in SNU16 cells (fig. S8). In this re-gard, CD44-SLC1A2 may be similar to on-cogenic fusion genes such as IgH-Myc and TMPRSS2-ERG (15, 20), where an essen-tially full-length pro-oncogenic protein is placed under the control of a strong tran-scriptional promoter.
CD44-SLC1A2 silencing significantly reduces intracellular glutamate concentrations and sensitizes GC cells to chemotherapy
One possible mechanism by which CD44-SLC1A2 may contribute to tumor develop-ment is by facilitating glutamate uptake in GC cells. In many cancers, glutamate and its related amino acid glutamine have been shown to function as important amino acids regulating tumor growth and sur-vival (33, 34). To assess the concentrations of glutamate in primary GCs, we used a colorimetric glutamate assay to measure glutamate in a panel of matched tumor and normal pairs (see Materials and Meth-ods). Significantly elevated concentrations of glutamate were detected in primary tu-mors compared to matched normal stom-ach controls (n = 20; P = 0.038, paired t test) (Fig. 5A). To test the influence of CD44-SLC1A2 on intracellular glutamate, we then compared concentrations of in-tracellular glutamate across the GC cell lines. We observed significantly higher ba-sal glutamate concentrations in CD44-SLC1A2–expressing SNU16 cells than in AGS cells (Fig. 5B, P = 0.009). However,
Fig. 4. CD44-SLC1A2 fusions enhance cellular proliferation, colony formation, and invasion. (A) CD44-SLC1A2 silencing by fusion-specific siRNA1 (CGCAGAUCGUGCCAACAAUUU). CD44-SLC1A2 expression was measured 24, 48, and 72 hours after siRNA treatment. CD44: wild-type CD44 expression. CD44 primers were designed to target exons 3 to 5. SLC1A2: wild-type SLC1A2 expression. SLC1A2 primers were designed to target exon 1. GAPDH was used as a loading control. (B) Western blotting. SLC1A2 protein levels were monitored with anti-SLC1A2 antibodies.a-Tubulin is used as a loading control. SNU16 cells before (−) and after (+) treatment with fusion-specific siRNAs. (C to E) Effects of CD44-SLC1A2 knockdown. (C) Proliferation rates of SNU16 cells before and after CD44-SLC1A2 siRNA treatment. (D) Colony formation assays with SNU16 cells before and after CD44-SLC1A2 siRNA treatment. (E) Cell invasion assays with SNU16 cells before and after CD44-SLC1A2 siRNA treatment. (F to H) Effects of CD44-SLC1A2 overexpression. (F) Cell proliferation rates of HFE145 cells before and after CD44-SLC1A2 overexpression. (G) Colony formation assays with HFE145 cells before and after CD44-SLC1A2 overexpression. (H) Cell invasion assays with HFE145 cells before and after CD44-SLC1A2 over-expression. All experiments were performed in triplicate. P values were computed with Student’s t test. Red asterisks, P values exceeding the significance threshold (P < 0.05).
on November 26, 2013
stm.sciencemag.org
after CD44-SLC1A2 siRNA treatment, SNU16 glutamate levels were sig-nificantly reduced compared to scrambled siRNA controls (Fig. 5B, P = 0.01). No significant effects were observed when the fusion siRNA was applied to AGS cells (Fig. 5B). This observation suggests that CD44-SLC1A2 may function to regulate intracellular glutamate levels in GC. Inhibition of glutamate metabolism in cancer cells causes sensitiza-tion to pharmacologic treatment (35). To test whether CD44-SLC1A2 si-lencing might sensitize GC cells to drug treatment, we treated control and
CD44-SLC1A2–silenced SNU16 cells to increasing concentrations of cis-platin, a chemotherapy reagent commonly used in GC treatment, and computed GI50s, the drug concentration required to cause 50% growth
in-hibition. We found that SNU16 cells were significantly more sensitive to cisplatin after CD44-SLC1A2 siRNA treatment, with a reduction in GI50
from 11.8 to 3.96mM (P = 1.11 × 10⁻⁶, Fig. 5C). The sensitization of CD44-SLC1A2–silenced cells appears to be specific to cisplatin, because no dif-ferences between control and silenced cells were observed upon treatment with 5-fluorouracil (5-FU), another GC chemotherapy agent (fig. S9). Tumors expressing highSLC1A2 levels are associated withCD44-SLC1A2 positivity
CD44 is highly expressed in many cancers including GC (36). One con-sequence of the CD44-SLC1A2 fusion might thus be to place SLC1A2 under the regulatory control of CD44 promoter elements, causing high amounts of SLC1A2 expression in tumors. If this were true, tumors expressing high SLC1A2 levels should also tend to be CD44-SLC1A2– positive. To explore this possibility, we queried a previously described gene expression database of 197 GCs to identify tumors expressing high SLC1A2 levels (37). We screened 15 GCs from the top 15% of SLC1A2-overexpressing tumors for CD44-SLC1A2 expression. Among the 15 tumors, five GCs expressed the CD44-SLC1A2 fusion transcript (Fig. 6, blue crosses), and none of the matched adjacent normal tissues ex-pressed CD44-SLC1A2 (Fig. 6). Thus, whereas the rate of CD44-SLC1A2 positivity in an unselected patient cohort is low (1 to 2%), the CD44-SLC1A2 positivity rate is elevated in this selected subpopulation (33%, 5 of 15 tumors). This result is consistent with the CD44-SLC1A2 fusion causing the transcriptional up-regulation of SLC1A2. In CD44-SLC1A2– negative tumors, high SLC1A2 levels may be due to alternative mecha-nisms, such as focal genomic amplification, fusion to other partners, and epidermal growth factor (EGF) or mammalian target of rapamycin (mTOR)/Akt signaling (38, 39).
An unsupervised clustering analysis of the 197 gastric tumor gene ex-pression profiles revealed that most of high SLC1A2–expressing tumors tended to cluster together (>75%), suggesting that high SLC1A2 expression
Fig. 5. CD44-SLC1A2 regulates intracellular glutamate levels and sensitizes cells to cisplatin. (A) Glutamate concentrations in primary GCs compared to matched normal controls. X axis, 20 cancer/normal pairs. P values were computed with a paired t test comparing each tumor to its matched normal control. (B) Gluta-mate concentrations in GC cells before and after CD44-SLC1A2 siRNA treatment. All experiments were performed in triplicate. (C) Cisplatin sensitivity of SNU16 cells with and without stable CD44-SLC1A2 siRNA silencing. All experiments were performed in triplicate. P values were computed at 10mM cisplatin. P values for (B) and (C) were computed with a t test. Red asterisk, P values exceeding the significance threshold (P < 0.05).
Fig. 6. CD44-SLC1A2–positive tumors are associated with high SLC1A2 ex-pression. Graph: SLC1A2 mRNA expression in 197 GCs. Gene expression data were median-centered. The top 15% of high SLC1A2–expressing tumors are shown in red. Inset: RT-PCR screening of CD44-SLC1A2 in the top 15% of high SLC1A2–expressing GCs and matching 15 NG tissues. GAPDH was used as a loading control. Blue crosses, samples expressing CD44-SLC1A2. SNU16 cells (S16) were included as a positive control. The smaller band of 200 bp was sequenced and identified to be nonspecific (ns).
on November 26, 2013
stm.sciencemag.org
may define a distinct molecular subgroup of GC (fig. S10). To identify predominant biological themes associated with this molecular subgroup, we performed gene ontology (GO) analysis on a 710-gene“SLC1A2 sig-nature,” generated by comparing the top 15% of high SLC1A2–expressing tumors against the bottom 15% [Wilcoxon signed rank test, false discov-ery rate (FDR) = 0.005]. Genes expressed in high SLC1A2–expressing tu-mors were associated with ribosomal biosynthesis and protein translation (corrected P = 5.12 × 10⁻³³, Fisher’s test; table S2). These results suggest that tumors expressing high SLC1A2 levels, by either CD44 fusion or alternative mechanisms, may comprise a distinct subclass of GC. CD44-SLC1A2 expression can occur independently of 11p13 amplification
Although CD44-SLC1A2 was initially identified in tumors exhibiting 11p13 amplification (Fig. 1B), 11p13 amplification may not be an ab-solute prerequisite for CD44-SLC1A2 fusion expression. To investigate the relationship between 11p13 genomic amplification and CD44-SLC1A2 expression, we analyzed seven fusion-positive tumors using Affymetrix SNP6 arrays. Of seven fusion-positive tumors, two tumors (GC980390 and GC990172) exhibited evidence of 11p13 genomic amplification, whereas the other five did not (fig. S11). This finding demonstrates that CD44-SLC1A2 expression can be observed in tumors independent of 11p13 genomic amplification. To further investigate the notion that 11p13 amplification and CD44-SLC1A2 gene fusion are dis-tinct events, we compared CD44 and SLC1A2 expression across 45 gas-tric tumors, including (i) 11p13-nonamplified samples (32 samples), (ii) 11p13-amplified but fusion-negative samples (6 samples), and (iii) CD44-SLC1A2 fusion-positive samples (7 samples). The rate of 11p13 amplifica-tion in this series (~17%) is similar to frequencies previously reported in the literature (40). It is important to note that in this experiment, the ex-pression measurements were inferred using U133P2 Affymetrix microar-ray probes, which target the 3′ ends of genes. Compared to nonamplified samples, fusion-positive samples exhibited significantly increased 3′ SLC1A2 gene expression (P = 0.004), but 11p13-amplified samples did not (P = 0.86) (fig. S11A). These findings suggest that high SLC1A2 expression levels may be driven more by fusion events rather than by generalized 11p13 amplification. The one exception was a sample with a high-level focal 11p13 amplification (GC980417); in this tumor, SLC1A2 was highly expressed (fig. S11A). Intriguingly, unlike SLC1A2, a very dif-ferent scenario was observed for CD44. Specifically, although CD44 3′ transcripts were significantly overexpressed in 11p13-amplified tumors (P = 0.016), they were significantly underexpressed in fusion-positive tu-mors (P = 0.006) (fig. S11B). We speculate that this latter finding may be due to the CD44/SLC1A2 genomic inversion decoupling the 3′ end of the CD44 gene (the region detected by the Affymetrix array) from the endogenous CD44 promoter. Additional evidence of this decou-pling was obtained in a real-time PCR analysis measuring SLC1A2 ex-on 1, where, unlike the 3′ SLC1A2 transcripts, SLC1A2 exon 1 (which is not part of the CD44-SLC1A2 fusion) was not observed to be highly expressed relative to nonamplified samples in fusion-positive samples (fig. S11, C and D).
DISCUSSION
The cancer-specific nature of fusion genes has earned them an impor-tant place in many translational cancer research applications, including molecular subtyping, monitoring for disease relapse, and as drug
tar-gets. In pediatric acute lymphoblastic leukemia (ALL), expression of AML-ETO and PML-RAR is routinely used to diagnose particular clin-ical subtypes (17), and treatment of CML has been revolutionized by imatinib, an inhibitor of the BCR-ABL fusion gene (18). Along with AGTRAP-BRAF fusions (22), CD44-SLC1A2 represents another recur-rent gene fusion identified in a major GI cancer, providing further ev-idence for the existence of this important class of molecular aberrations in GI malignancies.
Here, we used GBA to uncover the existence of CD44-SLC1A2 gene fusions in GC. Notably, although GBA has been previously used for fusion gene discovery in leukemia (27, 41), our study demonstrates that this approach can also highlight potential fusion genes in solid epithe-lial tumors. Among genes exhibiting genomic breakpoints, we priori-tized genes for study based on their rate of recurrence in multiple samples and occurrence in a cell line to serve as an experimental model. Using these two criteria, we nominated only two genes: SLC1A2 and ZNF1A3. We note that GBA does come with a few caveats, because fusion events arising from balanced chromosomal rearrangements would not alter overall copy number levels and are unlikely to be de-tected. However, GBA has the advantage of being readily applicable to aCGH data, for which there are already numerous large-scale data sets readily available in the public domain (42). Revisiting these data sets may identify additional genes recurrently targeted by genomic break-points in solid cancers.
The identification of SLC1A2, a glutamate transporter, as a fusion gene participant is notable. To date, the vast majority of known onco-genic fusion events have largely involved transcription factors (for ex-ample, Myc and RAR) or kinases (for exex-ample, BCR-ABL) (15–17). The discovery of CD44-SLC1A2 raises the intriguing possibility that onco-genic gene fusions may also target genes involved in cancer metabo-lism. Specifically, the CD44-SLC1A2 gene fusion is predicted to produce a slightly truncated SLC1A2 protein that retains most of the key protein domains required for glutamate transporter fusion, and may function to facilitate glutamate accumulation in GC cells. A sub-stantial body of evidence has implicated glutamate and glutamine as critical amino acids necessary for the maintenance and elaboration of cancer-specific traits (43). For example, glutamate and glutamine have been shown to regulate tumor growth and oncogenic signals such as mTOR (44). The requirement of cancer cells for glutamate may also be related to the Warburg effect, a universal feature of cancer cells where they exhibit overactive glycolysis because of a deficiency in channeling glycolytic metabolites into the tricarboxylic acid (TCA) cycle for adenosine triphosphate (ATP) generation. Glutamate may provide cancer cells with an alternative route of ATP production be-cause intracellular glutamate and glutamine can also be converted into a-ketoglutarate, a TCA cycle intermediate (45). Glutamate levels have been shown to be elevated in many cancers, and in our study, we con-firmed that glutamate levels are also elevated in gastric tumors com-pared to normal stomach, consistent with a previous report (46).
The absolute rate of CD44-SLC1A2 positivity was relatively low in this study (1 to 2%); however, analyses of larger GC patient cohorts will be required to determine the true CD44-SLC1A2 positivity rate. Never-theless, we note that even low-frequency events in cancer can prove therapeutically useful, as shown by EML4-ALK fusions in lung cancer (1 to 5%) (21) and RAF fusions in gastric, melanoma, and prostate cancers (22). As a cell membrane–bound receptor, CD44-SLC1A2 may prove amenable to targeting using either small molecules or therapeutic anti-bodies. Several of the CD44-SLC1A2–positive GCs in our study also
on November 26, 2013
stm.sciencemag.org
exhibited focal amplifications in genes specifically related to RTK (receptor tyrosine kinase)/RAS/MAPK (mitogen-activated protein kinase) signal-ing, including SNU16 (FGFR2), GC2000114 (MET), GC2000639 (KRAS), and GC980390 (ERBB2). CD44-SLC1A2 may collaborate with these canonical oncogenes to facilitate MAPK signaling in GC. Beyond its effects in cancer development, targeting CD44-SLC1A2 in fusion-positive tumors may also represent a promising avenue for sensitizing GCs to commonly used standard-of-care chemotherapies, because silencing CD44-SLC1A2 was sufficient to cause a significant sensitization of GC cells to cisplatin in vitro. It will be interesting to evaluate the potential of CD44-SLC1A2 as a potential drug target, and determining exactly how this gene fusion, and possibly other glutamate-related transporters, might contribute to GC development by establishing a metabolic envi-ronment favoring oncogenesis.
MATERIALS AND METHODS Primary tumors and cell lines
Primary gastric tumors were obtained from the SingHealth Tissue Re-pository, an institutional resource of National Cancer Centre of Singapore and Singapore General Hospital. All patient samples were obtained with informed patient consent and approvals from Institutional Review Boards and Ethics Committees. GC cell lines AGS, KATO III, SNU1, SNU16, N87, and Hs746T were purchased from the American Type Culture Collection. AZ521, Ist1, TMK1, MKN1, MKN7, MKN28, MKN45, MKN74, Fu97, and IM95 cells were obtained from the Japan Health Science Research Resource Bank. SCH cells were provided by Y. Ito (Cancer Sciences Institute of Singapore). YCC cells were a gift from S.-Y. Rha (Yonsei Cancer Center, South Korea).
RNA and DNA extraction
Genomic DNA from samples was extracted with a Qiagen Blood and Cell Culture DNA extraction kit. Total RNA was extracted with RNA extraction reagents (Qiagen). Both RNAs and DNAs were quantitated with either NanoDrop ND-1000 (NanoDrop Technologies) or Agilent Bioanalyzer 2100 (Agilent Technologies).
GBA
GBA was performed on a panel of 106 primary tumors and 27 cell lines with Agilent 244K Human Genome Microarrays (Agilent Technologies). Sample labeling and hybridizations were performed according to the manufacturer’s instructions. Tumor and control genomic DNAs (human spleen DNA) were labeled with Cy3-dUTP (deoxyuridine triphosphate) and Cy5-dUTP, respectively. Hybridized slides were scanned on an Agilent DNA Microarray Scanner (Agilent Technologies), and images were extracted with Agilent Feature Extraction software. Data were ana-lyzed with Agilent CGH Analytics software (v.3.5) using a Z-score al-gorithm with a threshold of 2.0 and a one-point window to identify genomic breakpoints.
FISH
SNU16 interphase and metaphase cell pellets were prepared for FISH analysis by standard hypotonic treatment and fixation after colcemid exposure (10mg/ml) for 2 hours. Before hybridization, cells were pre-treated with pepsin (100 mg/ml) (Sigma) and 0.01 M HCl at 37°C (5 min), fixed in 1% formaldehyde (Sigma) (10 min), and dehydrated in an ethanol series. Fosmid and bacterial artificial chromosome (BAC) probes were
obtained from BACPAC Resource Center (CHORI) and grown follow-ing vendor instructions. DNA was extracted with Nucleobond PC500 (Macherey-Nagel), followed by labeling with either biotin-16–dUTP (Roche) or digoxigenin-11–dUTP (Roche) with an Enzo Nick Transla-tion DNA labeling system. About 20 ng of each probe was used per hy-bridization in addition to 10mg of Cot-1 DNA (Invitrogen). The slide and probe mixes were co-denatured on a hot plate set at 75°C and hy-bridized overnight at 37°C. Posthybridization washes were performed at 45°C in 50% prewarmed formamide/2× SSC solution (twice), followed by two washes in 2× SSC (twice). Slides were blocked with blocking re-agent (Roche), followed by incubation with avidin-conjugated fluores-cein isothiocyanate (FITC) (Roche) and anti–digoxigenin-rhodamine (Roche), respectively. 4′,6-Diamidino-2-phenylindole (DAPI) counter-stain (Vector Laboratories) was then used to counter-stain the nuclei to enable visualization. Slides were mounted with Vectashield (Vector Laboratories). Fluorescence images were captured with a 60× objective using a cooled charge-coupled device (CCD) camera attached to a Nikon fluorescence microscope. Automated image capture was performed with ISIS soft-ware (Metasystems).
RLM-RACE
5′ RACE. RACE was performed with the FirstChoice RLM-RACE kit (Applied Biosystems). Total RNA (10mg) was first treated with calf intestinal alkaline phosphatase (CIP) to remove 5′ phos-phate groups, followed by tobacco acid pyrophosphatase to remove 5′ cap structures. After RNA linker ligation, mRNA transcripts were reverse-transcribed with Moloney murine leukemia virus (MMLV) reverse transcriptase. To amplify first-strand cDNAs, we performed outer 5′ PCR using 5′ RACE outer primers and a SLC1A2 exon 3 primer (ACACACTGCTCCCAGGATGA) with SuperTaq Plus poly-merase (Applied Biosystems). Subsequently, inner 5′ PCR was per-formed with a 5′ RACE inner primer (provided in kit) and a SLC1A2 exon 2 primer (AGCCAAGATGACTGTCGTGCATTC). After gel electrophoresis, PCR bands of interest were excised and cloned into pCR 4-TOPO (Invitrogen) vectors. Purified plasmid DNAs were sequenced bidirectionally on an ABI 3730 automated se-quencer (Applied Biosystems). A minimum of five independent col-onies were sequenced in each experiment.
3′ RACE. RACE was performed with the FirstChoice RLM-RACE kit (Applied Biosystems). Total RNA (1 mg) was reverse-transcribed with a 3′ RACE adaptor and reverse transcriptase provided in the kit. To amplify first-strand cDNAs, we performed outer 3′ PCR using 3′ RACE outer primers and a SLC1A2 exon 1 primer (TTG-AGGCGCTAAAGGGCTTACC) with SuperTaq Plus polymerase (Applied Biosystems). Subsequently, inner 3′ PCR was performed with a 3′ RACE inner primer (provided in kit) and a separate SLC1A2 exon 1 primer (CAGACCATGGCATCTACGGAAGG). After gel electro-phoresis, PCR bands of interest were excised and cloned into PCR 4-TOPO (Invitrogen) vectors. Purified plasmid DNAs were sequenced bidirectionally on an ABI 3730 automated sequencer (Applied Biosys-tems). A minimum of five independent colonies were sequenced in each experiment.
Semiquantitative and quantitative RT-PCR
Semiquantitative RT-PCR. GC RNAs were reverse-transcribed by SuperScript II reverse transcriptase enzyme with oligo-dT (T18) primers (Invitrogen). To detect CD44-SLC1A2, we performed RT-PCR using forward primers to CD44 exon 1
on November 26, 2013
stm.sciencemag.org
TTTGGTGGCA) and reverse primers to SLC1A2 exon 3 (GTA-TATCCCCTGGGAAGGCT), exon 4 (CAGCTGCTTCTTGAGCT-TGGGA), exon 5 (AAGCAGGCTTGGACAAGGTT), or exon 6 (CTCGTTCAACAGAGAGACAACAGC). Products were resolved by gel electrophoresis, and bands of interest were excised and cloned for subsequent analysis. To evaluate wild-type CD44 and SLC1A2 expression independently of CD44-SLC1A2, we used CD44 primers targeting exons 3 to 5, and SLC1A2 primers targeting exon 1. CD44-SLC1A2 RT-PCR involving clinical specimens (Fig. 3) was per-formed in an unselected cohort of GC patients. Reactions were re-peated a minimum of three independent times.
Quantitative RT-PCR. SNU16 GC cells lines and nine primary gastric tumors were selected for quantitative RT-PCR (qRT-PCR) analysis. T1, T2, and T3 were group 1 gastric tumors that are 11p13 amplification–negative and fusion-negative; T4, T5, and T6 are group 2 tumors that are 11p13-amplified but do not express CD44-SLC1A2; T7, T8, and T9 were group 3 tumors expressing CD44-SLC1A2 but are 11p13-nonamplified. Briefly, 2 mg of RNA was reverse-transcribed by SuperScript III reverse transcriptase en-zyme with oligo-dT (T18) primers (Invitrogen). qRT-PCR was per-formed with QuantiFast SYBR Green PCR kit (Qiagen) following the manufacturer’s instructions. Primers used were the following: fusion forward primer targeting CD44 exon 1 (TTCGGTCCGCCATCCT-CGTC) and reverse primer targeting SLC1A2 exon 2 (CACTTC-CACCTGCTTGGGCA); SLC1A2 exon 1 forward primer (GCCCGTTGAGGCGCTAAAGG) and reverse primer (AGCAC-TATCCGGCAGCTGTG); and GAPDH forward primer (CCACCCAGAAGACTGTGGATGG) and reverse primer (CACT-GACACGTTGGCAGTGG). Samples were analyzed with Applied Biosystems 7900HT system.
DNA sequencing
Purified PCR products were sequenced in forward and reverse direc-tions with the ABI PRISM BigDye Terminator Cycle Sequencing Ready Reaction kit (version 3) and ABI PRISM 3730 Genetic Analyzer (Applied Biosystems). Chromatograms were analyzed by SeqScape V2.5 and manual review.
Fiber-FISH
SNU16 cells and control cells (normal lymphoblastoid CCL159) were grown in RPMI 1640 enriched with 15% fetal bovine serum (FBS), 1% penicillin-streptomycin, and 1%L-glutamine. Each cell suspension (2
to 3 ml) was centrifuged at 1200 rpm for 12 min and then washed with 6 ml of phosphate-buffered saline (PBS) twice. Pellets were diluted with PBS to a final concentration of about 2 × 10⁴to 3 × 10⁴/ml. Each cell suspension (10ml) was spread on a poly-L-lysine (Sigma)–coated
slide, air-dried, and then fitted into a Cadenza coverslip according to the manufacturer’s recommendations (Thermo Shandon). Freshly made lysis solution (150ml) (5:2 70 mM NaOH/absolute ethanol) was applied to the slides, followed by 150ml of 96% ethanol. Slides were air-dried at room temperature, treated with 3:1 acetic acid/ethanol fix-ative for 5 min, and dehydrated in ethanol series (70, 90, and 100%) for 3 min each. The FISH procedure was then applied.
Long-range genomic PCR
CD44/SLC1A2 chromosomal inversions were detected with a long-range PCR kit (Qiagen) following the manufacturer’s instructions. Reactions were performed with a forward primer at CD44 exon
1 (GAAGAAAGCCAGTGCGTCTC, positive strand) and a reverse primer at SLC1A2 intron 1 in the minimal breakpoint region (GAGGGCTGTCCTTAACGCCTAGC, negative strand). Exper-iments were repeated a minimum of three independent times. Western blotting
Cells were harvested in lysis buffer [10 mM tris-Cl (pH 7.5), 150 mM NaCl, 1% Triton X-114] for 1 hour at 4°C and centrifuged at 800g. Supernatants were incubated at 30°C for 5 to 10 min and further cen-trifuged at 300g at room temperature. Western blotting was performed on membrane fractions with the following antibodies and dilutions: SLC1A2/EAAT2 (1:500; Cell Signaling Technology) and a-tubulin (1:2000; Cell Signaling Technology). Experiments were repeated a minimum of three independent times.
Immunofluorescence staining
Cells were fixed with 3.7% formaldehyde followed by permeabilization with 0.1% Triton X-100. After three washes with 1× PBS, cells were blocked with 1% bovine serum albumin (BSA). Subsequently, cells were incubated with primary SLC1A2 antibodies (Cell Signaling Technology) for 2 hours followed by 2-hour secondary antibody (Sigma) incubation. Images were taken with a Nikon Eclipse TE2000-U microscope. CD44-SLC1A2 siRNA transfections and overexpression GC cells were transfected with either specific siRNAs targeted to the CD44-SLC1A2 fusion site (100 nM, custom siRNA siGENOME with SMART selection, Dharmacon) or negative control scrambled siRNAs with siPORT NeoFX transfection reagent (Applied Biosystems) in Opti-MEM (Invitrogen) following the manufacturer’s protocol. After 24, 48, and 72 hours of siRNA treatment, cells were subjected for downstream analysis. For wild-type SLC1A2 siRNAs, GC cells were transfected with specific nonoverlapping siRNAs targeted to either SLC1A2 exon 1 or SLC1A2 downstream regions (100 nM, custom siRNA siGENOME with SMART selection, Dharmacon) or negative control scrambled siRNAs with siPORT NeoFX transfection reagent (Applied Biosystems) in Opti-MEM (Invitrogen) following the manufacturer’s protocol. For overexpression studies, the full-length coding regions of CD44-SLC1A2 cDNA were inserted into the pEGFP-N1 vector. Control vectors or fusion green fluorescent protein (GFP) vectors were introduced into HFE145 cells, and stable transfectants were selected with G418 (stable overexpres-sion) or puromycin (stable knockdown) for 4 weeks.
Cell proliferation assay and invasion assays
Cell proliferation assays were performed with a CellTiter96 Aqueous Nonradioactive Cell Proliferation Assay kit (Promega) following the manufacturer’s instructions, and the plates were measured with a Perkin-Elmer plate reader. Cell invasion assays were performed with Biocoat Matrigel invasion chambers with 8-mm pore filter inserts (BD Biosciences). Forty-eight hours after transfection, 5 × 10⁴cells were transferred to the upper Matrigel chamber in 500ml of serum-free medium and incubated for 24 hours. Invading cells were counted with light microscopy. Each assay was performed in triplicate, and the results were averaged over three independent experiments.
Colony formation assays
Base layers of 0.5% gum agar in 1× McCoy’s 5A and 10% FBS were poured into six-well plates and allowed to harden at 4°C. After 48 hours of siRNA transfection, 50,000 cells per well were seeded in complete
on November 26, 2013
stm.sciencemag.org
medium plus agar mixture at 42°C and seeded on top of the solidified base layer. Plates were incubated at 37°C for 3 to 4 weeks, during which plates were fed dropwise with complete medium. After 3 to 4 weeks, plates were photographed with the Kodak GL 200 System (EpiWhite illumination). Each assay was performed in triplicate, and the results were averaged over three independent experiments.
Glutamate assays and drug treatments
GC cells and primary tissues were lysed in glutamate assay buffer, and glutamate concentrations were determined with a Glutamate Assay Kit (BioVision). Briefly, to each cellular lysate, a vendor-provided gluta-mate enzyme mix was added, which recognizes glutagluta-mate as a specific substrate, leading to proportional color development. For cisplatin treatments, cells were seeded into 96-well plates after siRNA transfec-tion. Subsequently, cisplatin or 5-FU at increasing dosages (0 to 1 mM) was added to respective wells. Cells were subjected to MTS [3-(4,5- dimethylthiazol-2-yl)-5-(3-carboxymethoxyphenyl)-2-(4-sulfophenyl)-2H-tetrazolium] proliferation assays after 48 hours of drug treatment. Each assay was performed in triplicate, and the results were averaged over three independent experiments.
Copy number analysis (Affymetrix)
Affymetrix SNP6 arrays were processed with Affymetrix GTC 4.0 software, and tumor profiles were normalized against a matched normal reference. The data were visualized with Nexus 5.0 software (Biodiscovery). A rank segmentation algorithm, a variation of the seg-mentation method based on circular binary segseg-mentation, was used to segment the copy number data across the genome.
Gene expression analysis
Gene expression data are available from the Gene Expression Omnibus database under accession number GSE15460. Gene expression profiles (Affymetrix U133P2 arrays) were normalized with the MAS5 algorithm. Comparisons between CD44 and SLC1A2 expression values were per-formed on a subset of 45 samples for which gene expression, copy number information, and CD44-SLC1A2 gene fusion status were available. Unsupervised clustering was based on all probe sets after removing the bottom 25% of probes with the lowest interquantile range. Hierar-chical clustering and Wilcoxon signed rank tests were performed with R software 2.9.0. FDR q-value calculations were calculated with the R package“qvalue.” GO analysis was performed with the DAVID database. Statistical analysis
Experiments were assessed by Student’s unpaired t test, with the excep-tion of the tumor/normal glutamate measurements, where a paired t test was used. P values of <0.05 were considered statistically significant.
SUPPLEMENTARY MATERIAL
www.sciencetranslationalmedicine.org/cgi/content/full/3/77/77ra30/DC1
Fig. S1. MYC, ERBB2, RAB23, and PTEN genomic aberrations in SNU16, N87, HS746T, and TMK1 cells detected by aCGH.
Fig. S2. 3′ RACE and full-length CD44-SLC1A2 expression in SNU16 cells. Fig. S3. Chromosomal inversion model of CD44-SLC1A2 gene fusion.
Fig. S4. Predicted protein structure of CD44-SLC1A2 and expression in primary GCs. Fig. S5. Silencing CD44-SLC1A2 with a second fusion-specific siRNA inhibits cellular prolifera-tion, invasion, and colony formation.
Fig. S6. CD44-SLC1A2 silencing does not affect AGS cells. Fig. S7. Soft agar assays with two fusion-specific siRNAs.
Fig. S8. Reduction of cellular proliferation in fusion-negative AGS cells after silencing of wild-type SLC1A2.
Fig. S9. CD44-SLC1A2 knockdown does not sensitize cells to 5-fluorouracil chemotherapy. Fig. S10. Unsupervised clustering of GC expression profiles reveals clustering of high SLC1A2– expressing tumors.
Fig. S11. 11p13 copy number status in CD44-SLC1A2–expressing samples.
Fig. S12. CD44 and SLC1A2 expression levels of 11p13-nonamplified, 11p13-amplified, and fusion-positive samples.
Table S1. Gene exhibiting genomic breakpoints.
Table S2. Gene ontology analysis of high SLC1A2–expressing tumors. References
REFERENCES AND NOTES
1. H. Brenner, D. Rothenbacher, V. Arndt, Epidemiology of stomach cancer. Methods Mol. Biol. 472, 467–477 (2009).
2. H. H. Hartgrink, E. P. Jansen, N. C. van Grieken, C. J. van de Velde, Gastric cancer. Lancet 374, 477–490 (2009).
3. F. Kamangar, G. M. Dores, W. F. Anderson, Patterns of cancer incidence, mortality, and prevalence across five continents: Defining priorities to reduce cancer disparities in differ-ent geographic regions of the world. J. Clin. Oncol. 24, 2137–2150 (2006).
4. W. C. Lee, Breast, stomach and colorectal cancer screening in Korea. J. Med. Screen. 13 (Suppl. 1), S20–S22 (2006).
5. C. Hamashima, D. Shibuya, H. Yamazaki, K. Inoue, A. Fukao, H. Saito, T. Sobue, The Japanese guidelines for gastric cancer screening. Jpn. J. Clin. Oncol. 38, 259–267 (2008).
6. C. Jackson, D. Cunningham, J. Oliveira; ESMO Guidelines Working Group, Gastric cancer: ESMO clinical recommendations for diagnosis, treatment and follow-up. Ann. Oncol. 20 (Suppl. 4), 34–36 (2009).
7. E. M. El-Omar, M. Carrington, W. H. Chow, K. E. McColl, J. H. Bream, H. A. Young, J. Herrera, J. Lissowska, C. C. Yuan, N. Rothman, G. Lanyon, M. Martin, J. F. Fraumeni Jr., C. S. Rabkin, Interleukin-1 polymorphisms associated with increased risk of gastric cancer. Nature 404, 398–402 (2000).
8. G. L. Hold, C. S. Rabkin, W. H. Chow, M. G. Smith, M. D. Gammon, H. A. Risch, T. L. Vaughan, K. E. McColl, J. Lissowska, W. Zatonski, J. B. Schoenberg, W. J. Blot, N. A. Mowat, J. F. Fraumeni Jr., E. M. El-Omar, A functional polymorphism of toll-like receptor 4 gene increases risk of gastric carcinoma and its precursors. Gastroenterology 132, 905–912 (2007).
9. P. Guilford, J. Hopkins, J. Harraway, M. McLeod, N. McLeod, P. Harawira, H. Taite, R. Scoular, A. Miller, A. E. Reeve, E-cadherin germline mutations in familial gastric cancer. Nature 392, 402–405 (1998).
10. G. Tamura, T. Kihana, K. Nomura, M. Terada, T. Sugimura, S. Hirohashi, Detection of fre-quent p53 gene mutations in primary gastric cancer by cell sorting and polymerase chain reaction single-strand conformation polymorphism analysis. Cancer Res. 51, 3056–3058 (1991).
11. Q. L. Li, K. Ito, C. Sakakura, H. Fukamachi, K. Inoue, X. Z. Chi, K. Y. Lee, S. Nomura, C. W. Lee, S. B. Han, H. M. Kim, W. J. Kim, H. Yamamoto, N. Yamashita, T. Yano, T. Ikeda, S. Itohara, J. Inazawa, T. Abe, A. Hagiwara, H. Yamagishi, A. Ooe, A. Kaneda, T. Sugimura, T. Ushijima, S. C. Bae, Y. Ito, Causal relationship between the loss of RUNX3 expression and gastric cancer. Cell 109, 113–124 (2002).
12. K. F. Pan, W. G. Liu, L. Zhang, W. C. You, Y. Y. Lu, Mutations in components of the Wnt signaling pathway in gastric cancer. World J. Gastroenterol. 14, 1570–1574 (2008). 13. S. T. Tay, S. H. Leong, K. Yu, A. Aggarwal, S. Y. Tan, C. H. Lee, K. Wong, J. Visvanathan, D. Lim,
W. K. Wong, K. C. Soo, O. L. Kon, P. Tan, A combined comparative genomic hybridization and expression microarray analysis of gastric cancer reveals novel molecular subtypes. Cancer Res. 63, 3309–3316 (2003).
14. F. Mitelman, B. Johansson, F. Mertens, The impact of translocations and gene fusions on cancer causation. Nat. Rev. Cancer 7, 233–245 (2007).
15. T. H. Rabbitts, T. Boehm, Structural and functional chimerism results from chromosomal translocation in lymphoid tumors. Adv. Immunol. 50, 119–146 (1991).
16. A. de Klein, A. G. van Kessel, G. Grosveld, C. R. Bartram, A. Hagemeijer, D. Bootsma, N. K. Spurr, N. Heisterkamp, J. Groffen, J. R. Stephenson, A cellular oncogene is translocated to the Phil-adelphia chromosome in chronic myelocytic leukaemia. Nature 300, 765–767 (1982). 17. S. H. Ghaffari, S. Rostami, D. Bashash, K. Alimoghaddam, A. Ghavamzadeh, Real-time PCR
analysis of PML-RARa in newly diagnosed acute promyelocytic leukaemia patients treated with arsenic trioxide as a front-line therapy. Ann. Oncol. 17, 1553–1559 (2006). 18. M. Deininger, E. Buchdunger, B. J. Druker, The development of imatinib as a therapeutic
agent for chronic myeloid leukemia. Blood 105, 2640–2653 (2005).
19. S. Heim, F. Mitelman, Molecular screening for new fusion genes in cancer. Nat. Genet. 40, 685–686 (2008).
on November 26, 2013
stm.sciencemag.org
20. S. A. Tomlins, D. R. Rhodes, S. Perner, S. M. Dhanasekaran, R. Mehra, X. W. Sun, S. Varambally, X. Cao, J. Tchinda, R. Kuefer, C. Lee, J. E. Montie, R. B. Shah, K. J. Pienta, M. A. Rubin, A. M. Chinnaiyan, Recurrent fusion of TMPRSS2 and ETS transcription factor genes in prostate cancer. Science 310, 644–648 (2005).
21. M. Soda, Y. L. Choi, M. Enomoto, S. Takada, Y. Yamashita, S. Ishikawa, S. Fujiwara, H. Watanabe, K. Kurashina, H. Hatanaka, M. Bando, S. Ohno, Y. Ishikawa, H. Aburatani, T. Niki, Y. Sohara, Y. Sugiyama, H. Mano, Identification of the transforming EML4–ALK fusion gene in non-small-cell lung cancer. Nature 448, 561–566 (2007).
22. N. Palanisamy, B. Ateeq, S. Kalyana-Sundaram, D. Pflueger, K. Ramnarayanan, S. Shankar, B. Han, Q. Cao, X. Cao, K. Suleman, C. Kumar-Sinha, S. M. Dhanasekaran, Y. B. Chen, R. Esgueva, S. Banerjee, C. J. LaFargue, J. Siddiqui, F. Demichelis, P. Moeller, T. A. Bismar, R. Kuefer, D. R. Fullen, T. M. Johnson, J. K. Greenson, T. J. Giordano, P. Tan, S. A. Tomlins, S. Varambally, M. A. Rubin, C. A. Maher, A. M. Chinnaiyan, Rearrangements of the RAF kinase pathway in prostate cancer, gastric cancer and melanoma. Nat. Med. 16, 793–798 (2010).
23. F. Mitsui, Y. Dobashi, I. Imoto, J. Inazawa, K. Kono, H. Fujii, A. Ooi, Non-incidental coampli-fication of Myc and ERBB2, and Myc and EGFR, in gastric adenocarcinomas. Mod. Pathol. 20, 622–631 (2007).
24. A. Varis, M. Wolf, O. Monni, M. L. Vakkari, A. Kokkola, C. Moskaluk, H. Frierson Jr., S. M. Powell, S. Knuutila, A. Kallioniemi, W. El-Rifai, Targets of gene amplification and overexpression at 17q in gastric cancer. Cancer Res. 62, 2625–2629 (2002).
25. Q. Hou, Y. H. Wu, H. Grabsch, Y. Zhu, S. H. Leong, K. Ganesan, D. Cross, L. K. Tan, J. Tao, V. Gopalakrishnan, B. L. Tang, O. L. Kon, P. Tan, Integrative genomics identifies RAB23 as an invasion mediator gene in diffuse-type gastric cancer. Cancer Res. 68, 4623–4630 (2008).
26. K. Sato, G. Tamura, T. Tsuchiya, Y. Endoh, K. Sakata, T. Motoyama, O. Usuba, W. Kimura, M. Terashima, S. Nishizuka, T. Zou, S. J. Meltzer, Analysis of genetic and epigenetic altera-tions of the PTEN gene in gastric cancer. Virchows Arch. 440, 160–165 (2002). 27. N. Kawamata, S. Ogawa, M. Zimmermann, B. Niebuhr, C. Stocking, M. Sanada, K. Hemminki,
G. Yamatomo, Y. Nannya, R. Koehler, T. Flohr, C. W. Miller, J. Harbott, W. D. Ludwig, M. Stanulla, M. Schrappe, C. R. Bartram, H. P. Koeffler, Cloning of genes involved in chromosomal translo-cations by high-resolution single nucleotide polymorphism genomic microarray. Proc. Natl. Acad. Sci. U.S.A. 105, 11921–11926 (2008).
28. J. G. Park, H. Frucht, R. V. LaRocca, D. P. Bliss Jr., Y. Kurita, T. R. Chen, J. G. Henslee, J. B. Trepel, R. T. Jensen, B. E. Johnson, Y.-J. Bang, J.-P. Kim, A. F. Gazdar, Characteristics of cell lines es-tablished from human gastric carcinoma. Cancer Res. 50, 2773–2780 (1990).
29. P. Akiva, A. Toporik, S. Edelheit, Y. Peretz, A. Diber, R. Shemesh, A. Novik, R. Sorek, Transcription-mediated gene fusion in the human genome. Genome Res. 16, 30–36 (2006). 30. E. Rodriguez, P. H. Rao, M. Ladanyi, N. Altorki, A. P. Albino, D. P. Kelsen, S. C. Jhanwar, R. S. Chaganti, 11p13-15 is a specific region of chromosomal rearrangement in gastric and esophageal adenocarcinomas. Cancer Res. 50, 6410–6416 (1990).
31. R. J. Florijn, L. A. Bonden, H. Vrolijk, J. Wiegant, J. W. Vaandrager, F. Baas, J. T. den Dunnen, H. J. Tanke, G. J. van Ommen, A. K. Raap, High-resolution DNA Fiber-FISH for genomic DNA mapping and colour bar-coding of large genes. Hum. Mol. Genet. 4, 831–836 (1995). 32. M. Akhtar, Y. Cheng, R. M. Magno, H. Ashktorab, D. T. Smoot, S. J. Meltzer, K. T. Wilson,
Promoter methylation regulates Helicobacter pylori-stimulated cyclooxygenase-2 expres-sion in gastric epithelial cells. Cancer Res. 61, 2399–2403 (2001).
33. W. Rzeski, L. Turski, C. Ikonomidou, Glutamate antagonists limit tumor growth. Proc. Natl. Acad. Sci. U.S.A. 98, 6372–6377 (2001).
34. T. Takano, J. H. Lin, G. Arcuino, Q. Gao, J. Yang, M. Nedergaard, Glutamate release pro-motes growth of malignant gliomas. Nat. Med. 7, 1010–1015 (2001).
35. C. Yang, J. Sudderth, T. Dang, R. G. Bachoo, J. G. McDonald, R. J. DeBerardinis, Glioblastoma cells require glutamate dehydrogenase to survive impairments of glucose metabolism or Akt signaling. Cancer Res. 69, 7986–7993 (2009).
36. J. Y. Kim, B. N. Bae, K. S. Kim, E. Shin, K. Park, Osteopontin, CD44, and NFkB expression in gastric adenocarcinoma. Cancer Res. Treat. 41, 29–35 (2009).
37. C. H. Ooi, T. Ivanova, J. Wu, M. Lee, I. B. Tan, J. Tao, L. Ward, J. H. Koo, V. Gopalakrishnan, Y. Zhu, L. L. Cheng, J. Lee, S. Y. Rha, H. C. Chung, K. Ganesan, J. So, K. C. Soo, D. Lim, W. H. Chan, W. K. Wong, D. Bowtell, K. G. Yeoh, H. Grabsch, A. Boussioutas, P. Tan, Oncogenic pathway combinations predict clinical prognosis in gastric cancer. PLoS Genet. 5, e1000676 (2009).
38. X. Wu, T. Kihara, A. Akaike, T. Niidome, H. Sugimoto, PI3K/Akt/mTOR signaling regulates glutamate transporter 1 in astrocytes. Biochem. Biophys. Res. Commun. 393, 514–518 (2010).
39. O. Zelenaia, B. D. Schlag, G. E. Gochenauer, R. Ganel, W. Song, J. S. Beesley, J. B. Grinspan, J. D. Rothstein, M. B. Robinson, Epidermal growth factor receptor agonists increase ex-pression of glutamate transporter GLT-1 in astrocytes through pathways dependent on phosphatidylinositol 3-kinase and transcription factor NF-kB. Mol. Pharmacol. 57, 667–678 (2000).
40. Y. Fukuda, N. Kurihara, I. Imoto, K. Yasui, M. Yoshida, K. Yanagihara, J. G. Park, Y. Nakamura, J. Inazawa, CD44 is a potential target of amplification within the 11p13 amplicon detected in gastric cancer cell lines. Genes Chromosomes Cancer 29, 315–324 (2000).
41. C. G. Mullighan, S. Goorha, I. Radtke, C. B. Miller, E. Coustan-Smith, J. D. Dalton, K. Girtman, S. Mathew, J. Ma, S. B. Pounds, X. Su, C. H. Pui, M. V. Relling, W. E. Evans, S. A. Shurtleff, J. R. Downing, Genome-wide analysis of genetic alterations in acute lymphoblastic leu-kaemia. Nature 446, 758–764 (2007).
42. R. Beroukhim, C. H. Mermel, D. Porter, G. Wei, S. Raychaudhuri, J. Donovan, J. Barretina, J. S. Boehm, J. Dobson, M. Urashima, K. T. Mc Henry, R. M. Pinchback, A. H. Ligon, Y. J. Cho, L. Haery, H. Greulich, M. Reich, W. Winckler, M. S. Lawrence, B. A. Weir, K. E. Tanaka, D. Y. Chiang, A. J. Bass, A. Loo, C. Hoffman, J. Prensner, T. Liefeld, Q. Gao, D. Yecies, S. Signoretti, E. Maher, F. J. Kaye, H. Sasaki, J. E. Tepper, J. A. Fletcher, J. Tabernero, J. Baselga, M. S. Tsao, F. Demichelis, M. A. Rubin, P. A. Janne, M. J. Daly, C. Nucera, R. L. Levine, B. L. Ebert, S. Gabriel, A. K. Rustgi, C. R. Antonescu, M. Ladanyi, A. Letai, L. A. Garraway, M. Loda, D. G. Beer, L. D. True, A. Okamoto, S. L. Pomeroy, S. Singer, T. R. Golub, E. S. Lander, G. Getz, W. R. Sellers, M. Meyerson, The landscape of somatic copy-number alteration across human cancers. Nature 463, 899–905 (2010).
43. R. J. DeBerardinis, T. Cheng, Q’s next: The diverse functions of glutamine in metabolism, cell biology and cancer. Oncogene 29, 313–324 (2010).
44. P. Nicklin, P. Bergman, B. Zhang, E. Triantafellow, H. Wang, B. Nyfeler, H. Yang, M. Hild, C. Kung, C. Wilson, V. E. Myer, J. P. MacKeigan, J. A. Porter, Y. K. Wang, L. C. Cantley, P. M. Finan, L. O. Murphy, Bidirectional transport of amino acids regulates mTOR and autophagy. Cell 136, 521–534 (2009).
45. C. V. Dang, Rethinking the Warburg effect with Myc micromanaging glutamine metabo-lism. Cancer Res. 70, 859–862 (2010).
46. A. Okada, H. Takehara, K. Yoshida, M. Nishi, H. Miyake, Y. Kita, N. Komi, Increased aspartate and glutamate levels in both gastric and colon cancer tissues. Tokushima J. Exp. Med. 40, 19–25 (1993).
47. Funding: Supported by grants BMRC 05/1/31/19/423, NMRC TCR/001/2007, and institu-tional funding from Duke-NUS and Cancer Sciences Institute of Singapore. Author con-tributions: J.T. designed and performed the experiments. N.T.D., I.B.T., and C.H.O. analyzed the data. K.R., B.H., H.K.O., S.H.L., S.S.L., and V.C. performed additional experi-ments. J.W., M.L., and S.Z. performed microarray profiling and sequencing. S.Y.R., H.C.C., D.T.S., and H.A. contributed cell lines and other reagents. O.L.K., C.Y., and N.P. supervised the research. P.T. provided funding and wrote the paper. Competing interests: The authors de-clare that they have no competing interests. As required for research projects funded by the Singapore government, the current work is being evaluated by Exploit Technologies Pte Ltd., the intellectual property arm of the Agency for Science Technology and Research, Singapore, for the possibility of filing a patent.
Submitted 28 June 2010 Accepted 18 March 2011 Published 6 April 2011 10.1126/scitranslmed.3001423
Citation: J. Tao, N. T. Deng, K. Ramnarayanan, B. Huang, H. K. Oh, S. H. Leong, S. S. Lim, I. B. Tan, C. H. Ooi, J. Wu, M. Lee, S. Zhang, S. Y. Rha, H. C. Chung, D. T. Smoot, H. Ashktorab, O. L. Kon, V. Cacheux, C. Yap, N. Palanisamy, P. Tan, CD44-SLC1A2 gene fusions in gastric cancer. Sci. Transl. Med. 3, 77ra30 (2011).
on November 26, 2013
stm.sciencemag.org